Estatísticas Básicas
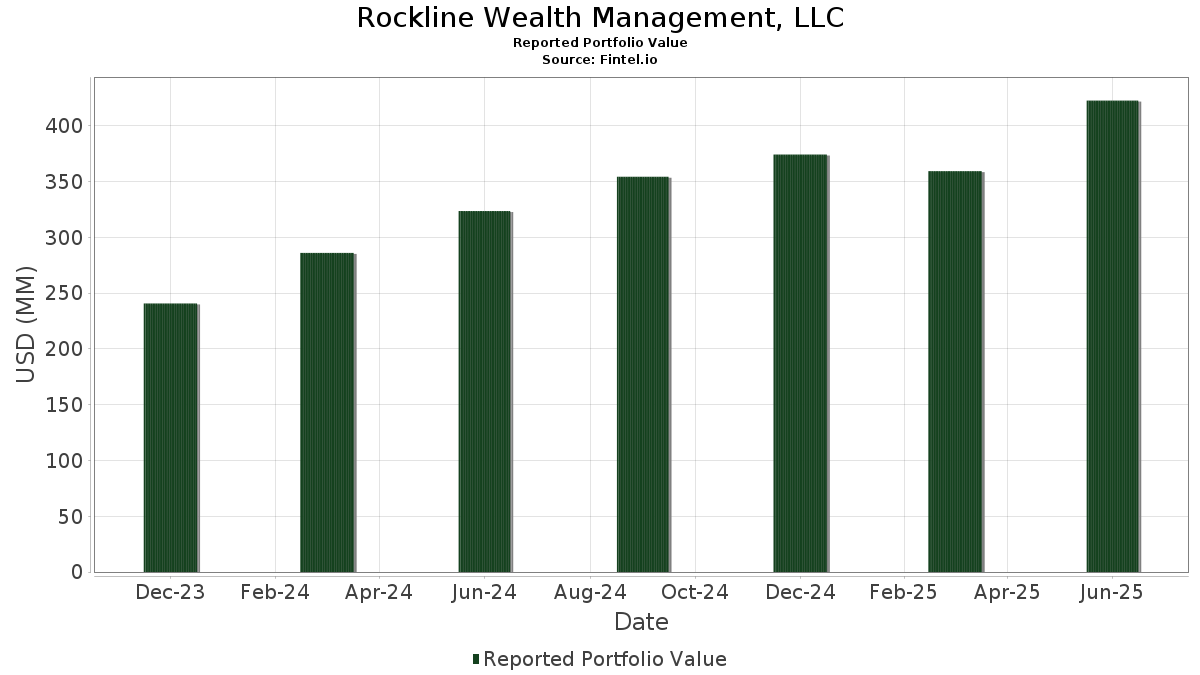
| Valor do Portfólio | $ 483,069,344 |
| Posições Atuais | 103 |
Últimas Participações, Desempenho, AUM (de 13F, 13D)
Rockline Wealth Management, LLC divulgou 103 participações totais em seus últimos arquivamentos da SEC. O valor mais recente da carteira é calculado como $ 483,069,344 USD. O Ativo Total Sob Gestão (AUM) é esse valor mais o caixa (que não é divulgado). As principais posições de Rockline Wealth Management, LLC são Direxion Shares ETF Trust - Direxion Daily NVDA Bear 1X Shares (US:NVDD) , Apple Inc. (US:AAPL) , Microsoft Corporation (US:MSFT) , Meta Platforms, Inc. (US:META) , and Palantir Technologies Inc. (US:PLTR) . As novas posições de Rockline Wealth Management, LLC incluem Kratos Defense & Security Solutions, Inc. (US:KTOS) , Northrop Grumman Corporation (US:NOC) , Provident Financial Services, Inc. (US:PFS) , Oklo Inc. (US:OKLO) , and Norfolk Southern Corporation (US:NSC) .
Maiores Aumentos Este Trimestre
Usamos a mudança na alocação do portfólio porque esta é a métrica mais significativa. As mudanças podem ser devido a operações ou mudanças nos preços das ações.
| Ativo | Ações (MM) |
Valor (MM$) |
% do Portfólio | Δ% do Portfólio |
|---|---|---|---|---|
| 0.06 | 5.29 | 1.0955 | 1.0955 | |
| 0.05 | 17.74 | 3.6721 | 0.7459 | |
| 0.06 | 15.05 | 3.1155 | 0.6572 | |
| 0.42 | 77.67 | 16.0781 | 0.6140 | |
| 0.06 | 16.03 | 3.3186 | 0.5617 | |
| 0.14 | 35.69 | 7.3878 | 0.5493 | |
| 0.11 | 20.62 | 4.2676 | 0.4748 | |
| 0.02 | 7.01 | 1.4518 | 0.4383 | |
| 0.06 | 7.47 | 1.5457 | 0.3738 | |
| 0.03 | 3.13 | 0.6488 | 0.1422 |
Maiores Diminuições Este Trimestre
Usamos a mudança na alocação do portfólio porque esta é a métrica mais significativa. As mudanças podem ser devido a operações ou mudanças nos preços das ações.
| Ativo | Ações (MM) |
Valor (MM$) |
% do Portfólio | Δ% do Portfólio |
|---|---|---|---|---|
| 0.06 | 29.13 | 6.0309 | -0.5684 | |
| 0.03 | 23.84 | 4.9361 | -0.4723 | |
| 0.01 | 8.76 | 1.8136 | -0.3607 | |
| 0.01 | 2.93 | 0.6062 | -0.2650 | |
| 0.03 | 9.72 | 2.0117 | -0.2517 | |
| 0.04 | 9.69 | 2.0062 | -0.2397 | |
| 0.03 | 4.59 | 0.9511 | -0.2234 | |
| 0.02 | 5.37 | 1.1114 | -0.1992 | |
| 0.02 | 3.57 | 0.7392 | -0.1957 | |
| 0.01 | 3.99 | 0.8257 | -0.1898 |
Arquivamentos 13F e Fundo
Este formulário foi arquivado em 2025-11-03 para o período de relatório 2025-09-30. Clique no ícone de link para ver o histórico completo da transação.
Atualize para desbloquear dados premium e exportar para Excel ![]() .
.
| Ativo | Tipo | Preço Médio por Ação | Ações (MM) |
ΔAções (%) |
Valor ($MM) |
ΔAções (%) |
Portfólio (%) |
ΔPortfólio (%) |
|
|---|---|---|---|---|---|---|---|---|---|
| NVDD / Direxion Shares ETF Trust - Direxion Daily NVDA Bear 1X Shares | 0.42 | 0.63 | 77.67 | 18.84 | 16.0781 | 0.6140 | |||
| AAPL / Apple Inc. | 0.14 | -0.51 | 35.69 | 23.48 | 7.3878 | 0.5493 | |||
| MSFT / Microsoft Corporation | 0.06 | 0.31 | 29.13 | 4.45 | 6.0309 | -0.5684 | |||
| META / Meta Platforms, Inc. | 0.03 | 4.84 | 23.84 | 4.32 | 4.9361 | -0.4723 | |||
| PLTR / Palantir Technologies Inc. | 0.11 | -3.89 | 20.62 | 28.61 | 4.2676 | 0.4748 | |||
| AVGO / Broadcom Inc. | 0.05 | 19.84 | 17.74 | 43.43 | 3.6721 | 0.7459 | |||
| ORCL / Oracle Corporation | 0.06 | 6.95 | 16.03 | 37.58 | 3.3186 | 0.5617 | |||
| GOOG / Alphabet Inc. | 0.06 | 5.50 | 15.05 | 44.86 | 3.1155 | 0.6572 | |||
| HD / The Home Depot, Inc. | 0.03 | 0.83 | 12.41 | 11.43 | 2.5685 | -0.0661 | |||
| JPM / JPMorgan Chase & Co. | 0.03 | 0.75 | 10.82 | 9.62 | 2.2394 | -0.0956 | |||
| V / Visa Inc. | 0.03 | 5.66 | 9.72 | 1.58 | 2.0117 | -0.2517 | |||
| AMZN / Amazon.com, Inc. | 0.04 | 2.01 | 9.69 | 2.10 | 2.0062 | -0.2397 | |||
| COST / Costco Wholesale Corporation | 0.01 | 1.96 | 8.76 | -4.66 | 1.8136 | -0.3607 | |||
| WMT / Walmart Inc. | 0.08 | 1.44 | 8.49 | 6.92 | 1.7572 | -0.1213 | |||
| ABBV / AbbVie Inc. | 0.03 | 0.32 | 7.58 | 25.12 | 1.5692 | 0.1359 | |||
| LRCX / Lam Research Corporation | 0.06 | 9.60 | 7.47 | 50.77 | 1.5457 | 0.3738 | |||
| TSLA / Tesla, Inc. | 0.02 | 16.94 | 7.01 | 63.74 | 1.4518 | 0.4383 | |||
| BX / Blackstone Inc. | 0.04 | 0.22 | 6.84 | 14.47 | 1.4162 | 0.0021 | |||
| RTX / RTX Corporation | 0.04 | 4.50 | 6.21 | 19.75 | 1.2857 | 0.0586 | |||
| GD / General Dynamics Corporation | 0.02 | 2.00 | 5.95 | 19.25 | 1.2325 | 0.0512 | |||
| JNJ / Johnson & Johnson | 0.03 | -0.32 | 5.82 | 20.99 | 1.2053 | 0.0667 | |||
| NFLX / Netflix, Inc. | 0.00 | 11.24 | 5.78 | -0.41 | 1.1957 | -0.1764 | |||
| MA / Mastercard Incorporated | 0.01 | 8.54 | 5.40 | 9.86 | 1.1185 | -0.0452 | |||
| WM / Waste Management, Inc. | 0.02 | 0.43 | 5.37 | -3.09 | 1.1114 | -0.1992 | |||
| PANW / Palo Alto Networks, Inc. | 0.03 | 11.00 | 5.36 | 10.44 | 1.1106 | -0.0388 | |||
| MCD / McDonald's Corporation | 0.02 | 1.02 | 5.33 | 5.08 | 1.1043 | -0.0969 | |||
| SPGI / S&P Global Inc. | 0.01 | 7.36 | 5.30 | -0.90 | 1.0961 | -0.1681 | |||
| KTOS / Kratos Defense & Security Solutions, Inc. | 0.06 | 5.29 | 1.0955 | 1.0955 | |||||
| ITW / Illinois Tool Works Inc. | 0.02 | 1.26 | 4.81 | 6.80 | 0.9953 | -0.0699 | |||
| MRKCL / Merck & Co., Inc. | 0.05 | -0.54 | 4.61 | 5.44 | 0.9544 | -0.0800 | |||
| GJR / Strats Trust For Procter & Gambel Security - Preferred Security | 0.03 | -4.03 | 4.59 | -7.45 | 0.9511 | -0.2234 | |||
| NEE / NextEra Energy, Inc. | 0.06 | -2.37 | 4.47 | 6.17 | 0.9263 | -0.0709 | |||
| ADP / Automatic Data Processing, Inc. | 0.01 | -2.35 | 3.99 | -7.06 | 0.8257 | -0.1898 | |||
| GPC / Genuine Parts Company | 0.03 | 2.29 | 3.95 | 16.87 | 0.8175 | 0.0180 | |||
| LOW / Lowe's Companies, Inc. | 0.02 | 0.79 | 3.94 | 14.16 | 0.8147 | -0.0009 | |||
| AEP / American Electric Power Company, Inc. | 0.03 | 4.94 | 3.61 | 13.80 | 0.7478 | -0.0034 | |||
| DOV / Dover Corporation | 0.02 | -0.74 | 3.57 | -9.62 | 0.7392 | -0.1957 | |||
| PNC / The PNC Financial Services Group, Inc. | 0.02 | 2.52 | 3.29 | 10.52 | 0.6807 | -0.0234 | |||
| PSX / Phillips 66 | 0.02 | 3.66 | 3.25 | 18.17 | 0.6733 | 0.0221 | |||
| SO / The Southern Company | 0.03 | 0.11 | 3.16 | 3.33 | 0.6544 | -0.0695 | |||
| NUE / Nucor Corporation | 0.02 | 0.99 | 3.16 | 5.58 | 0.6541 | -0.0540 | |||
| UBER / Uber Technologies, Inc. | 0.03 | 39.41 | 3.13 | 46.38 | 0.6488 | 0.1422 | |||
| XOM / Exxon Mobil Corporation | 0.03 | 2.77 | 3.11 | 7.50 | 0.6438 | -0.0408 | |||
| VZ / Verizon Communications Inc. | 0.07 | 3.02 | 3.02 | 4.61 | 0.6247 | -0.0577 | |||
| CRM / Salesforce, Inc. | 0.01 | -8.49 | 2.93 | -20.48 | 0.6062 | -0.2650 | |||
| PEP / PepsiCo, Inc. | 0.02 | 1.25 | 2.78 | 7.70 | 0.5763 | -0.0354 | |||
| TXN / Texas Instruments Incorporated | 0.01 | 2.80 | 2.66 | -9.01 | 0.5496 | -0.1410 | |||
| VRT / Vertiv Holdings Co | 0.02 | 17.60 | 2.50 | 38.16 | 0.5180 | 0.0895 | |||
| PEG / Public Service Enterprise Group Incorporated | 0.03 | 2.37 | 2.38 | 1.49 | 0.4923 | -0.0621 | |||
| VST / Vistra Corp. | 0.01 | 16.40 | 2.37 | 17.66 | 0.4912 | 0.0141 | |||
| KMB / Kimberly-Clark Corporation | 0.02 | 2.58 | 2.25 | -1.06 | 0.4651 | -0.0722 | |||
| MCO / Moody's Corporation | 0.00 | 19.43 | 1.90 | 13.41 | 0.3941 | -0.0030 | |||
| NOW / ServiceNow, Inc. | 0.00 | 21.40 | 1.85 | 8.68 | 0.3836 | -0.0199 | |||
| SPY / SPDR S&P 500 ETF | 0.00 | -2.08 | 1.38 | 5.59 | 0.2858 | -0.0236 | |||
| GOOGL / Alphabet Inc. | 0.01 | 0.00 | 1.27 | 38.03 | 0.2638 | 0.0452 | |||
| INTU / Intuit Inc. | 0.00 | 44.33 | 1.22 | 25.10 | 0.2518 | 0.0218 | |||
| CRWV / CoreWeave, Inc. | 0.01 | 28.51 | 1.03 | 7.78 | 0.2124 | -0.0127 | |||
| BLK / BlackRock, Inc. | 0.00 | -0.93 | 0.99 | 10.02 | 0.2047 | -0.0078 | |||
| ED / Consolidated Edison, Inc. | 0.01 | 0.00 | 0.96 | 0.21 | 0.1994 | -0.0281 | |||
| PM / Philip Morris International Inc. | 0.00 | 0.00 | 0.70 | -10.94 | 0.1449 | -0.0411 | |||
| FDN / First Trust Exchange-Traded Fund - First Trust Dow Jones Internet Index Fund | 0.00 | 0.00 | 0.63 | 3.78 | 0.1308 | -0.0131 | |||
| NOC / Northrop Grumman Corporation | 0.00 | 0.62 | 0.1284 | 0.1284 | |||||
| BRK.B / Berkshire Hathaway Inc. | 0.00 | -6.75 | 0.54 | -3.57 | 0.1122 | -0.0207 | |||
| SPYG / SPDR Series Trust - State Street SPDR Portfolio S&P 500 Growth ETF | 0.01 | -3.63 | 0.52 | 5.65 | 0.1086 | -0.0089 | |||
| MDY / SPDR S&P MidCap 400 ETF Trust | 0.00 | 0.00 | 0.51 | 5.17 | 0.1055 | -0.0091 | |||
| CAT / Caterpillar Inc. | 0.00 | 0.00 | 0.50 | 22.85 | 0.1036 | 0.0073 | |||
| COIN / Coinbase Global, Inc. | 0.00 | 0.00 | 0.48 | -3.64 | 0.0988 | -0.0185 | |||
| LIN / Linde plc | 0.00 | 0.00 | 0.46 | 1.32 | 0.0955 | -0.0123 | |||
| MLI / Mueller Industries, Inc. | 0.00 | 0.00 | 0.43 | 27.35 | 0.0897 | 0.0091 | |||
| IBM / International Business Machines Corporation | 0.00 | 6.89 | 0.43 | 2.15 | 0.0888 | -0.0104 | |||
| ADI / Analog Devices, Inc. | 0.00 | 0.00 | 0.39 | 3.22 | 0.0798 | -0.0086 | |||
| MSI / Motorola Solutions, Inc. | 0.00 | -0.88 | 0.36 | 7.51 | 0.0743 | -0.0045 | |||
| HOOD / Robinhood Markets, Inc. | 0.00 | 0.00 | 0.35 | 53.33 | 0.0715 | 0.0181 | |||
| AMGN / Amgen Inc. | 0.00 | -1.94 | 0.34 | -0.87 | 0.0710 | -0.0109 | |||
| ABT / Abbott Laboratories | 0.00 | 0.00 | 0.34 | -1.45 | 0.0706 | -0.0113 | |||
| VUG / Vanguard Index Funds - Vanguard Growth ETF | 0.00 | 11.62 | 0.33 | 22.47 | 0.0677 | 0.0043 | |||
| HON / Honeywell International Inc. | 0.00 | -1.44 | 0.32 | -10.96 | 0.0658 | -0.0186 | |||
| PFS / Provident Financial Services, Inc. | 0.02 | 0.30 | 0.0622 | 0.0622 | |||||
| SHW / The Sherwin-Williams Company | 0.00 | 0.00 | 0.29 | 1.03 | 0.0609 | -0.0081 | |||
| AFL / Aflac Incorporated | 0.00 | 0.00 | 0.29 | 5.82 | 0.0604 | -0.0048 | |||
| MO / Altria Group, Inc. | 0.00 | 0.00 | 0.29 | 12.40 | 0.0602 | -0.0009 | |||
| T / AT&T Inc. | 0.01 | -16.53 | 0.28 | -18.62 | 0.0589 | -0.0237 | |||
| CSCO / Cisco Systems, Inc. | 0.00 | -1.81 | 0.28 | -3.44 | 0.0584 | -0.0105 | |||
| CMCSA / Comcast Corporation | 0.01 | -4.33 | 0.27 | -15.77 | 0.0553 | -0.0197 | |||
| OKLO / Oklo Inc. | 0.00 | 0.26 | 0.0535 | 0.0535 | |||||
| LHX / L3Harris Technologies, Inc. | 0.00 | 0.00 | 0.25 | 21.53 | 0.0527 | 0.0032 | |||
| GSCE / GS Connect S&P GSCI Enhanced Commodity Total Return ETN | 0.00 | 0.00 | 0.25 | 12.27 | 0.0513 | -0.0008 | |||
| PAYX / Paychex, Inc. | 0.00 | 0.00 | 0.24 | -12.86 | 0.0506 | -0.0158 | |||
| APD / Air Products and Chemicals, Inc. | 0.00 | 0.00 | 0.24 | -3.60 | 0.0501 | -0.0091 | |||
| SPLG / SPDR Series Trust - SPDR Portfolio S&P 500 ETF | 0.00 | 1.10 | 0.24 | 9.22 | 0.0491 | -0.0024 | |||
| ALL / The Allstate Corporation | 0.00 | -4.75 | 0.23 | 1.75 | 0.0481 | -0.0060 | |||
| MDLZ / Mondelez International, Inc. | 0.00 | 0.00 | 0.23 | -7.72 | 0.0472 | -0.0110 | |||
| VOO / Vanguard Index Funds - Vanguard S&P 500 ETF | 0.00 | 0.54 | 0.23 | 8.61 | 0.0470 | -0.0026 | |||
| IVW / iShares Trust - iShares S&P 500 Growth ETF | 0.00 | 0.00 | 0.22 | 9.90 | 0.0460 | -0.0020 | |||
| NSC / Norfolk Southern Corporation | 0.00 | 0.22 | 0.0460 | 0.0460 | |||||
| VIG / Vanguard Specialized Funds - Vanguard Dividend Appreciation ETF | 0.00 | -47.56 | 0.22 | -44.72 | 0.0456 | -0.0486 | |||
| BK / The Bank of New York Mellon Corporation | 0.00 | 0.22 | 0.0448 | 0.0448 | |||||
| EW / Edwards Lifesciences Corporation | 0.00 | 0.00 | 0.22 | -0.46 | 0.0446 | -0.0067 | |||
| DIA / SPDR Dow Jones Industrial Average ETF Trust | 0.00 | 0.00 | 0.21 | 4.95 | 0.0441 | -0.0038 | |||
| YUM / Yum! Brands, Inc. | 0.00 | 0.20 | 0.0424 | 0.0424 | |||||
| SPYV / SPDR Series Trust - State Street SPDR Portfolio S&P 500 Value ETF | 0.00 | -7.32 | 0.20 | -1.95 | 0.0418 | -0.0070 | |||
| EMR / Emerson Electric Co. | 0.00 | -43.83 | 0.20 | -44.93 | 0.0418 | -0.0446 | |||
| ESLT / Elbit Systems Ltd. | 0.00 | 0.20 | 0.0417 | 0.0417 | |||||
| LLY / Eli Lilly and Company | 0.00 | -100.00 | 0.00 | 0.0000 | |||||
| CMG / Chipotle Mexican Grill, Inc. | 0.00 | -100.00 | 0.00 | 0.0000 | |||||
| SMCI / Super Micro Computer, Inc. | 0.00 | -100.00 | 0.00 | 0.0000 |