Estatísticas Básicas
| Valor do Portfólio | $ 3,992,741 |
| Posições Atuais | 99 |
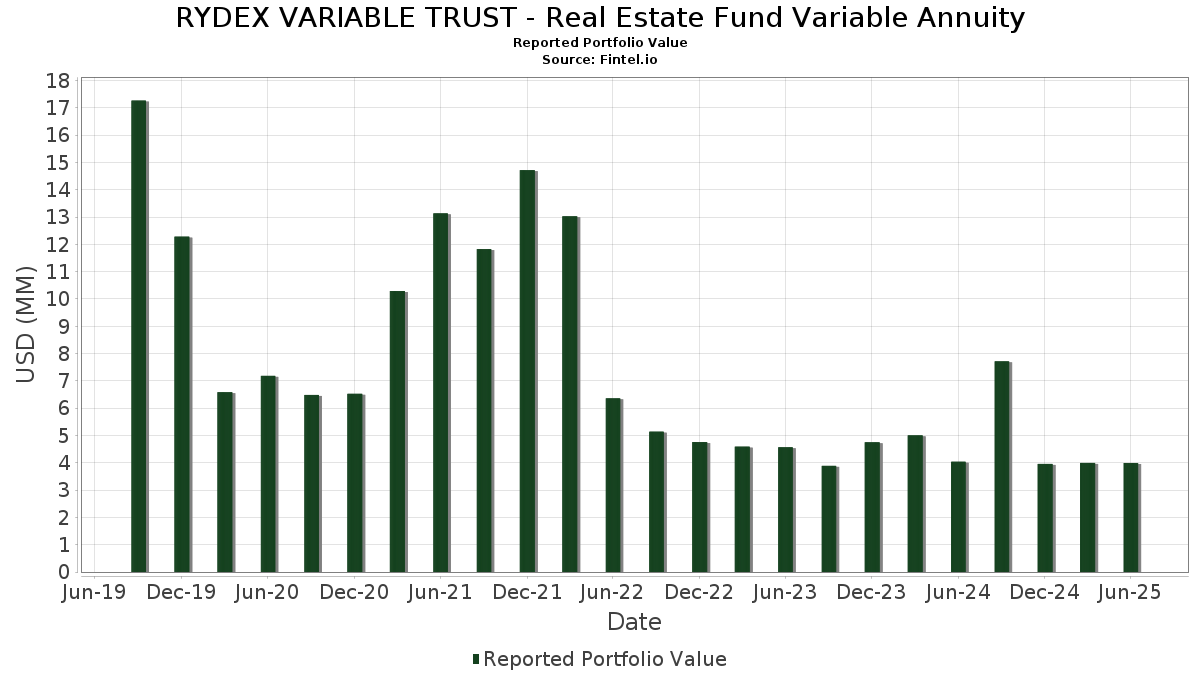
Últimas Participações, Desempenho, AUM (de 13F, 13D)
RYDEX VARIABLE TRUST - Real Estate Fund Variable Annuity divulgou 99 participações totais em seus últimos arquivamentos da SEC. O valor mais recente da carteira é calculado como $ 3,992,741 USD. O Ativo Total Sob Gestão (AUM) é esse valor mais o caixa (que não é divulgado). As principais posições de RYDEX VARIABLE TRUST - Real Estate Fund Variable Annuity são American Tower Corporation (US:AMT) , Welltower Inc. (US:WELL) , Prologis, Inc. (US:PLD) , Digital Realty Trust, Inc. (US:DLR) , and Realty Income Corporation (US:O) .
Maiores Aumentos Este Trimestre
Usamos a mudança na alocação do portfólio porque esta é a métrica mais significativa. As mudanças podem ser devido a operações ou mudanças nos preços das ações.
| Ativo | Ações (MM) |
Valor (MM$) |
% do Portfólio | Δ% do Portfólio |
|---|---|---|---|---|
| 0.16 | 0.16 | 4.2979 | 4.2979 | |
| 0.16 | 0.16 | 4.2979 | 4.2979 | |
| 0.01 | 0.3929 | 0.3929 | ||
| 0.01 | 0.3929 | 0.3929 | ||
| 0.00 | 0.09 | 2.5558 | 0.3293 | |
| 0.00 | 0.07 | 1.8320 | 0.2004 | |
| 0.01 | 0.1696 | 0.1696 | ||
| 0.01 | 0.1696 | 0.1696 | ||
| 0.01 | 0.1637 | 0.1637 | ||
| 0.01 | 0.1637 | 0.1637 |
Maiores Diminuições Este Trimestre
Usamos a mudança na alocação do portfólio porque esta é a métrica mais significativa. As mudanças podem ser devido a operações ou mudanças nos preços das ações.
| Ativo | Ações (MM) |
Valor (MM$) |
% do Portfólio | Δ% do Portfólio |
|---|---|---|---|---|
| 0.00 | 0.08 | 2.2846 | -0.5696 | |
| 0.00 | 0.03 | 0.7497 | -0.2130 | |
| 0.00 | 0.03 | 0.9025 | -0.1089 | |
| 0.00 | 0.02 | 0.4409 | -0.1023 | |
| 0.00 | 0.02 | 0.6106 | -0.0914 | |
| 0.00 | 0.02 | 0.6361 | -0.0882 | |
| 0.00 | 0.03 | 0.7151 | -0.0859 | |
| 0.00 | 0.05 | 1.4054 | -0.0856 | |
| 0.00 | 0.02 | 0.5238 | -0.0846 | |
| 0.00 | 0.05 | 1.3765 | -0.0838 |
Arquivamentos 13F e Fundo
Este formulário foi arquivado em 2025-08-27 para o período de relatório 2025-06-30. Clique no ícone de link para ver o histórico completo da transação.
Atualize para desbloquear dados premium e exportar para Excel ![]() .
.
| Ativo | Tipo | Preço Médio por Ação | Ações (MM) |
ΔAções (%) |
Valor ($MM) |
ΔAções (%) |
Portfólio (%) |
ΔPortfólio (%) |
|
|---|---|---|---|---|---|---|---|---|---|
| First American Government Obligations Fund - Class X / STIV (N/A) | 0.16 | 0.16 | 4.2979 | 4.2979 | |||||
| First American Government Obligations Fund - Class X / STIV (N/A) | 0.16 | 0.16 | 4.2979 | 4.2979 | |||||
| AMT / American Tower Corporation | 0.00 | -6.86 | 0.13 | -6.02 | 3.4459 | 0.0921 | |||
| WELL / Welltower Inc. | 0.00 | -5.86 | 0.12 | -5.38 | 3.3765 | 0.0853 | |||
| PLD / Prologis, Inc. | 0.00 | -2.13 | 0.12 | -8.40 | 3.3008 | -0.0016 | |||
| DLR / Digital Realty Trust, Inc. | 0.00 | -13.13 | 0.09 | 5.68 | 2.5558 | 0.3293 | |||
| O / Realty Income Corporation | 0.00 | -5.08 | 0.09 | -5.38 | 2.4125 | 0.0560 | |||
| SPG / Simon Property Group, Inc. | 0.00 | -3.87 | 0.09 | -7.45 | 2.4008 | 0.0251 | |||
| EQIX / Equinix, Inc. | 0.00 | -24.46 | 0.08 | -26.55 | 2.2846 | -0.5696 | |||
| PSA / Public Storage | 0.00 | -5.02 | 0.08 | -6.74 | 2.2793 | 0.0256 | |||
| CCI / Crown Castle Inc. | 0.00 | -7.12 | 0.08 | -7.78 | 2.2732 | -0.0131 | |||
| CBRE / CBRE Group, Inc. | 0.00 | -11.74 | 0.08 | -4.82 | 2.1616 | 0.0570 | |||
| VICI / VICI Properties Inc. | 0.00 | -4.20 | 0.07 | -4.00 | 1.9715 | 0.0755 | |||
| CSGP / CoStar Group, Inc. | 0.00 | -8.87 | 0.07 | -8.00 | 1.8978 | 0.0083 | |||
| EXR / Extra Space Storage Inc. | 0.00 | -5.75 | 0.07 | -6.94 | 1.8511 | 0.0299 | |||
| IRM / Iron Mountain Incorporated | 0.00 | -13.28 | 0.07 | 3.13 | 1.8320 | 0.2004 | |||
| VTR / Ventas, Inc. | 0.00 | -0.58 | 0.07 | -8.45 | 1.7808 | -0.0149 | |||
| AVB / AvalonBay Communities, Inc. | 0.00 | -4.20 | 0.06 | -9.86 | 1.7756 | -0.0243 | |||
| EQR / Equity Residential | 0.00 | -5.34 | 0.06 | -11.94 | 1.6374 | -0.0517 | |||
| SBAC / SBA Communications Corporation | 0.00 | -14.58 | 0.06 | -9.52 | 1.5802 | -0.0156 | |||
| INVH / Invitation Homes Inc. | 0.00 | -5.86 | 0.05 | -10.34 | 1.4256 | -0.0559 | |||
| WY / Weyerhaeuser Company | 0.00 | -1.09 | 0.05 | -13.56 | 1.4054 | -0.0856 | |||
| MAA / Mid-America Apartment Communities, Inc. | 0.00 | -1.73 | 0.05 | -12.28 | 1.3765 | -0.0838 | |||
| SUI / Sun Communities, Inc. | 0.00 | -4.19 | 0.05 | -5.77 | 1.3459 | 0.0305 | |||
| Z / Zillow Group, Inc. | 0.00 | -8.58 | 0.05 | -6.00 | 1.2856 | 0.0183 | |||
| KIM / Kimco Realty Corporation | 0.00 | -5.39 | 0.05 | -6.25 | 1.2505 | 0.0207 | |||
| REG / Regency Centers Corporation | 0.00 | -3.98 | 0.04 | -8.33 | 1.2235 | 0.0087 | |||
| WPC / W. P. Carey Inc. | 0.00 | -4.40 | 0.04 | -6.38 | 1.2234 | 0.0313 | |||
| UDR / UDR, Inc. | 0.00 | -3.37 | 0.04 | -12.00 | 1.2151 | -0.0658 | |||
| ARE / Alexandria Real Estate Equities, Inc. | 0.00 | 11.21 | 0.04 | -12.24 | 1.1820 | -0.0644 | |||
| LAMR / Lamar Advertising Company | 0.00 | -8.27 | 0.04 | -2.27 | 1.1784 | 0.0695 | |||
| DOC / Healthpeak Properties, Inc. | 0.00 | 3.07 | 0.04 | -12.50 | 1.1724 | -0.0370 | |||
| GLPI / Gaming and Leisure Properties, Inc. | 0.00 | -1.82 | 0.04 | -10.64 | 1.1695 | -0.0264 | |||
| CPT / Camden Property Trust | 0.00 | -4.68 | 0.04 | -12.77 | 1.1312 | -0.0546 | |||
| AMH / American Homes 4 Rent | 0.00 | -7.03 | 0.04 | -10.87 | 1.1227 | -0.0428 | |||
| OHI / Omega Healthcare Investors, Inc. | 0.00 | -2.33 | 0.04 | -4.76 | 1.0947 | 0.0225 | |||
| ELS / Equity LifeStyle Properties, Inc. | 0.00 | -1.53 | 0.04 | -9.30 | 1.0829 | -0.0123 | |||
| HST / Host Hotels & Resorts, Inc. | 0.00 | -7.36 | 0.04 | 0.00 | 1.0781 | 0.0868 | |||
| BXP / Boston Properties, Inc. | 0.00 | -6.72 | 0.04 | -5.00 | 1.0501 | 0.0179 | |||
| CUBE / CubeSmart | 0.00 | -5.53 | 0.04 | -7.50 | 1.0323 | 0.0212 | |||
| NNN / NNN REIT, Inc. | 0.00 | -4.80 | 0.04 | -2.78 | 0.9614 | 0.0430 | |||
| REXR / Rexford Industrial Realty, Inc. | 0.00 | 0.82 | 0.03 | -10.53 | 0.9525 | -0.0049 | |||
| FRT / Federal Realty Investment Trust | 0.00 | -4.44 | 0.03 | -8.11 | 0.9509 | 0.0074 | |||
| BRX / Brixmor Property Group Inc. | 0.00 | -4.59 | 0.03 | -5.56 | 0.9466 | 0.0152 | |||
| ESS / Essex Property Trust, Inc. | 0.00 | -6.20 | 0.03 | -12.82 | 0.9379 | -0.0580 | |||
| ADC / Agree Realty Corporation | 0.00 | -2.09 | 0.03 | -5.56 | 0.9352 | 0.0060 | |||
| JLL / Jones Lang LaSalle Incorporated | 0.00 | -20.37 | 0.03 | -20.00 | 0.9025 | -0.1089 | |||
| STAG / STAG Industrial, Inc. | 0.00 | -5.05 | 0.03 | -3.03 | 0.8762 | 0.0303 | |||
| EPRT / Essential Properties Realty Trust, Inc. | 0.00 | -2.82 | 0.03 | -6.25 | 0.8414 | 0.0260 | |||
| VNO / Vornado Realty Trust | 0.00 | -10.86 | 0.03 | -9.09 | 0.8409 | 0.0007 | |||
| CTRE / CareTrust REIT, Inc. | 0.00 | -4.41 | 0.03 | 3.45 | 0.8353 | 0.0839 | |||
| FR / First Industrial Realty Trust, Inc. | 0.00 | 0.64 | 0.03 | -9.09 | 0.8294 | -0.0213 | |||
| AHR / American Healthcare REIT, Inc. | 0.00 | -13.23 | 0.03 | 7.14 | 0.8240 | 0.1029 | |||
| RHP / Ryman Hospitality Properties, Inc. | 0.00 | -3.49 | 0.03 | 3.57 | 0.8204 | 0.0951 | |||
| HR / Healthcare Realty Trust Incorporated | 0.00 | 1.95 | 0.03 | -6.45 | 0.8173 | 0.0308 | |||
| TRNO / Terreno Realty Corporation | 0.00 | 3.25 | 0.03 | -9.68 | 0.7791 | -0.0042 | |||
| EGP / EastGroup Properties, Inc. | 0.00 | -24.42 | 0.03 | -28.95 | 0.7497 | -0.2130 | |||
| KRG / Kite Realty Group Trust | 0.00 | -6.37 | 0.03 | -3.57 | 0.7471 | 0.0215 | |||
| CUZ / Cousins Properties Incorporated | 0.00 | -7.90 | 0.03 | -6.90 | 0.7466 | 0.0134 | |||
| PECO / Phillips Edison & Company, Inc. | 0.00 | -5.77 | 0.03 | -10.34 | 0.7349 | -0.0131 | |||
| COLD / Americold Realty Trust, Inc. | 0.00 | 6.07 | 0.03 | -16.13 | 0.7151 | -0.0859 | |||
| EPR / EPR Properties | 0.00 | -10.02 | 0.03 | 0.00 | 0.7012 | 0.0533 | |||
| SBRA / Sabra Health Care REIT, Inc. | 0.00 | -7.78 | 0.03 | -3.85 | 0.6996 | 0.0379 | |||
| SLG / SL Green Realty Corp. | 0.00 | -12.12 | 0.03 | -3.85 | 0.6874 | 0.0161 | |||
| MAC / The Macerich Company | 0.00 | -3.28 | 0.02 | -11.11 | 0.6793 | -0.0069 | |||
| IRT / Independence Realty Trust, Inc. | 0.00 | 1.03 | 0.02 | -14.29 | 0.6639 | -0.0622 | |||
| KRC / Kilroy Realty Corporation | 0.00 | -9.21 | 0.02 | -4.00 | 0.6569 | 0.0208 | |||
| NSA / National Storage Affiliates Trust | 0.00 | -0.41 | 0.02 | -17.86 | 0.6361 | -0.0882 | |||
| SKT / Tanger Inc. | 0.00 | -1.45 | 0.02 | -12.00 | 0.6240 | -0.0202 | |||
| COMP / Compass, Inc. | 0.00 | 11.34 | 0.02 | -18.52 | 0.6106 | -0.0914 | |||
| HIW / Highwoods Properties, Inc. | 0.00 | -10.17 | 0.02 | -8.70 | 0.6012 | 0.0138 | |||
| OFC / Corporate Office Properties Trust | 0.00 | -7.48 | 0.02 | -4.55 | 0.5786 | 0.0093 | |||
| BNL / Broadstone Net Lease, Inc. | 0.00 | -1.73 | 0.02 | -4.55 | 0.5747 | 0.0030 | |||
| NMRK / Newmark Group, Inc. | 0.00 | -1.20 | 0.02 | -4.76 | 0.5736 | 0.0382 | |||
| PCH / PotlatchDeltic Corporation | 0.00 | 1.31 | 0.02 | -16.67 | 0.5667 | -0.0389 | |||
| 2IY / Cushman & Wakefield plc | 0.00 | -7.65 | 0.02 | 0.00 | 0.5371 | 0.0427 | |||
| APLE / Apple Hospitality REIT, Inc. | 0.00 | 1.47 | 0.02 | -9.52 | 0.5283 | -0.0020 | |||
| LINE / Lineage, Inc. | 0.00 | 6.80 | 0.02 | -20.83 | 0.5238 | -0.0846 | |||
| OUT / OUTFRONT Media Inc. | 0.00 | -5.81 | 0.02 | -5.00 | 0.5214 | 0.0174 | |||
| DEI / Douglas Emmett, Inc. | 0.00 | -3.80 | 0.02 | -9.52 | 0.5212 | -0.0095 | |||
| UE / Urban Edge Properties | 0.00 | -4.82 | 0.02 | -10.00 | 0.5135 | 0.0077 | |||
| AKR / Acadia Realty Trust | 0.00 | 4.59 | 0.02 | -10.00 | 0.5089 | 0.0035 | |||
| LXP / LXP Industrial Trust | 0.00 | -2.40 | 0.02 | -5.26 | 0.5050 | 0.0061 | |||
| PK / Park Hotels & Resorts Inc. | 0.00 | -2.34 | 0.02 | -5.88 | 0.4564 | 0.0072 | |||
| MPW / Medical Properties Trust, Inc. | 0.00 | 4.56 | 0.02 | -23.81 | 0.4409 | -0.1023 | |||
| SHO / Sunstone Hotel Investors, Inc. | 0.00 | -0.82 | 0.02 | -11.76 | 0.4326 | -0.0028 | |||
| DRH / DiamondRock Hospitality Company | 0.00 | -3.73 | 0.02 | 0.00 | 0.4159 | 0.0150 | |||
| RDFN / Redfin Corporation | 0.00 | -7.50 | 0.01 | 16.67 | 0.3964 | 0.0716 | |||
| DE000C4SA6R6 / EURO STOXX 50 Index | 0.01 | 0.3929 | 0.3929 | ||||||
| DE000C4SA6R6 / EURO STOXX 50 Index | 0.01 | 0.3929 | 0.3929 | ||||||
| PEB / Pebblebrook Hotel Trust | 0.00 | 0.51 | 0.01 | 0.00 | 0.3735 | 0.0266 | |||
| UNIT / Uniti Group Inc. | 0.00 | -10.77 | 0.01 | -21.43 | 0.3123 | -0.0637 | |||
| EXPI / eXp World Holdings, Inc. | 0.00 | -2.22 | 0.01 | -9.09 | 0.2855 | -0.0034 | |||
| SITC / SITE Centers Corp. | 0.00 | 1.01 | 0.01 | -10.00 | 0.2469 | -0.0086 | |||
| OPEN / Opendoor Technologies Inc. | 0.01 | 203.91 | 0.01 | 50.00 | 0.1825 | 0.0767 | |||
| Barclays Capital, Inc. / RA (N/A) | 0.01 | 0.1696 | 0.1696 | ||||||
| Barclays Capital, Inc. / RA (N/A) | 0.01 | 0.1696 | 0.1696 | ||||||
| BofA Securities, Inc. / RA (N/A) | 0.01 | 0.1637 | 0.1637 | ||||||
| BofA Securities, Inc. / RA (N/A) | 0.01 | 0.1637 | 0.1637 | ||||||
| EQC / Equity Commonwealth | 0.00 | -100.00 | 0.00 | -100.00 | -0.0737 |