Estatísticas Básicas
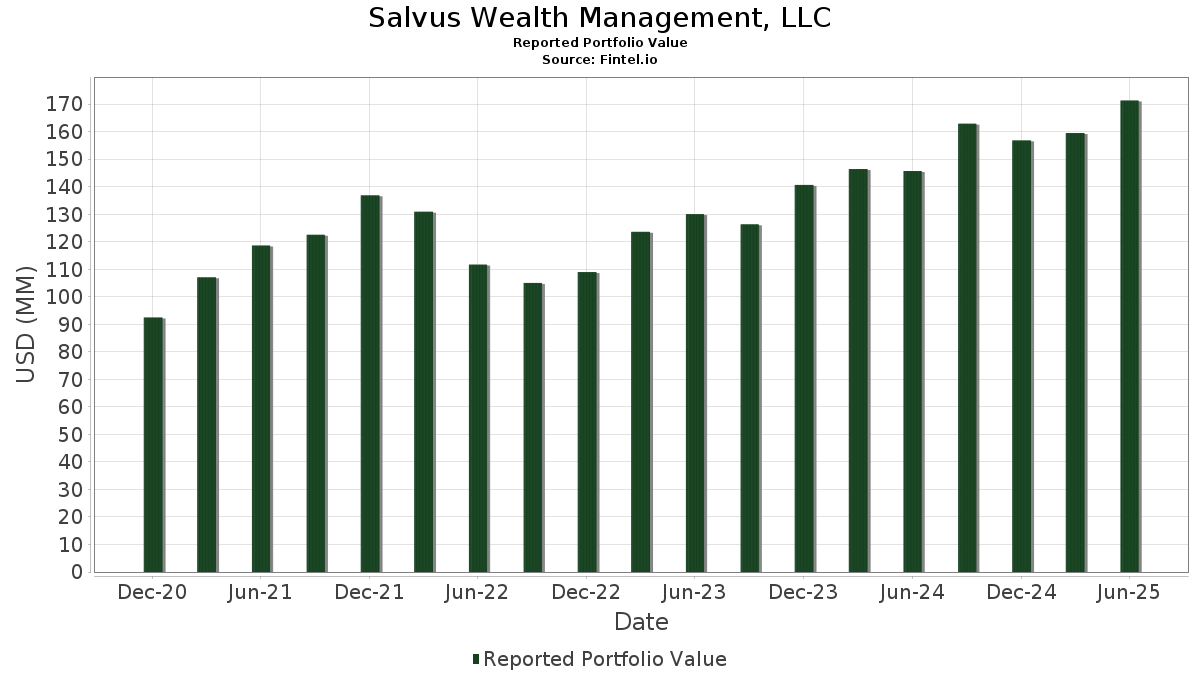
| Valor do Portfólio | $ 178,960,041 |
| Posições Atuais | 133 |
Últimas Participações, Desempenho, AUM (de 13F, 13D)
Salvus Wealth Management, LLC divulgou 133 participações totais em seus últimos arquivamentos da SEC. O valor mais recente da carteira é calculado como $ 178,960,041 USD. O Ativo Total Sob Gestão (AUM) é esse valor mais o caixa (que não é divulgado). As principais posições de Salvus Wealth Management, LLC são Berkshire Hathaway Inc. (US:BRK.B) , The Charles Schwab Corporation (US:SCHW) , The Progressive Corporation (US:PGR) , Apple Inc. (US:AAPL) , and THOR Industries, Inc. (US:THO) . As novas posições de Salvus Wealth Management, LLC incluem Broadcom Inc. (US:AVGO) , ONEOK, Inc. (US:OKE) , Synopsys, Inc. (US:SNPS) , Boston Scientific Corporation (US:BSX) , and Intuit Inc. (US:INTU) .
Maiores Aumentos Este Trimestre
Usamos a mudança na alocação do portfólio porque esta é a métrica mais significativa. As mudanças podem ser devido a operações ou mudanças nos preços das ações.
| Ativo | Ações (MM) |
Valor (MM$) |
% do Portfólio | Δ% do Portfólio |
|---|---|---|---|---|
| 0.02 | 4.36 | 2.4381 | 0.6350 | |
| 0.02 | 5.23 | 2.9200 | 0.5910 | |
| 0.02 | 4.30 | 2.4046 | 0.5577 | |
| 0.00 | 1.00 | 0.5564 | 0.5564 | |
| 0.01 | 0.68 | 0.3782 | 0.3782 | |
| 0.02 | 5.55 | 3.0988 | 0.3234 | |
| 0.00 | 0.57 | 0.3200 | 0.3200 | |
| 0.05 | 5.52 | 3.0848 | 0.3017 | |
| 0.02 | 1.50 | 0.8409 | 0.2969 | |
| 0.01 | 0.49 | 0.2748 | 0.2748 |
Maiores Diminuições Este Trimestre
Usamos a mudança na alocação do portfólio porque esta é a métrica mais significativa. As mudanças podem ser devido a operações ou mudanças nos preços das ações.
| Ativo | Ações (MM) |
Valor (MM$) |
% do Portfólio | Δ% do Portfólio |
|---|---|---|---|---|
| 0.00 | 0.23 | 0.1304 | -0.8751 | |
| 0.01 | 3.99 | 2.2306 | -0.8177 | |
| 0.02 | 5.98 | 3.3394 | -0.4760 | |
| 0.01 | 2.27 | 1.2704 | -0.3898 | |
| 0.00 | 5.04 | 2.8149 | -0.3755 | |
| 0.00 | 0.00 | -0.2632 | ||
| 0.03 | 1.03 | 0.5759 | -0.2178 | |
| 0.01 | 0.59 | 0.3316 | -0.2126 | |
| 0.05 | 1.04 | 0.5804 | -0.1949 | |
| 0.01 | 1.45 | 0.8129 | -0.1833 |
Arquivamentos 13F e Fundo
Este formulário foi arquivado em 2025-10-14 para o período de relatório 2025-09-30. Clique no ícone de link para ver o histórico completo da transação.
Atualize para desbloquear dados premium e exportar para Excel ![]() .
.
| Ativo | Tipo | Preço Médio por Ação | Ações (MM) |
ΔAções (%) |
Valor ($MM) |
ΔAções (%) |
Portfólio (%) |
ΔPortfólio (%) |
|
|---|---|---|---|---|---|---|---|---|---|
| BRK.B / Berkshire Hathaway Inc. | 0.02 | -0.84 | 8.36 | 2.63 | 4.6732 | -0.0842 | |||
| SCHW / The Charles Schwab Corporation | 0.07 | -1.31 | 6.91 | 3.27 | 3.8596 | -0.0450 | |||
| PGR / The Progressive Corporation | 0.02 | -1.19 | 5.98 | -8.55 | 3.3394 | -0.4760 | |||
| AAPL / Apple Inc. | 0.02 | -6.01 | 5.55 | 16.64 | 3.0988 | 0.3234 | |||
| THO / THOR Industries, Inc. | 0.05 | -0.82 | 5.52 | 15.80 | 3.0848 | 0.3017 | |||
| GOOG / Alphabet Inc. | 0.02 | -4.60 | 5.23 | 30.99 | 2.9200 | 0.5910 | |||
| ASTS / AST SpaceMobile, Inc. | 0.10 | -2.88 | 5.09 | 2.00 | 2.8441 | -0.0688 | |||
| BKNG / Booking Holdings Inc. | 0.00 | -1.17 | 5.04 | -7.83 | 2.8149 | -0.3755 | |||
| SGI / Somnigroup International Inc. | 0.06 | -20.34 | 4.99 | -1.28 | 2.7911 | -0.1626 | |||
| ADI / Analog Devices, Inc. | 0.02 | -0.52 | 4.77 | 2.69 | 2.6666 | -0.0464 | |||
| MSFT / Microsoft Corporation | 0.01 | 1.25 | 4.77 | 5.44 | 2.6628 | 0.0243 | |||
| NVDA / NVIDIA Corporation | 0.02 | 19.62 | 4.36 | 41.29 | 2.4381 | 0.6350 | |||
| IBP / Installed Building Products, Inc. | 0.02 | -0.56 | 4.30 | 36.04 | 2.4046 | 0.5577 | |||
| FI / Fiserv, Inc. | 0.03 | 29.41 | 4.05 | -3.23 | 2.2639 | -0.1800 | |||
| AXP / American Express Company | 0.01 | -26.59 | 3.99 | -23.56 | 2.2306 | -0.8177 | |||
| FND / Floor & Decor Holdings, Inc. | 0.05 | -0.44 | 3.97 | -3.41 | 2.2185 | -0.1809 | |||
| ABG / Asbury Automotive Group, Inc. | 0.01 | 0.25 | 3.32 | 2.72 | 1.8567 | -0.0314 | |||
| ANET / Arista Networks, Inc. | 0.02 | -19.31 | 2.90 | 14.93 | 1.6179 | 0.1471 | |||
| EL / The Estée Lauder Companies Inc. | 0.03 | -0.92 | 2.75 | 8.07 | 1.5349 | 0.0510 | |||
| BN / Brookfield Corporation | 0.04 | -3.28 | 2.75 | 7.23 | 1.5341 | 0.0396 | |||
| NVR / NVR, Inc. | 0.00 | -0.90 | 2.65 | 7.81 | 1.4816 | 0.0458 | |||
| 0XHL / Aon plc | 0.01 | -2.82 | 2.35 | -2.90 | 1.3119 | -0.0991 | |||
| AWI / Armstrong World Industries, Inc. | 0.01 | -33.75 | 2.27 | -20.05 | 1.2704 | -0.3898 | |||
| ORLY / O'Reilly Automotive, Inc. | 0.02 | -2.69 | 2.21 | 16.39 | 1.2345 | 0.1265 | |||
| MKL / Markel Group Inc. | 0.00 | -3.50 | 2.05 | -7.69 | 1.1481 | -0.1508 | |||
| MC / Moelis & Company | 0.03 | 0.36 | 1.96 | 14.85 | 1.0979 | 0.0993 | |||
| AMZN / Amazon.com, Inc. | 0.01 | -8.82 | 1.91 | -8.75 | 1.0662 | -0.1545 | |||
| BLK / BlackRock, Inc. | 0.00 | -0.43 | 1.90 | 10.65 | 1.0625 | 0.0592 | |||
| NSC / Norfolk Southern Corporation | 0.01 | 3.48 | 1.82 | 21.47 | 1.0184 | 0.1423 | |||
| AMAT / Applied Materials, Inc. | 0.01 | -3.85 | 1.75 | 7.52 | 0.9755 | 0.0278 | |||
| GLW / Corning Incorporated | 0.02 | 3.53 | 1.50 | 61.55 | 0.8409 | 0.2969 | |||
| ORCL / Oracle Corporation | 0.01 | -14.30 | 1.48 | 10.21 | 0.8268 | 0.0433 | |||
| JNJ / Johnson & Johnson | 0.01 | 5.53 | 1.46 | 28.12 | 0.8148 | 0.1503 | |||
| AMT / American Tower Corporation | 0.01 | -2.03 | 1.45 | -14.77 | 0.8129 | -0.1833 | |||
| LLY / Eli Lilly and Company | 0.00 | -2.91 | 1.40 | -4.96 | 0.7825 | -0.0777 | |||
| GBIL / Goldman Sachs ETF Trust - Goldman Sachs Access Treasury 0-1 Year ETF | 0.01 | -10.85 | 1.33 | -10.79 | 0.7438 | -0.1272 | |||
| CVX / Chevron Corporation | 0.01 | 4.89 | 1.28 | 13.74 | 0.7127 | 0.0582 | |||
| APD / Air Products and Chemicals, Inc. | 0.00 | -1.19 | 1.27 | -4.44 | 0.7103 | -0.0664 | |||
| FNV / Franco-Nevada Corporation | 0.01 | -0.54 | 1.23 | 35.20 | 0.6894 | 0.1569 | |||
| PM / Philip Morris International Inc. | 0.01 | -0.37 | 1.19 | -11.31 | 0.6666 | -0.1183 | |||
| CSCO / Cisco Systems, Inc. | 0.02 | -2.34 | 1.19 | -3.74 | 0.6625 | -0.0562 | |||
| L / Loews Corporation | 0.01 | 0.30 | 1.18 | 9.88 | 0.6590 | 0.0323 | |||
| NU / Nu Holdings Ltd. | 0.07 | 0.00 | 1.11 | 16.68 | 0.6218 | 0.0651 | |||
| CINF / Cincinnati Financial Corporation | 0.01 | 7.53 | 1.08 | 14.19 | 0.6028 | 0.0512 | |||
| PHM7 / Altria Group, Inc. | 0.02 | 5.92 | 1.07 | 19.35 | 0.5966 | 0.0743 | |||
| DIS / The Walt Disney Company | 0.01 | -4.01 | 1.06 | -11.38 | 0.5920 | -0.1059 | |||
| AEM / Agnico Eagle Mines Limited | 0.01 | 0.08 | 1.05 | 41.78 | 0.5881 | 0.1549 | |||
| WSC / WillScot Holdings Corporation | 0.05 | 1.51 | 1.04 | -21.84 | 0.5804 | -0.1949 | |||
| CCOI / Cogent Communications Holdings, Inc. | 0.03 | -4.71 | 1.03 | -24.21 | 0.5759 | -0.2178 | |||
| D / Dominion Energy, Inc. | 0.02 | -0.40 | 1.02 | 7.70 | 0.5711 | 0.0176 | |||
| SBUX / Starbucks Corporation | 0.01 | 2.68 | 1.01 | -5.18 | 0.5624 | -0.0573 | |||
| AVGO / Broadcom Inc. | 0.00 | 1.00 | 0.5564 | 0.5564 | |||||
| PAYX / Paychex, Inc. | 0.01 | 5.70 | 0.97 | -7.87 | 0.5429 | -0.0729 | |||
| UL / Unilever PLC - Depositary Receipt (Common Stock) | 0.02 | 0.24 | 0.97 | -2.80 | 0.5426 | -0.0409 | |||
| TXN / Texas Instruments Incorporated | 0.01 | -0.42 | 0.97 | -11.92 | 0.5415 | -0.1004 | |||
| TEL / TE Connectivity plc | 0.00 | -0.32 | 0.97 | 29.70 | 0.5396 | 0.1051 | |||
| LOW / Lowe's Companies, Inc. | 0.00 | -0.44 | 0.96 | 12.79 | 0.5371 | 0.0395 | |||
| V / Visa Inc. | 0.00 | -16.60 | 0.94 | -19.83 | 0.5244 | -0.1588 | |||
| SHOP / Shopify Inc. | 0.01 | -10.97 | 0.89 | 14.71 | 0.4969 | 0.0443 | |||
| MA / Mastercard Incorporated | 0.00 | -3.79 | 0.87 | -2.70 | 0.4844 | -0.0352 | |||
| EBGEF / Enbridge Inc. - Preferred Stock | 0.02 | -5.26 | 0.87 | 5.49 | 0.4836 | 0.0046 | |||
| FAST / Fastenal Company | 0.02 | -0.40 | 0.86 | 16.37 | 0.4808 | 0.0489 | |||
| NOC / Northrop Grumman Corporation | 0.00 | -0.45 | 0.81 | 21.39 | 0.4505 | 0.0625 | |||
| STX / Seagate Technology Holdings plc | 0.00 | -3.04 | 0.78 | 58.42 | 0.4369 | 0.1491 | |||
| NOW / ServiceNow, Inc. | 0.00 | 7.22 | 0.78 | -4.07 | 0.4350 | -0.0385 | |||
| MDT / Medtronic plc | 0.01 | 0.45 | 0.77 | 9.84 | 0.4304 | 0.0207 | |||
| META / Meta Platforms, Inc. | 0.00 | 0.30 | 0.73 | -0.14 | 0.4075 | -0.0191 | |||
| OKE / ONEOK, Inc. | 0.01 | 0.68 | 0.3782 | 0.3782 | |||||
| FIS / Fidelity National Information Services, Inc. | 0.01 | -0.33 | 0.66 | -19.24 | 0.3706 | -0.1090 | |||
| TRV / The Travelers Companies, Inc. | 0.00 | 0.22 | 0.65 | 4.68 | 0.3629 | 0.0004 | |||
| ZTS / Zoetis Inc. | 0.00 | 6.54 | 0.62 | 0.00 | 0.3489 | -0.0157 | |||
| CDW / CDW Corporation | 0.00 | -4.81 | 0.60 | -15.10 | 0.3330 | -0.0768 | |||
| KMX / CarMax, Inc. | 0.01 | -4.64 | 0.59 | -36.37 | 0.3316 | -0.2126 | |||
| ABT / Abbott Laboratories | 0.00 | -14.98 | 0.58 | -16.26 | 0.3253 | -0.0806 | |||
| CTVA / Corteva, Inc. | 0.01 | -0.81 | 0.57 | -10.03 | 0.3210 | -0.0516 | |||
| APP / AppLovin Corporation | 0.00 | 0.57 | 0.3200 | 0.3200 | |||||
| BAM / Brookfield Asset Management Ltd. | 0.01 | -4.87 | 0.56 | -2.09 | 0.3140 | -0.0208 | |||
| HSY / The Hershey Company | 0.00 | 0.69 | 0.55 | 13.66 | 0.3069 | 0.0244 | |||
| EPD / Enterprise Products Partners L.P. - Limited Partnership | 0.02 | 0.02 | 0.53 | 0.95 | 0.2981 | -0.0107 | |||
| GD / General Dynamics Corporation | 0.00 | 14.76 | 0.50 | 34.23 | 0.2786 | 0.0617 | |||
| INTC / Intel Corporation | 0.01 | 29.51 | 0.50 | 94.12 | 0.2768 | 0.1277 | |||
| MSCI / MSCI Inc. | 0.00 | 5.86 | 0.49 | 4.03 | 0.2749 | -0.0009 | |||
| SSNC / SS&C Technologies Holdings, Inc. | 0.01 | 0.49 | 0.2748 | 0.2748 | |||||
| EOG / EOG Resources, Inc. | 0.00 | 0.20 | 0.46 | -6.16 | 0.2557 | -0.0287 | |||
| CCI / Crown Castle Inc. | 0.00 | -0.50 | 0.46 | -6.56 | 0.2553 | -0.0301 | |||
| CB / Chubb Limited | 0.00 | -0.50 | 0.45 | -3.01 | 0.2523 | -0.0196 | |||
| NFLX / Netflix, Inc. | 0.00 | -27.11 | 0.44 | -34.68 | 0.2432 | -0.1461 | |||
| CMCSA / Comcast Corporation | 0.01 | 2.00 | 0.43 | -10.37 | 0.2419 | -0.0395 | |||
| GEHC / GE HealthCare Technologies Inc. | 0.01 | 0.89 | 0.43 | 2.16 | 0.2380 | -0.0051 | |||
| IDXX / IDEXX Laboratories, Inc. | 0.00 | 7.50 | 0.42 | 28.35 | 0.2353 | 0.0433 | |||
| EMR / Emerson Electric Co. | 0.00 | 0.63 | 0.42 | -0.95 | 0.2342 | -0.0129 | |||
| HON / Honeywell International Inc. | 0.00 | 0.82 | 0.41 | -8.83 | 0.2310 | -0.0338 | |||
| RH / RH | 0.00 | -4.86 | 0.40 | 2.30 | 0.2244 | -0.0049 | |||
| MTB / M&T Bank Corporation | 0.00 | 18.84 | 0.40 | 21.10 | 0.2215 | 0.0304 | |||
| KO / The Coca-Cola Company | 0.01 | 17.83 | 0.39 | 10.29 | 0.2161 | 0.0117 | |||
| T / AT&T Inc. | 0.01 | 19.11 | 0.38 | 16.06 | 0.2144 | 0.0217 | |||
| ADBE / Adobe Inc. | 0.00 | -28.19 | 0.38 | -34.59 | 0.2139 | -0.1274 | |||
| VZ / Verizon Communications Inc. | 0.01 | 19.82 | 0.38 | 21.86 | 0.2119 | 0.0300 | |||
| ACN / Accenture plc | 0.00 | 4.82 | 0.37 | -13.58 | 0.2067 | -0.0430 | |||
| SYY / Sysco Corporation | 0.00 | 1.15 | 0.36 | 10.06 | 0.2020 | 0.0101 | |||
| DEO / Diageo plc - Depositary Receipt (Common Stock) | 0.00 | -0.54 | 0.35 | -5.85 | 0.1979 | -0.0217 | |||
| DUK / Duke Energy Corporation | 0.00 | 21.03 | 0.35 | 26.91 | 0.1954 | 0.0346 | |||
| MRK / Merck & Co., Inc. | 0.00 | 22.81 | 0.34 | 30.62 | 0.1884 | 0.0372 | |||
| GOOGL / Alphabet Inc. | 0.00 | -3.27 | 0.33 | 33.60 | 0.1849 | 0.0401 | |||
| SNPS / Synopsys, Inc. | 0.00 | 0.32 | 0.1803 | 0.1803 | |||||
| ET / Energy Transfer LP - Limited Partnership | 0.02 | 0.04 | 0.32 | -5.04 | 0.1788 | -0.0185 | |||
| HAS / Hasbro, Inc. | 0.00 | 23.96 | 0.31 | 27.24 | 0.1752 | 0.0315 | |||
| BSX / Boston Scientific Corporation | 0.00 | 0.30 | 0.1666 | 0.1666 | |||||
| APAM / Artisan Partners Asset Management Inc. | 0.01 | 23.64 | 0.30 | 21.14 | 0.1665 | 0.0228 | |||
| QQQ / Invesco QQQ Trust, Series 1 | 0.00 | 0.00 | 0.29 | 8.89 | 0.1646 | 0.0066 | |||
| ABNB / Airbnb, Inc. | 0.00 | -30.23 | 0.29 | -36.03 | 0.1641 | -0.1037 | |||
| LHX / L3Harris Technologies, Inc. | 0.00 | 0.00 | 0.28 | 21.55 | 0.1580 | 0.0224 | |||
| TSM / Taiwan Semiconductor Manufacturing Company Limited - Depositary Receipt (Common Stock) | 0.00 | -3.73 | 0.28 | 18.64 | 0.1570 | 0.0188 | |||
| CSGP / CoStar Group, Inc. | 0.00 | 10.38 | 0.28 | 16.18 | 0.1565 | 0.0153 | |||
| PAYC / Paycom Software, Inc. | 0.00 | 7.06 | 0.27 | -3.86 | 0.1535 | -0.0130 | |||
| KMB / Kimberly-Clark Corporation | 0.00 | 27.04 | 0.27 | 22.73 | 0.1511 | 0.0223 | |||
| SPY / SPDR S&P 500 ETF | 0.00 | 2.32 | 0.26 | 10.46 | 0.1476 | 0.0078 | |||
| WDAY / Workday, Inc. | 0.00 | -34.68 | 0.26 | -34.51 | 0.1454 | -0.0865 | |||
| INTU / Intuit Inc. | 0.00 | 0.26 | 0.1442 | 0.1442 | |||||
| SHEN / Shenandoah Telecommunications Company | 0.02 | -4.78 | 0.25 | -6.37 | 0.1397 | -0.0163 | |||
| UBER / Uber Technologies, Inc. | 0.00 | 0.25 | 0.1380 | 0.1380 | |||||
| IEX / IDEX Corporation | 0.00 | 0.24 | 0.1351 | 0.1351 | |||||
| CME / CME Group Inc. | 0.00 | 1.14 | 0.24 | -0.83 | 0.1341 | -0.0072 | |||
| BIL / SPDR Series Trust - State Street SPDR Bloomberg 1-3 Month T-Bill ETF | 0.00 | -86.46 | 0.23 | -86.47 | 0.1304 | -0.8751 | |||
| HDV / iShares Trust - iShares Core High Dividend ETF | 0.00 | 0.00 | 0.22 | 4.29 | 0.1228 | 0.0000 | |||
| IWF / iShares Trust - iShares Russell 1000 Growth ETF | 0.00 | 0.22 | 0.1212 | 0.1212 | |||||
| UGI / UGI Corporation | 0.01 | 0.66 | 0.20 | -8.22 | 0.1126 | -0.0154 | |||
| BORR / Borr Drilling Limited | 0.03 | 81.23 | 0.07 | 170.37 | 0.0409 | 0.0249 | |||
| VIR / Vir Biotechnology, Inc. | 0.01 | 0.00 | 0.07 | 13.79 | 0.0373 | 0.0029 | |||
| FLNT / Fluent, Inc. | 0.02 | 0.00 | 0.04 | 10.53 | 0.0236 | 0.0014 | |||
| RMCF / Rocky Mountain Chocolate Factory, Inc. | 0.02 | 53.08 | 0.04 | 76.19 | 0.0209 | 0.0083 | |||
| LOOP / Loop Industries, Inc. | 0.02 | 0.03 | 0.0159 | 0.0159 | |||||
| RCT / RedCloud Holdings plc | 0.01 | 5.90 | 0.02 | -36.11 | 0.0132 | -0.0084 | |||
| HSHP / Himalaya Shipping Ltd. | 0.00 | -100.00 | 0.00 | 0.0000 | |||||
| SB / Safe Bulkers, Inc. | 0.00 | -100.00 | 0.00 | 0.0000 | |||||
| ECPG / Encore Capital Group, Inc. | 0.00 | -100.00 | 0.00 | 0.0000 | |||||
| TMO / Thermo Fisher Scientific Inc. | 0.00 | -100.00 | 0.00 | -100.00 | -0.2632 |