Estatísticas Básicas
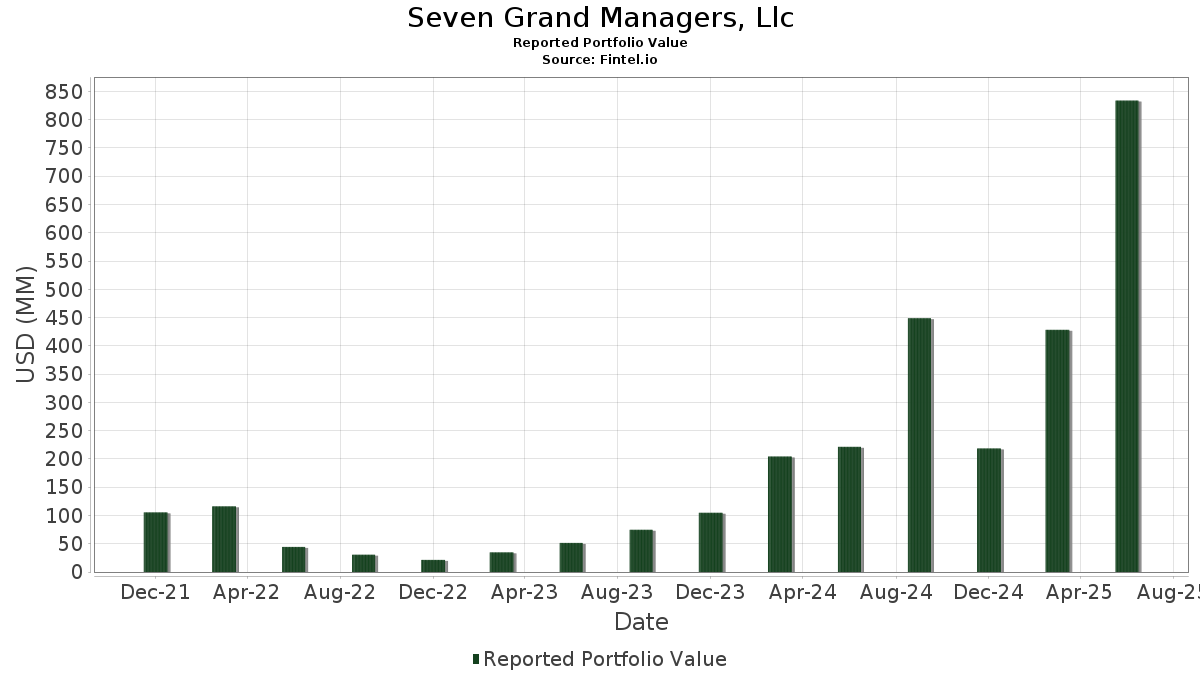
| Valor do Portfólio | $ 1,231,264,056 |
| Posições Atuais | 99 |
Últimas Participações, Desempenho, AUM (de 13F, 13D)
Seven Grand Managers, Llc divulgou 99 participações totais em seus últimos arquivamentos da SEC. O valor mais recente da carteira é calculado como $ 1,231,264,056 USD. O Ativo Total Sob Gestão (AUM) é esse valor mais o caixa (que não é divulgado). As principais posições de Seven Grand Managers, Llc são Galaxy Digital Inc. (US:GLXY) , T-Mobile US, Inc. (US:TMUS) , McKesson Corporation (US:MCK) , Kratos Defense & Security Solutions, Inc. (US:KTOS) , and Nasdaq, Inc. (US:NDAQ) . As novas posições de Seven Grand Managers, Llc incluem T-Mobile US, Inc. (US:TMUS) , McKesson Corporation (US:MCK) , Medtronic plc (US:MDT) , AeroVironment, Inc. (US:AVAV) , and VeriSign, Inc. (US:VRSN) .
Maiores Aumentos Este Trimestre
Usamos a mudança na alocação do portfólio porque esta é a métrica mais significativa. As mudanças podem ser devido a operações ou mudanças nos preços das ações.
| Ativo | Ações (MM) |
Valor (MM$) |
% do Portfólio | Δ% do Portfólio |
|---|---|---|---|---|
| 0.20 | 47.88 | 3.8884 | 3.8884 | |
| 0.06 | 46.35 | 3.7646 | 3.7646 | |
| 0.40 | 38.10 | 3.0941 | 3.0941 | |
| 0.12 | 37.79 | 3.0689 | 3.0689 | |
| 0.12 | 34.95 | 2.8382 | 2.8382 | |
| 2.00 | 28.24 | 2.2936 | 2.2936 | |
| 2.00 | 67.62 | 5.4919 | 2.2086 | |
| 0.20 | 22.45 | 1.8237 | 1.8237 | |
| 0.75 | 19.82 | 1.6093 | 1.6093 | |
| 0.12 | 31.83 | 2.5850 | 1.6007 |
Maiores Diminuições Este Trimestre
Usamos a mudança na alocação do portfólio porque esta é a métrica mais significativa. As mudanças podem ser devido a operações ou mudanças nos preços das ações.
| Ativo | Ações (MM) |
Valor (MM$) |
% do Portfólio | Δ% do Portfólio |
|---|---|---|---|---|
| 0.38 | 35.17 | 2.8565 | -7.1166 | |
| 0.50 | 11.05 | 0.8975 | -6.2076 | |
| 0.07 | 38.85 | 3.1550 | -4.1706 | |
| 0.15 | 15.12 | 1.2284 | -2.2424 | |
| 0.50 | 9.21 | 0.7484 | -2.1367 | |
| 0.30 | 11.38 | 0.9239 | -2.0172 | |
| 0.38 | 10.23 | 0.8312 | -2.0159 | |
| 0.00 | 0.00 | -1.8667 | ||
| 0.50 | 44.23 | 3.5918 | -1.7706 | |
| 0.07 | 12.26 | 0.9953 | -1.7263 |
Arquivamentos 13F e Fundo
Este formulário foi arquivado em 2025-11-12 para o período de relatório 2025-09-30. Clique no ícone de link para ver o histórico completo da transação.
Atualize para desbloquear dados premium e exportar para Excel ![]() .
.
| Ativo | Tipo | Preço Médio por Ação | Ações (MM) |
ΔAções (%) |
Valor ($MM) |
ΔAções (%) |
Portfólio (%) |
ΔPortfólio (%) |
|
|---|---|---|---|---|---|---|---|---|---|
| GLXY / Galaxy Digital Inc. | 2.00 | 60.00 | 67.62 | 147.01 | 5.4919 | 2.2086 | |||
| TMUS / T-Mobile US, Inc. | 0.20 | 47.88 | 3.8884 | 3.8884 | |||||
| MCK / McKesson Corporation | 0.06 | 46.35 | 3.7646 | 3.7646 | |||||
| KTOS / Kratos Defense & Security Solutions, Inc. | 0.50 | 0.00 | 45.69 | 96.71 | 3.7104 | 0.9249 | |||
| NDAQ / Nasdaq, Inc. | 0.50 | 0.00 | 44.23 | -1.08 | 3.5918 | -1.7706 | |||
| MSFT / Microsoft Corporation | 0.07 | -38.92 | 38.85 | -36.40 | 3.1550 | -4.1706 | |||
| MDT / Medtronic plc | 0.40 | 38.10 | 3.0941 | 3.0941 | |||||
| AVAV / AeroVironment, Inc. | 0.12 | 37.79 | 3.0689 | 3.0689 | |||||
| BRO / Brown & Brown, Inc. | 0.38 | -50.00 | 35.17 | -57.70 | 2.8565 | -7.1166 | |||
| VRSN / VeriSign, Inc. | 0.12 | 34.95 | 2.8382 | 2.8382 | |||||
| SNDK / Sandisk Corporation | 0.30 | -40.00 | 33.66 | 48.45 | 2.7338 | 0.0142 | |||
| AAPL / Apple Inc. | 0.12 | 212.50 | 31.83 | 287.86 | 2.5850 | 1.6007 | |||
| MBLY / Mobileye Global Inc. | 2.00 | 28.24 | 2.2936 | 2.2936 | |||||
| TTWO / Take-Two Interactive Software, Inc. | 0.10 | 0.00 | 25.84 | 6.39 | 2.0983 | -0.8143 | |||
| ESLT / Elbit Systems Ltd. | 0.05 | 100.00 | 25.49 | 126.84 | 2.0702 | 0.7224 | |||
| KRMN / Karman Holdings Inc. | 0.35 | 0.00 | 25.27 | 43.34 | 2.0524 | -0.0621 | |||
| NBIS / Nebius Group N.V. | 0.20 | 22.45 | 1.8237 | 1.8237 | |||||
| SOFI / SoFi Technologies, Inc. | 0.75 | 19.82 | 1.6093 | 1.6093 | |||||
| STWD / Starwood Property Trust, Inc. | 1.00 | 19.37 | 1.5732 | 1.5732 | |||||
| CRCL / Circle Internet Group, Inc. | 0.12 | 16.57 | 1.3460 | 1.3460 | |||||
| CRBG / Corebridge Financial, Inc. | 0.50 | 16.02 | 1.3015 | 1.3015 | |||||
| NSC / Norfolk Southern Corporation | 0.05 | 15.32 | 1.2443 | 1.2443 | |||||
| TTAN / ServiceTitan, Inc. | 0.15 | -44.44 | 15.12 | -47.74 | 1.2284 | -2.2424 | |||
| ULS / UL Solutions Inc. | 0.20 | -20.00 | 14.17 | -22.20 | 1.1510 | -1.0336 | |||
| SPXC / SPX Technologies, Inc. | 0.07 | 14.01 | 1.1377 | 1.1377 | |||||
| CTRE / CareTrust REIT, Inc. | 0.40 | 13.87 | 1.1266 | 1.1266 | |||||
| MP / MP Materials Corp. | 0.20 | 13.41 | 1.0894 | 1.0894 | |||||
| FIG / Figma, Inc. | 0.25 | 12.97 | 1.0532 | 1.0532 | |||||
| PLTR / Palantir Technologies Inc. | 0.07 | 12.95 | 1.0519 | 1.0519 | |||||
| CTRI / Centuri Holdings, Inc. | 0.60 | 12.70 | 1.0316 | 1.0316 | |||||
| LGN / Legence Corp. | 0.40 | 12.32 | 1.0009 | 1.0009 | |||||
| AMAT / Applied Materials, Inc. | 0.06 | 12.28 | 0.9977 | 0.9977 | |||||
| HNGE / Hinge Health, Inc. | 0.25 | 0.00 | 12.27 | -5.16 | 0.9965 | -0.5552 | |||
| LYV / Live Nation Entertainment, Inc. | 0.07 | -50.00 | 12.26 | -45.99 | 0.9953 | -1.7263 | |||
| MIAX / Miami International Holdings, Inc. | 0.30 | 12.08 | 0.9809 | 0.9809 | |||||
| WDAY / Workday, Inc. | 0.05 | 12.04 | 0.9776 | 0.9776 | |||||
| WAY / Waystar Holding Corp. | 0.30 | -50.00 | 11.38 | -53.61 | 0.9239 | -2.0172 | |||
| OKLO / Oklo Inc. | 0.10 | -50.00 | 11.16 | -0.31 | 0.9066 | -0.4364 | |||
| PRMB / Primo Brands Corporation | 0.50 | -75.00 | 11.05 | -81.35 | 0.8975 | -6.2076 | |||
| SAIL / SailPoint, Inc. | 0.50 | 0.00 | 11.04 | -3.41 | 0.8966 | -0.4742 | |||
| NTSK / Netskope, Inc. | 0.46 | 10.52 | 0.8547 | 0.8547 | |||||
| SARO / StandardAero, Inc. | 0.38 | -50.00 | 10.23 | -56.89 | 0.8312 | -2.0159 | |||
| ORLY / O'Reilly Automotive, Inc. | 0.09 | 0.00 | 9.70 | 19.62 | 0.7880 | -0.1849 | |||
| BLSH / Bullish | 0.15 | 9.54 | 0.7749 | 0.7749 | |||||
| NIQ / NIQ Global Intelligence plc | 0.60 | 9.42 | 0.7651 | 0.7651 | |||||
| OS / OneStream, Inc. | 0.50 | -41.18 | 9.21 | -61.69 | 0.7484 | -2.1367 | |||
| CWAN / Clearwater Analytics Holdings, Inc. | 0.50 | -25.05 | 9.01 | -38.41 | 0.7318 | -1.0229 | |||
| NWSA / News Corporation | 0.25 | 8.64 | 0.7015 | 0.7015 | |||||
| RIG / Transocean Ltd. | 2.75 | 8.58 | 0.6968 | 0.6968 | |||||
| MRX / Marex Group plc | 0.25 | -43.99 | 8.40 | -52.29 | 0.6826 | -1.4305 | |||
| LPLA / LPL Financial Holdings Inc. | 0.03 | -50.00 | 8.32 | -55.64 | 0.6755 | -1.5731 | |||
| CVX / Chevron Corporation | 0.05 | 7.76 | 0.6306 | 0.6306 | |||||
| LINE / Lineage, Inc. | 0.20 | 0.00 | 7.73 | -11.21 | 0.6276 | -0.4163 | |||
| VNOM / Viper Energy, Inc. | 0.20 | 7.64 | 0.6208 | 0.6208 | |||||
| SFD / Smithfield Foods, Inc. | 0.33 | 30.00 | 7.63 | 29.73 | 0.6198 | -0.0858 | |||
| QXO / QXO, Inc. | 0.40 | -42.32 | 7.62 | -48.96 | 0.6192 | -1.1725 | |||
| FIGR / Figure Technology Solutions, Inc. | 0.20 | 7.27 | 0.5908 | 0.5908 | |||||
| WBI / WaterBridge Infrastructure LLC | 0.25 | 6.30 | 0.5121 | 0.5121 | |||||
| HGV / Hilton Grand Vacations Inc. | 0.15 | 6.27 | 0.5094 | 0.5094 | |||||
| CHWY / Chewy, Inc. | 0.15 | 0.00 | 6.07 | -5.10 | 0.4928 | -0.2740 | |||
| LOAR / Loar Holdings Inc. | 0.07 | -25.00 | 6.00 | -30.37 | 0.4873 | -0.5462 | |||
| VVX / V2X, Inc. | 0.10 | 5.81 | 0.4718 | 0.4718 | |||||
| VOYG / Voyager Technologies, Inc. | 0.19 | 7.68 | 5.61 | -18.30 | 0.4558 | -0.3681 | |||
| GGAL / Grupo Financiero Galicia S.A. - Depositary Receipt (Common Stock) | 0.20 | 0.00 | 5.51 | -45.31 | 0.4477 | -0.7611 | |||
| LB / LandBridge Company LLC | 0.10 | 0.00 | 5.33 | -21.06 | 0.4333 | -0.3772 | |||
| IDA / IDACORP, Inc. | 0.04 | -46.67 | 5.29 | -38.95 | 0.4293 | -0.6092 | |||
| FORD / Forward Industries, Inc. | 0.27 | 5.00 | 0.4061 | 0.4061 | |||||
| BIRK / Birkenstock Holding plc | 0.10 | -50.00 | 4.53 | -54.00 | 0.3675 | -0.8122 | |||
| LTM / LATAM Airlines Group S.A. - Depositary Receipt (Common Stock) | 0.10 | 4.53 | 0.3675 | 0.3675 | |||||
| FLY / Firefly Aerospace Inc. | 0.15 | 4.40 | 0.3572 | 0.3572 | |||||
| ADT / ADT Inc. | 0.50 | 0.00 | 4.36 | 2.83 | 0.3537 | -0.1542 | |||
| KVYO / Klaviyo, Inc. | 0.15 | 4.15 | 0.3373 | 0.3373 | |||||
| ETOR / eToro Group Ltd. | 0.10 | 300.00 | 4.13 | 148.02 | 0.3352 | 0.1355 | |||
| SNPS / Synopsys, Inc. | 0.01 | 3.86 | 0.3132 | 0.3132 | |||||
| MMYT / MakeMyTrip Limited | 0.04 | -46.67 | 3.74 | -49.07 | 0.3041 | -0.5776 | |||
| KGS / Kodiak Gas Services, Inc. | 0.10 | -50.00 | 3.70 | -46.06 | 0.3003 | -0.5218 | |||
| TBBB / BBB Foods Inc. | 0.12 | -50.00 | 3.37 | -51.44 | 0.2737 | -0.5587 | |||
| CHYM / Chime Financial, Inc. | 0.15 | 50.00 | 3.03 | -12.34 | 0.2457 | -0.1682 | |||
| CAI / Caris Life Sciences, Inc. | 0.10 | 100.00 | 3.02 | 126.42 | 0.2457 | 0.0854 | |||
| ARX / Accelerant Holdings | 0.20 | 2.98 | 0.2419 | 0.2419 | |||||
| DLO / DLocal Limited | 0.20 | 2.86 | 0.2320 | 0.2320 | |||||
| GRDN / Guardian Pharmacy Services, Inc. | 0.10 | -50.00 | 2.62 | -38.46 | 0.2130 | -0.2981 | |||
| STUB / StubHub Holdings, Inc. | 0.15 | 2.53 | 0.2052 | 0.2052 | |||||
| MH / McGraw Hill, Inc. | 0.20 | 2.51 | 0.2036 | 0.2036 | |||||
| VIA / Via Transportation, Inc. | 0.05 | 2.40 | 0.1952 | 0.1952 | |||||
| BRCB / Black Rock Coffee Bar, Inc. | 0.10 | 2.39 | 0.1938 | 0.1938 | |||||
| PTRN / Pattern Group Inc. | 0.15 | 2.06 | 0.1669 | 0.1669 | |||||
| BOW / Bowhead Specialty Holdings Inc. | 0.07 | 50.00 | 2.03 | 8.10 | 0.1647 | -0.0604 | |||
| CHECU / Chenghe Acquisition III Co. - Debt/Equity Composite Units | 0.20 | 1.96 | 0.1591 | 0.1591 | |||||
| KLAR / Klarna Group plc | 0.05 | 1.83 | 0.1488 | 0.1488 | |||||
| HTFL / HeartFlow, Inc. | 0.05 | 1.68 | 0.1367 | 0.1367 | |||||
| AMBQ / Ambiq Micro, Inc. | 0.05 | 1.50 | 0.1215 | 0.1215 | |||||
| SFNC / Simmons First National Corporation | 0.07 | 1.44 | 0.1168 | 0.1168 | |||||
| TWFG / TWFG, Inc. | 0.05 | 25.00 | 1.37 | -2.00 | 0.1114 | -0.0565 | |||
| GEMI / Gemini Space Station, Inc. | 0.05 | 1.20 | 0.0973 | 0.0973 | |||||
| FLOC / Flowco Holdings Inc. | 0.07 | 0.00 | 1.04 | -16.61 | 0.0844 | -0.0651 | |||
| MNTN / MNTN, Inc. | 0.05 | 104.08 | 0.93 | 73.27 | 0.0753 | 0.0111 | |||
| INR / Infinity Natural Resources, Inc. | 0.05 | 0.00 | 0.66 | -28.42 | 0.0532 | -0.0566 | |||
| DEC / Diversified Energy Company | 0.03 | 0.47 | 0.0384 | 0.0384 | |||||
| AEP / American Electric Power Company, Inc. | 0.00 | -100.00 | 0.00 | -100.00 | -1.8667 | ||||
| ANSS / ANSYS, Inc. | 0.00 | -100.00 | 0.00 | 0.0000 | |||||
| CARR / Carrier Global Corporation | 0.00 | -100.00 | 0.00 | -100.00 | -0.8778 | ||||
| CALM / Cal-Maine Foods, Inc. | 0.00 | -100.00 | 0.00 | -100.00 | -0.8365 | ||||
| VNOM / Viper Energy, Inc. | 0.00 | -100.00 | 0.00 | 0.0000 | |||||
| ECVT / Ecovyst Inc. | 0.00 | -100.00 | 0.00 | -100.00 | -0.1481 | ||||
| AESI / Atlas Energy Solutions Inc. | 0.00 | -100.00 | 0.00 | -100.00 | -0.4009 | ||||
| JNJ / Johnson & Johnson | 0.00 | -100.00 | 0.00 | -100.00 | -0.9893 | ||||
| COCO / The Vita Coco Company, Inc. | 0.00 | -100.00 | 0.00 | 0.0000 | |||||
| AII / American Integrity Insurance Group, Inc. | 0.00 | -100.00 | 0.00 | -100.00 | -0.1103 | ||||
| AHL / Aspen Insurance Holdings Limited | 0.00 | -100.00 | 0.00 | -100.00 | -0.2265 | ||||
| SITM / SiTime Corporation | 0.00 | -100.00 | 0.00 | -100.00 | -0.3833 | ||||
| BTSG / BrightSpring Health Services, Inc. | 0.00 | -100.00 | 0.00 | -100.00 | -0.4244 | ||||
| CRGY / Crescent Energy Company | 0.00 | -100.00 | 0.00 | -100.00 | -0.2579 | ||||
| AS / Amer Sports, Inc. | 0.00 | -100.00 | 0.00 | -100.00 | -1.3946 |