Estatísticas Básicas
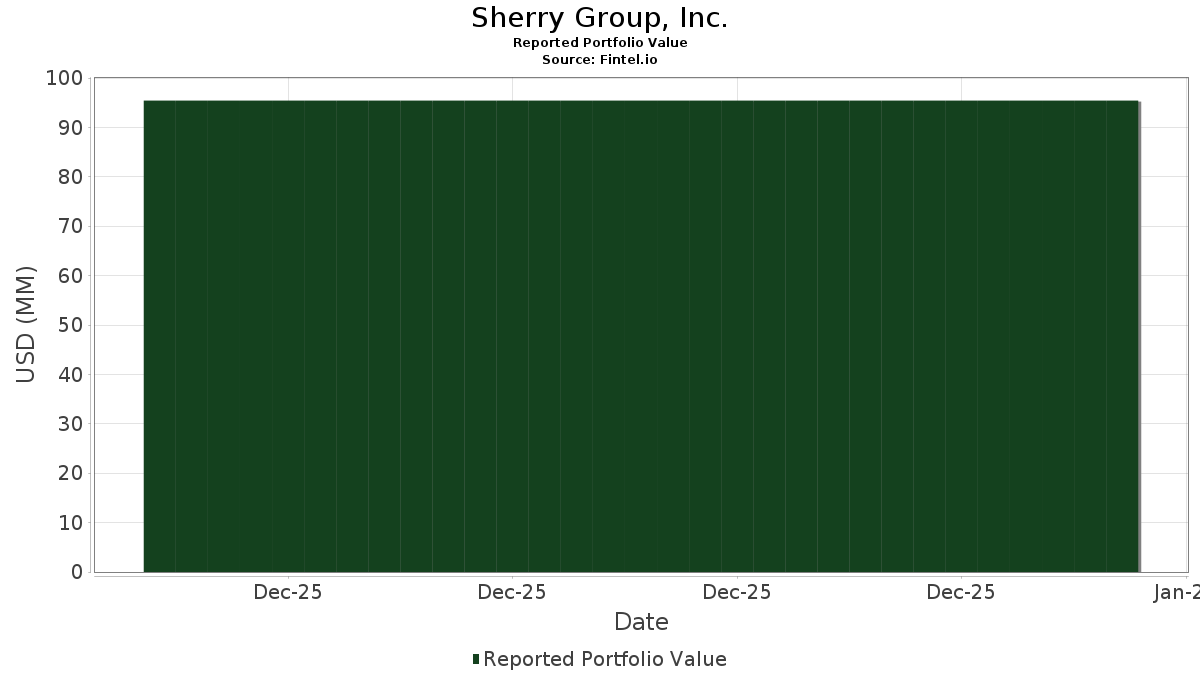
Valor do Portfólio $ 95,430,870
Posições Atuais 43
Últimas Participações, Desempenho, AUM (de 13F, 13D)

Sherry Group, Inc. divulgou 43 participações totais em seus últimos arquivamentos da SEC. O valor mais recente da carteira é calculado como $ 95,430,870 USD. O Ativo Total Sob Gestão (AUM) é esse valor mais o caixa (que não é divulgado). As principais posições de Sherry Group, Inc. são NVIDIA Corporation (US:NVDA) , iShares U.S. ETF Trust - iShares Ultra Short Duration Bond Active ETF (US:ICSH) , Vanguard Index Funds - Vanguard Large-Cap ETF (US:VV) , Tesla, Inc. (US:TSLA) , and Vanguard Bond Index Funds - Vanguard Total Bond Market ETF (US:BND) . As novas posições de Sherry Group, Inc. incluem NVIDIA Corporation (US:NVDA) , iShares U.S. ETF Trust - iShares Ultra Short Duration Bond Active ETF (US:ICSH) , Vanguard Index Funds - Vanguard Large-Cap ETF (US:VV) , Tesla, Inc. (US:TSLA) , and Vanguard Bond Index Funds - Vanguard Total Bond Market ETF (US:BND) .

Sherry Group, Inc. - Valor do Portfólio
Maiores Aumentos Este Trimestre

Usamos a mudança na alocação do portfólio porque esta é a métrica mais significativa. As mudanças podem ser devido a operações ou mudanças nos preços das ações.

Ativo Ações
(MM)
Valor
(MM$)
% do Portfólio Δ% do Portfólio
0.10 18.46 19.3400 19.3400
0.24 12.20 12.7818 12.7818
0.03 8.26 8.6549 8.6549
0.01 5.47 5.7276 5.7276
0.06 4.37 4.5818 4.5818
0.13 3.67 3.8505 3.8505
0.08 3.37 3.5341 3.5341
0.07 3.14 3.2943 3.2943
0.04 2.46 2.5736 2.5736
0.02 2.36 2.4755 2.4755
Maiores Diminuições Este Trimestre

Usamos a mudança na alocação do portfólio porque esta é a métrica mais significativa. As mudanças podem ser devido a operações ou mudanças nos preços das ações.

Ativo Ações
(MM)
Valor
(MM$)
% do Portfólio Δ% do Portfólio
Arquivamentos 13F e Fundo

Este formulário foi arquivado em 2026-02-05 para o período de relatório 2025-12-31. Clique no ícone de link para ver o histórico completo da transação.

Atualize para desbloquear dados premium e exportar para Excel .

2022-07-28: Nota Importante - Mudamos o tratamento da coluna Δ % do Portfólio nesta tabela. Anteriormente, estávamos relatando como a mudança percentual na alocação do portfólio. Agora estamos relatando como a mudança bruta na alocação do portfólio (ainda relatada como um percentual). Em termos de fórmula, antes relatávamos como 100 * (alocação atual - alocação anterior) / alocação anterior. Agora estamos relatando como (alocação atual - alocação anterior).
Ativo Tipo Preço Médio por Ação Ações
(MM)
ΔAções
(%)
Valor
($MM)
ΔAções
(%)
Portfólio
(%)
ΔPortfólio
(%)
NVDA / NVIDIA Corporation 0.10 18.46 19.3400 19.3400
ICSH / iShares U.S. ETF Trust - iShares Ultra Short Duration Bond Active ETF 0.24 12.20 12.7818 12.7818
VV / Vanguard Index Funds - Vanguard Large-Cap ETF 0.03 8.26 8.6549 8.6549
TSLA / Tesla, Inc. 0.01 5.47 5.7276 5.7276
BND / Vanguard Bond Index Funds - Vanguard Total Bond Market ETF 0.06 4.37 4.5818 4.5818
NNOV / Innovator ETFs Trust - Innovator Growth-100 Power Buffer ETF - November 0.13 3.67 3.8505 3.8505
KJAN / Innovator ETFs Trust - Innovator U.S. Small Cap Power Buffer ETF - January 0.08 3.37 3.5341 3.5341
PNOV / Innovator ETFs Trust - Innovator U.S. Equity Power Buffer ETF - November 0.07 3.14 3.2943 3.2943
VEA / Vanguard Tax-Managed Funds - Vanguard FTSE Developed Markets ETF 0.04 2.46 2.5736 2.5736
WMT / Walmart Inc. 0.02 2.36 2.4755 2.4755
VO / Vanguard Index Funds - Vanguard Mid-Cap ETF 0.01 2.32 2.4286 2.4286
FALN / iShares Trust - iShares Fallen Angels USD Bond ETF 0.08 2.18 2.2833 2.2833
NFLX / Netflix, Inc. 0.02 1.88 1.9683 1.9683
DIV / Global X Funds - Global X SuperDividend U.S. ETF 0.11 1.88 1.9681 1.9681
OMAH / Tidal Trust III - Vistashares Target 15 Berkshire Select Income ETF 0.10 1.87 1.9617 1.9617
EQL / ALPS ETF Trust - ALPS Equal Sector Weight ETF 0.04 1.71 1.7880 1.7880
XLK / The Select Sector SPDR Trust - State Street Technology Select Sector SPDR ETF 0.01 1.48 1.5484 1.5484
BRK.B / Berkshire Hathaway Inc. 0.00 1.43 1.4959 1.4959
IJR / iShares Trust - iShares Core S&P Small-Cap ETF 0.01 1.20 1.2594 1.2594
NAUG / Innovator ETFs Trust - Innovator Growth-100 Power Buffer ETF - August 0.04 1.18 1.2330 1.2330
XSOE / WisdomTree Trust - WisdomTree Emerging Markets ex-State-Owned Enterprises Fund 0.03 1.18 1.2319 1.2319
VTI / Vanguard Index Funds - Vanguard Total Stock Market ETF 0.00 1.18 1.2313 1.2313
VGT / Vanguard World Fund - Vanguard Information Technology ETF 0.00 1.17 1.2295 1.2295
XLRE / The Select Sector SPDR Trust - State Street Real Estate Select Sector SPDR ETF 0.03 1.14 1.1926 1.1926
KNOV / Innovator ETFs Trust - Innovator U.S. Small Cap Power Buffer ETF - November 0.04 1.13 1.1800 1.1800
XLE / The Select Sector SPDR Trust - State Street Energy Select Sector SPDR ETF 0.02 1.08 1.1363 1.1363
AMZN / Amazon.com, Inc. 0.00 1.08 1.1306 1.1306
AAPL / Apple Inc. 0.00 0.98 1.0259 1.0259
ZM / Zoom Communications, Inc. 0.01 0.89 0.9365 0.9365
XLF / The Select Sector SPDR Trust - State Street Financial Select Sector SPDR ETF 0.01 0.83 0.8655 0.8655
VIG / Vanguard Specialized Funds - Vanguard Dividend Appreciation ETF 0.00 0.78 0.8123 0.8123
GOOGL / Alphabet Inc. 0.00 0.42 0.4359 0.4359
VDE / Vanguard World Fund - Vanguard Energy ETF 0.00 0.37 0.3840 0.3840
SLV / iShares Silver Trust 0.01 0.36 0.3796 0.3796
UBER / Uber Technologies, Inc. 0.00 0.33 0.3411 0.3411
META / Meta Platforms, Inc. 0.00 0.32 0.3308 0.3308
KAUG / Innovator ETFs Trust - Innovator U.S. Small Cap Power Buffer ETF - August 0.01 0.30 0.3153 0.3153
VZ / Verizon Communications Inc. 0.01 0.22 0.2333 0.2333
MSFT / Microsoft Corporation 0.00 0.21 0.2253 0.2253
SCHB / Schwab Strategic Trust - Schwab U.S. Broad Market ETF 0.01 0.21 0.2174 0.2174
MDY / State Street SPDR S&P MIDCAP 400 ETF Trust 0.00 0.21 0.2171 0.2171
PDM / Piedmont Realty Trust, Inc. 0.01 0.10 0.1002 0.1002
ANVS / Annovis Bio, Inc. 0.03 0.09 0.0989 0.0989