Estatísticas Básicas
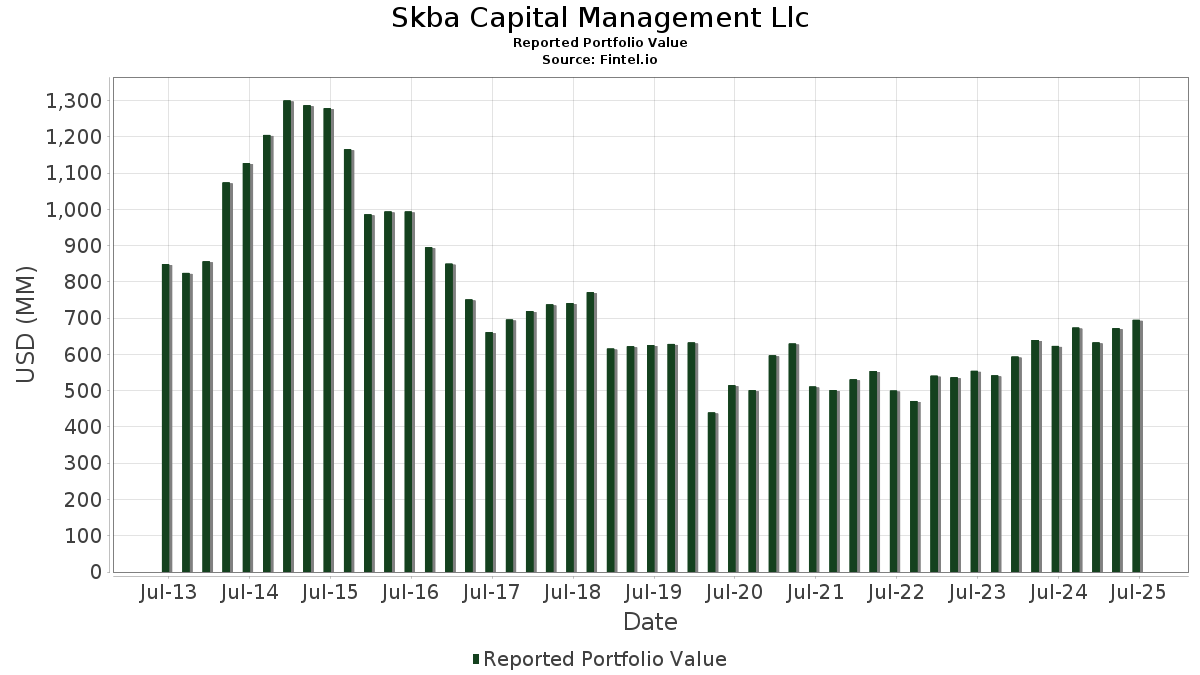
| Valor do Portfólio | $ 723,345,206 |
| Posições Atuais | 81 |
Últimas Participações, Desempenho, AUM (de 13F, 13D)
Skba Capital Management Llc divulgou 81 participações totais em seus últimos arquivamentos da SEC. O valor mais recente da carteira é calculado como $ 723,345,206 USD. O Ativo Total Sob Gestão (AUM) é esse valor mais o caixa (que não é divulgado). As principais posições de Skba Capital Management Llc são Medtronic plc (US:MDT) , RTX Corporation (US:RTX) , Kontoor Brands, Inc. (US:KTB) , AT&T Inc. (US:T) , and Kinder Morgan, Inc. (US:KMI) .
Maiores Aumentos Este Trimestre
Usamos a mudança na alocação do portfólio porque esta é a métrica mais significativa. As mudanças podem ser devido a operações ou mudanças nos preços das ações.
| Ativo | Ações (MM) |
Valor (MM$) |
% do Portfólio | Δ% do Portfólio |
|---|---|---|---|---|
| 0.06 | 10.76 | 1.4882 | 1.4054 | |
| 0.28 | 22.65 | 3.1307 | 0.7781 | |
| 0.14 | 13.55 | 1.8737 | 0.4675 | |
| 0.08 | 14.09 | 1.9480 | 0.4397 | |
| 0.11 | 16.80 | 2.3219 | 0.4388 | |
| 0.31 | 29.79 | 4.1180 | 0.3404 | |
| 0.06 | 16.86 | 2.3308 | 0.3389 | |
| 0.89 | 16.12 | 2.2282 | 0.2449 | |
| 0.18 | 18.30 | 2.5300 | 0.2439 | |
| 0.05 | 11.26 | 1.5565 | 0.1574 |
Maiores Diminuições Este Trimestre
Usamos a mudança na alocação do portfólio porque esta é a métrica mais significativa. As mudanças podem ser devido a operações ou mudanças nos preços das ações.
| Ativo | Ações (MM) |
Valor (MM$) |
% do Portfólio | Δ% do Portfólio |
|---|---|---|---|---|
| 0.06 | 7.08 | 0.9783 | -0.7834 | |
| 0.20 | 6.21 | 0.8589 | -0.6368 | |
| 0.05 | 9.50 | 1.3136 | -0.5566 | |
| 0.55 | 17.47 | 2.4152 | -0.4384 | |
| 0.05 | 7.34 | 1.0144 | -0.3498 | |
| 0.10 | 5.81 | 0.8037 | -0.3072 | |
| 1.14 | 14.47 | 2.0007 | -0.2780 | |
| 0.72 | 20.34 | 2.8119 | -0.2604 | |
| 0.27 | 7.28 | 1.0061 | -0.2577 | |
| 0.07 | 19.67 | 2.7190 | -0.2367 |
Arquivamentos 13F e Fundo
Este formulário foi arquivado em 2025-11-12 para o período de relatório 2025-09-30. Clique no ícone de link para ver o histórico completo da transação.
Atualize para desbloquear dados premium e exportar para Excel ![]() .
.
| Ativo | Tipo | Preço Médio por Ação | Ações (MM) |
ΔAções (%) |
Valor ($MM) |
ΔAções (%) |
Portfólio (%) |
ΔPortfólio (%) |
|
|---|---|---|---|---|---|---|---|---|---|
| MDT / Medtronic plc | 0.31 | 3.82 | 29.79 | 13.43 | 4.1180 | 0.3404 | |||
| RTX / RTX Corporation | 0.17 | -14.15 | 29.26 | -1.62 | 4.0446 | -0.2334 | |||
| KTB / Kontoor Brands, Inc. | 0.28 | 14.51 | 22.65 | 38.47 | 3.1307 | 0.7781 | |||
| T / AT&T Inc. | 0.72 | 0.40 | 20.36 | -2.02 | 2.8148 | -0.1746 | |||
| KMI / Kinder Morgan, Inc. | 0.72 | -1.10 | 20.34 | -4.77 | 2.8119 | -0.2604 | |||
| IBM / International Business Machines Corporation | 0.07 | 0.00 | 19.67 | -4.28 | 2.7190 | -0.2367 | |||
| CME / CME Group Inc. | 0.07 | 1.07 | 19.11 | -0.92 | 2.6413 | -0.1325 | |||
| C / Citigroup Inc. | 0.18 | -3.43 | 18.30 | 15.16 | 2.5300 | 0.2439 | |||
| CRBG / Corebridge Financial, Inc. | 0.55 | -2.45 | 17.47 | -11.93 | 2.4152 | -0.4384 | |||
| MMM / 3M Company | 0.11 | 0.00 | 17.10 | 1.93 | 2.3646 | -0.0492 | |||
| LHX / L3Harris Technologies, Inc. | 0.06 | 0.00 | 16.86 | 21.75 | 2.3308 | 0.3389 | |||
| CVX / Chevron Corporation | 0.11 | 18.30 | 16.80 | 28.29 | 2.3219 | 0.4388 | |||
| COP / ConocoPhillips | 0.18 | 0.06 | 16.79 | 5.46 | 2.3217 | 0.0311 | |||
| HR / Healthcare Realty Trust Incorporated | 0.89 | 2.83 | 16.12 | 16.90 | 2.2282 | 0.2449 | |||
| XRAY / DENTSPLY SIRONA Inc. | 1.14 | 14.33 | 14.47 | -8.64 | 2.0007 | -0.2780 | |||
| PNW / Pinnacle West Capital Corporation | 0.16 | 0.37 | 14.46 | 0.59 | 1.9995 | -0.0689 | |||
| WFC / Wells Fargo & Company | 0.17 | 0.12 | 14.30 | 4.74 | 1.9775 | 0.0130 | |||
| APD / Air Products and Chemicals, Inc. | 0.05 | 9.39 | 14.20 | 5.77 | 1.9629 | 0.0319 | |||
| HSY / The Hershey Company | 0.08 | 19.23 | 14.09 | 34.40 | 1.9480 | 0.4397 | |||
| MRK / Merck & Co., Inc. | 0.17 | -0.82 | 13.88 | 5.16 | 1.9192 | 0.0201 | |||
| RDN / Radian Group Inc. | 0.38 | 0.00 | 13.77 | 0.56 | 1.9033 | -0.0662 | |||
| KVUE / Kenvue Inc. | 0.85 | 24.04 | 13.73 | -3.82 | 1.8977 | -0.1553 | |||
| DEO / Diageo plc - Depositary Receipt (Common Stock) | 0.14 | 46.50 | 13.55 | 38.64 | 1.8737 | 0.4675 | |||
| NTAP / NetApp, Inc. | 0.11 | 0.09 | 13.16 | 11.28 | 1.8194 | 0.1181 | |||
| TFC / Truist Financial Corporation | 0.28 | 0.18 | 12.87 | 6.54 | 1.7793 | 0.0415 | |||
| AIG / American International Group, Inc. | 0.16 | 0.00 | 12.74 | -8.23 | 1.7617 | -0.2359 | |||
| MET / MetLife, Inc. | 0.15 | 0.16 | 12.62 | 2.59 | 1.7445 | -0.0248 | |||
| PFE / Pfizer Inc. | 0.49 | -0.63 | 12.55 | 4.45 | 1.7347 | 0.0067 | |||
| NXPI / NXP Semiconductors N.V. | 0.05 | 0.99 | 11.66 | 5.26 | 1.6116 | 0.0184 | |||
| AEP / American Electric Power Company, Inc. | 0.10 | 1.48 | 11.59 | 10.03 | 1.6026 | 0.0870 | |||
| PSX / Phillips 66 | 0.08 | 0.12 | 11.50 | 14.15 | 1.5896 | 0.1406 | |||
| CSCO / Cisco Systems, Inc. | 0.17 | 0.79 | 11.40 | -0.61 | 1.5760 | -0.0739 | |||
| PKG / Packaging Corporation of America | 0.05 | 0.10 | 11.26 | 15.75 | 1.5565 | 0.1574 | |||
| HAS / Hasbro, Inc. | 0.15 | -11.84 | 11.07 | -9.42 | 1.5302 | -0.2275 | |||
| BDX / Becton, Dickinson and Company | 0.06 | 1,619.92 | 10.76 | 1,768.75 | 1.4882 | 1.4054 | |||
| VICI / VICI Properties Inc. | 0.32 | 0.06 | 10.35 | 0.10 | 1.4311 | -0.0566 | |||
| WY / Weyerhaeuser Company | 0.40 | 12.17 | 9.91 | 8.24 | 1.3697 | 0.0529 | |||
| AMGN / Amgen Inc. | 0.03 | 0.00 | 9.78 | 1.07 | 1.3522 | -0.0399 | |||
| DRI / Darden Restaurants, Inc. | 0.05 | -16.31 | 9.50 | -26.92 | 1.3136 | -0.5566 | |||
| USB / U.S. Bancorp | 0.19 | 0.16 | 9.34 | 6.96 | 1.2914 | 0.0353 | |||
| TXN / Texas Instruments Incorporated | 0.05 | 0.10 | 9.11 | -11.41 | 1.2598 | -0.2200 | |||
| UNP / Union Pacific Corporation | 0.03 | 9.22 | 8.17 | 12.22 | 1.1300 | 0.0821 | |||
| NKE / NIKE, Inc. | 0.11 | 6.91 | 7.83 | 4.95 | 1.0824 | 0.0092 | |||
| PH / Parker-Hannifin Corporation | 0.01 | 0.00 | 7.49 | 8.55 | 1.0355 | 0.0429 | |||
| TAP / Molson Coors Beverage Company | 0.16 | -2.21 | 7.43 | -7.99 | 1.0269 | -0.1343 | |||
| O / Realty Income Corporation | 0.12 | -0.57 | 7.36 | 4.92 | 1.0170 | 0.0084 | |||
| CAH / Cardinal Health, Inc. | 0.05 | -17.18 | 7.34 | -22.63 | 1.0144 | -0.3498 | |||
| PHG / Koninklijke Philips N.V. - Depositary Receipt (Common Stock) | 0.27 | -27.13 | 7.28 | -17.17 | 1.0061 | -0.2577 | |||
| GPC / Genuine Parts Company | 0.05 | 1.06 | 7.27 | 15.47 | 1.0049 | 0.0993 | |||
| INGR / Ingredion Incorporated | 0.06 | -35.83 | 7.08 | -42.22 | 0.9783 | -0.7834 | |||
| AL / Air Lease Corporation | 0.11 | -0.81 | 6.98 | 7.93 | 0.9649 | 0.0347 | |||
| CMCSA / Comcast Corporation | 0.20 | -32.13 | 6.21 | -40.25 | 0.8589 | -0.6368 | |||
| PEP / PepsiCo, Inc. | 0.04 | 0.04 | 5.97 | 6.40 | 0.8257 | 0.0182 | |||
| BAM / Brookfield Asset Management Ltd. | 0.10 | -26.91 | 5.81 | -24.72 | 0.8037 | -0.3072 | |||
| NVT / nVent Electric plc | 0.02 | -7.70 | 1.92 | 24.33 | 0.2649 | 0.0432 | |||
| WRB / W. R. Berkley Corporation | 0.02 | 9.04 | 1.66 | 13.68 | 0.2299 | 0.0195 | |||
| TPL / Texas Pacific Land Corporation | 0.00 | 14.14 | 1.52 | 0.86 | 0.2105 | -0.0066 | |||
| BRK.A / Berkshire Hathaway Inc. | 0.00 | 17.74 | 1.40 | 21.83 | 0.1938 | 0.0283 | |||
| JPM / JPMorgan Chase & Co. | 0.00 | 0.00 | 1.38 | 8.81 | 0.1913 | 0.0084 | |||
| AXP / American Express Company | 0.00 | 0.00 | 1.24 | 4.11 | 0.1717 | 0.0001 | |||
| ABBV / AbbVie Inc. | 0.01 | 0.00 | 1.16 | 24.81 | 0.1607 | 0.0266 | |||
| AMP / Ameriprise Financial, Inc. | 0.00 | -0.45 | 1.10 | -8.43 | 0.1518 | -0.0206 | |||
| GOOGL / Alphabet Inc. | 0.00 | -1.24 | 0.97 | 36.29 | 0.1341 | 0.0317 | |||
| GPK / Graphic Packaging Holding Company | 0.04 | 42.99 | 0.87 | 32.98 | 0.1199 | 0.0260 | |||
| LH / Labcorp Holdings Inc. | 0.00 | 3.50 | 0.85 | 13.20 | 0.1175 | 0.0095 | |||
| COHR / Coherent Corp. | 0.01 | 4.21 | 0.80 | 26.03 | 0.1105 | 0.0191 | |||
| AVTR / Avantor, Inc. | 0.06 | 96.24 | 0.78 | 82.01 | 0.1078 | 0.0462 | |||
| BKFOF / Brookfield Corporation - Preferred Stock | 0.01 | 0.00 | 0.77 | 10.76 | 0.1069 | 0.0066 | |||
| REGN / Regeneron Pharmaceuticals, Inc. | 0.00 | 8.35 | 0.73 | 16.08 | 0.1009 | 0.0104 | |||
| SOLV / Solventum Corporation | 0.01 | 26.22 | 0.68 | 21.51 | 0.0938 | 0.0135 | |||
| AZN / AstraZeneca PLC - Depositary Receipt (Common Stock) | 0.01 | 6.76 | 0.61 | 17.25 | 0.0837 | 0.0094 | |||
| CMI / Cummins Inc. | 0.00 | 0.00 | 0.59 | 29.04 | 0.0818 | 0.0158 | |||
| MDLZ / Mondelez International, Inc. | 0.01 | 1.14 | 0.55 | -6.28 | 0.0763 | -0.0084 | |||
| CBOE / Cboe Global Markets, Inc. | 0.00 | 0.00 | 0.54 | 5.08 | 0.0745 | 0.0008 | |||
| WEC / WEC Energy Group, Inc. | 0.00 | 77.95 | 0.54 | 95.62 | 0.0741 | 0.0347 | |||
| IBKR / Interactive Brokers Group, Inc. | 0.01 | 0.00 | 0.47 | 24.41 | 0.0656 | 0.0106 | |||
| TEL / TE Connectivity plc | 0.00 | -0.10 | 0.45 | 30.06 | 0.0622 | 0.0124 | |||
| GLW / Corning Incorporated | 0.00 | -32.83 | 0.37 | 4.79 | 0.0515 | 0.0003 | |||
| CLVT / Clarivate Plc | 0.08 | 0.00 | 0.32 | -11.05 | 0.0446 | -0.0075 | |||
| DVN / Devon Energy Corporation | 0.01 | 24.38 | 0.32 | 37.18 | 0.0445 | 0.0107 | |||
| BAC / Bank of America Corporation | 0.01 | 0.00 | 0.29 | 9.16 | 0.0396 | 0.0018 | |||
| FDX / FedEx Corporation | 0.00 | -100.00 | 0.00 | -100.00 | -0.0301 | ||||
| TGT / Target Corporation | 0.00 | -100.00 | 0.00 | 0.0000 | |||||
| LOW / Lowe's Companies, Inc. | 0.00 | -100.00 | 0.00 | 0.0000 |