Estatísticas Básicas
| Valor do Portfólio | $ 600,932 |
| Posições Atuais | 63 |
Últimas Participações, Desempenho, AUM (de 13F, 13D)
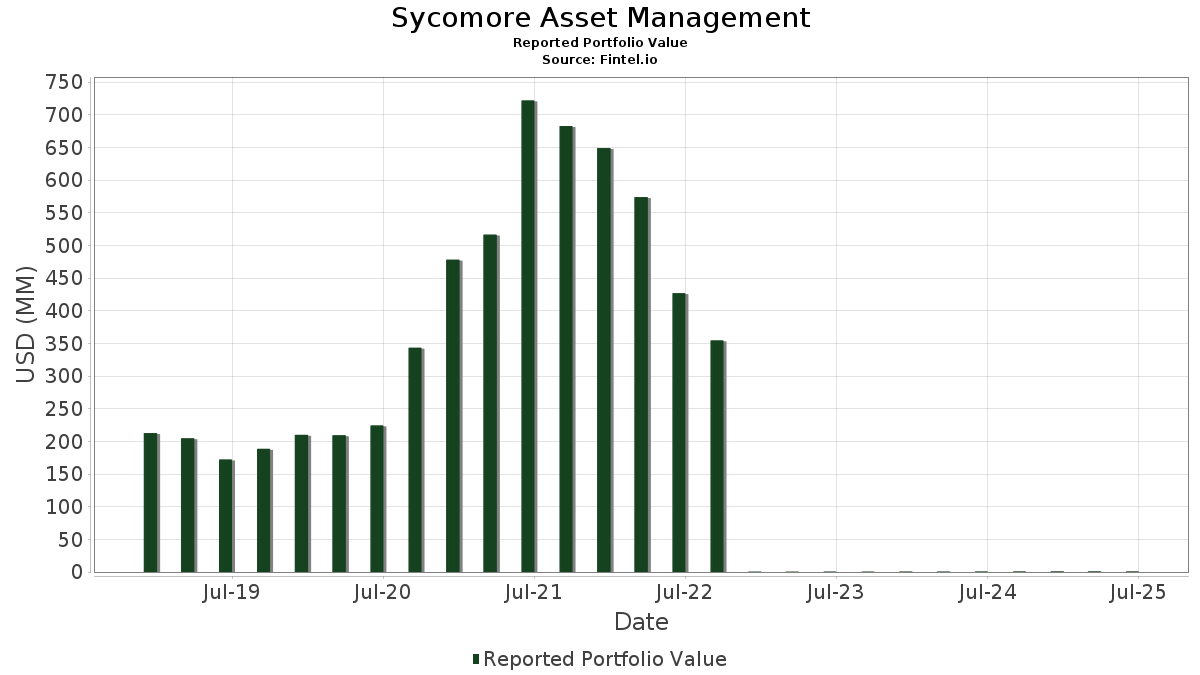
Sycomore Asset Management divulgou 63 participações totais em seus últimos arquivamentos da SEC. O valor mais recente da carteira é calculado como $ 600,932 USD. O Ativo Total Sob Gestão (AUM) é esse valor mais o caixa (que não é divulgado). As principais posições de Sycomore Asset Management são Microsoft Corporation (US:MSFT) , NVIDIA Corporation (MX:NVDA) , Waste Connections, Inc. (US:WCN) , Workday, Inc. (US:WDAY) , and ServiceNow, Inc. (US:NOW) .
Maiores Aumentos Este Trimestre
Usamos a mudança na alocação do portfólio porque esta é a métrica mais significativa. As mudanças podem ser devido a operações ou mudanças nos preços das ações.
| Ativo | Ações (MM) |
Valor (MM$) |
% do Portfólio | Δ% do Portfólio |
|---|---|---|---|---|
| 0.06 | 0.02 | 3.3892 | 3.3892 | |
| 0.07 | 0.01 | 1.8937 | 1.8937 | |
| 0.19 | 0.08 | 13.6270 | 0.9192 | |
| 0.02 | 0.00 | 0.7761 | 0.7761 | |
| 0.03 | 0.00 | 0.5789 | 0.5789 | |
| 0.38 | 0.05 | 7.8516 | 0.5296 | |
| 0.12 | 0.03 | 4.6944 | 0.3167 | |
| 0.10 | 0.02 | 4.0103 | 0.2705 | |
| 0.03 | 0.02 | 3.7848 | 0.2553 | |
| 1.11 | 0.02 | 2.9870 | 0.2381 |
Maiores Diminuições Este Trimestre
Usamos a mudança na alocação do portfólio porque esta é a métrica mais significativa. As mudanças podem ser devido a operações ou mudanças nos preços das ações.
| Ativo | Ações (MM) |
Valor (MM$) |
% do Portfólio | Δ% do Portfólio |
|---|---|---|---|---|
| 0.00 | 0.00 | -2.8793 | ||
| 0.00 | 0.00 | -1.9761 | ||
| 0.00 | 0.00 | -1.4299 | ||
| 0.00 | 0.00 | -1.1969 | ||
| 0.00 | 0.00 | -0.3211 |
Arquivamentos 13F e Fundo
Este formulário foi arquivado em 2025-11-21 para o período de relatório 2025-09-30. Clique no ícone de link para ver o histórico completo da transação.
Atualize para desbloquear dados premium e exportar para Excel ![]() .
.
| Ativo | Tipo | Preço Médio por Ação | Ações (MM) |
ΔAções (%) |
Valor ($MM) |
ΔAções (%) |
Portfólio (%) |
ΔPortfólio (%) |
|
|---|---|---|---|---|---|---|---|---|---|
| MSFT / Microsoft Corporation | 0.19 | 0.00 | 0.08 | 0.00 | 13.6270 | 0.9192 | |||
| NVDA / NVIDIA Corporation | 0.38 | 0.00 | 0.05 | 0.00 | 7.8516 | 0.5296 | |||
| WCN / Waste Connections, Inc. | 0.12 | 0.00 | 0.03 | 0.00 | 4.6944 | 0.3167 | |||
| WDAY / Workday, Inc. | 0.10 | 0.00 | 0.02 | 0.00 | 4.0103 | 0.2705 | |||
| NOW / ServiceNow, Inc. | 0.03 | 0.00 | 0.02 | 0.00 | 3.7848 | 0.2553 | |||
| ACN / Accenture plc | 0.06 | 0.02 | 3.3892 | 3.3892 | |||||
| MA / Mastercard Incorporated | 0.04 | 0.00 | 0.02 | 0.00 | 3.2564 | 0.2197 | |||
| LLY / Eli Lilly and Company | 0.02 | 0.00 | 0.02 | 0.00 | 3.0624 | 0.2066 | |||
| SW / Smurfit Westrock Plc | 0.49 | 0.00 | 0.02 | 0.00 | 2.9953 | 0.2021 | |||
| STLAMM / Stellantis N.V. | 1.11 | 0.00 | 0.02 | 0.00 | 2.9870 | 0.2381 | |||
| SYK / Stryker Corporation | 0.05 | 0.00 | 0.02 | 0.00 | 2.8609 | 0.1930 | |||
| MU / Micron Technology, Inc. | 0.16 | 0.00 | 0.02 | 0.00 | 2.8476 | 0.1921 | |||
| TMUS / T-Mobile US, Inc. | 0.08 | 0.00 | 0.02 | 0.00 | 2.6589 | 0.1794 | |||
| ETN / Eaton Corporation plc | 0.04 | 0.00 | 0.01 | 0.00 | 2.4620 | 0.1661 | |||
| TMO / Thermo Fisher Scientific Inc. | 0.02 | 0.00 | 0.01 | 0.00 | 2.4033 | 0.1621 | |||
| ALCZ / Alcon Inc. | 0.13 | 0.00 | 0.01 | 0.00 | 2.3059 | 0.1818 | |||
| RACE / Ferrari N.V. | 0.02 | 0.00 | 0.01 | 0.00 | 1.9488 | 0.1554 | |||
| AMD / Advanced Micro Devices, Inc. | 0.07 | 0.01 | 1.8937 | 1.8937 | |||||
| URI / United Rentals, Inc. | 0.01 | 0.00 | 0.01 | 0.00 | 1.8779 | 0.1267 | |||
| SNPS / Synopsys, Inc. | 0.02 | 0.00 | 0.01 | 0.00 | 1.8057 | 0.1218 | |||
| PSTG / Pure Storage, Inc. | 0.19 | 0.00 | 0.01 | 0.00 | 1.5772 | 0.1064 | |||
| VEEV / Veeva Systems Inc. | 0.04 | 0.00 | 0.01 | 0.00 | 1.4035 | 0.0947 | |||
| DUOL / Duolingo, Inc. | 0.03 | 0.00 | 0.01 | 0.00 | 1.3036 | 0.0879 | |||
| GOOGL / Alphabet Inc. | 0.05 | 0.00 | 0.01 | 0.00 | 1.2945 | 0.0873 | |||
| CLH / Clean Harbors, Inc. | 0.03 | 0.00 | 0.01 | 0.00 | 1.2727 | 0.0858 | |||
| TSM / Taiwan Semiconductor Manufacturing Company Limited - Depositary Receipt (Common Stock) | 0.04 | 0.00 | 0.01 | 0.00 | 1.2599 | 0.0850 | |||
| SNOW / Snowflake Inc. | 0.06 | 0.00 | 0.01 | 0.00 | 1.1913 | 0.0804 | |||
| GTLB / GitLab Inc. | 0.13 | 0.00 | 0.01 | 0.00 | 1.1436 | 0.0771 | |||
| DE / Deere & Company | 0.02 | 0.00 | 0.01 | 0.00 | 1.0843 | 0.0731 | |||
| VRSK / Verisk Analytics, Inc. | 0.02 | 0.00 | 0.01 | 0.00 | 1.0620 | 0.0716 | |||
| JPM / JPMorgan Chase & Co. | 0.03 | 0.00 | 0.01 | 0.00 | 1.0181 | 0.0687 | |||
| WAB / Westinghouse Air Brake Technologies Corporation | 0.03 | 0.00 | 0.01 | 0.00 | 1.0179 | 0.0687 | |||
| PANW / Palo Alto Networks, Inc. | 0.02 | 0.00 | 0.01 | 0.00 | 0.9788 | 0.0660 | |||
| PWR / Quanta Services, Inc. | 0.02 | 0.00 | 0.01 | 0.00 | 0.9595 | 0.0647 | |||
| S / SentinelOne, Inc. | 0.21 | 0.00 | 0.00 | 0.00 | 0.8280 | 0.0559 | |||
| AAPL / Apple Inc. | 0.02 | 0.00 | 0.00 | 0.00 | 0.8132 | 0.0549 | |||
| DAR / Darling Ingredients Inc. | 0.13 | 0.00 | 0.00 | 0.00 | 0.7893 | 0.0532 | |||
| AMAT / Applied Materials, Inc. | 0.02 | 0.00 | 0.7761 | 0.7761 | |||||
| OC / Owens Corning | 0.02 | 0.00 | 0.00 | 0.00 | 0.6066 | 0.0409 | |||
| NEE / NextEra Energy, Inc. | 0.04 | 0.00 | 0.00 | 0.00 | 0.5957 | 0.0402 | |||
| CFLT / Confluent, Inc. | 0.18 | 0.00 | 0.00 | 0.00 | 0.5809 | 0.0392 | |||
| 1XYL / Xylem Inc. | 0.03 | 0.00 | 0.5789 | 0.5789 | |||||
| AWK / American Water Works Company, Inc. | 0.02 | 0.00 | 0.00 | 0.00 | 0.5611 | 0.0379 | |||
| QGEN / Qiagen N.V. | 0.06 | 0.00 | 0.00 | 0.00 | 0.5543 | 0.0442 | |||
| ON / ON Semiconductor Corporation | 0.04 | 0.00 | 0.00 | 0.00 | 0.5423 | 0.0366 | |||
| COHR / Coherent Corp. | 0.03 | 0.00 | 0.00 | 0.00 | 0.5287 | 0.0357 | |||
| CRWD / CrowdStrike Holdings, Inc. | 0.01 | 0.00 | 0.00 | 0.00 | 0.5084 | 0.0343 | |||
| RSG / Republic Services, Inc. | 0.01 | 0.00 | 0.00 | 0.00 | 0.4638 | 0.0313 | |||
| MTZ / MasTec, Inc. | 0.02 | 0.00 | 0.00 | 0.00 | 0.4583 | 0.0309 | |||
| ANET / Arista Networks, Inc. | 0.01 | 0.00 | 0.00 | 0.00 | 0.4525 | 0.0305 | |||
| FSLR / First Solar, Inc. | 0.01 | 0.00 | 0.00 | 0.00 | 0.2358 | 0.0159 | |||
| CSL / Carlisle Companies Incorporated | 0.00 | 0.00 | 0.00 | 0.00 | 0.2168 | 0.0146 | |||
| ALAB / Astera Labs, Inc. | 0.02 | 0.00 | 0.00 | 0.1569 | 0.0106 | ||||
| DDOG / Datadog, Inc. | 0.01 | 0.00 | 0.00 | 0.1273 | 0.0086 | ||||
| WFG / West Fraser Timber Co. Ltd. | 0.01 | 0.00 | 0.00 | 0.1017 | 0.0055 | ||||
| DLR / Digital Realty Trust, Inc. | 0.50 | 0.00 | 0.00 | 0.0787 | 0.0062 | ||||
| BABA / Alibaba Group Holding Limited - Depositary Receipt (Common Stock) | 0.00 | 0.00 | 0.0489 | 0.0489 | |||||
| TAN / Invesco Exchange-Traded Fund Trust II - Invesco Solar ETF | 0.01 | 0.00 | 0.00 | 0.0454 | 0.0031 | ||||
| CQQQ / Invesco Exchange-Traded Fund Trust II - Invesco China Technology ETF | 0.01 | 0.00 | 0.00 | 0.0388 | 0.0026 | ||||
| BIDU / Baidu, Inc. - Depositary Receipt (Common Stock) | 0.00 | 0.00 | 0.0103 | 0.0103 | |||||
| AMZN / Amazon.com, Inc. | 0.00 | 0.00 | 0.00 | 0.0095 | 0.0006 | ||||
| NXT / Nextpower Inc. | 0.00 | 0.00 | 0.00 | 0.0010 | 0.0001 | ||||
| RUN / Sunrun Inc. | 0.00 | 0.00 | 0.0005 | 0.0005 | |||||
| AYI / Acuity Inc. | 0.00 | -100.00 | 0.00 | -100.00 | -0.3211 | ||||
| CYBR / CyberArk Software Ltd. | 0.00 | -100.00 | 0.00 | -100.00 | -1.9761 | ||||
| VRT / Vertiv Holdings Co | 0.00 | -100.00 | 0.00 | -100.00 | -1.1969 | ||||
| PGR / The Progressive Corporation | 0.00 | -100.00 | 0.00 | 0.0000 | |||||
| MDB / MongoDB, Inc. | 0.00 | -100.00 | 0.00 | 0.0000 | |||||
| AVGO / Broadcom Inc. | 0.00 | -100.00 | 0.00 | -100.00 | -2.8793 | ||||
| PCOR / Procore Technologies, Inc. | 0.00 | -100.00 | 0.00 | 0.0000 | |||||
| ISRG / Intuitive Surgical, Inc. | 0.00 | -100.00 | 0.00 | -100.00 | -1.4299 |