Estatísticas Básicas
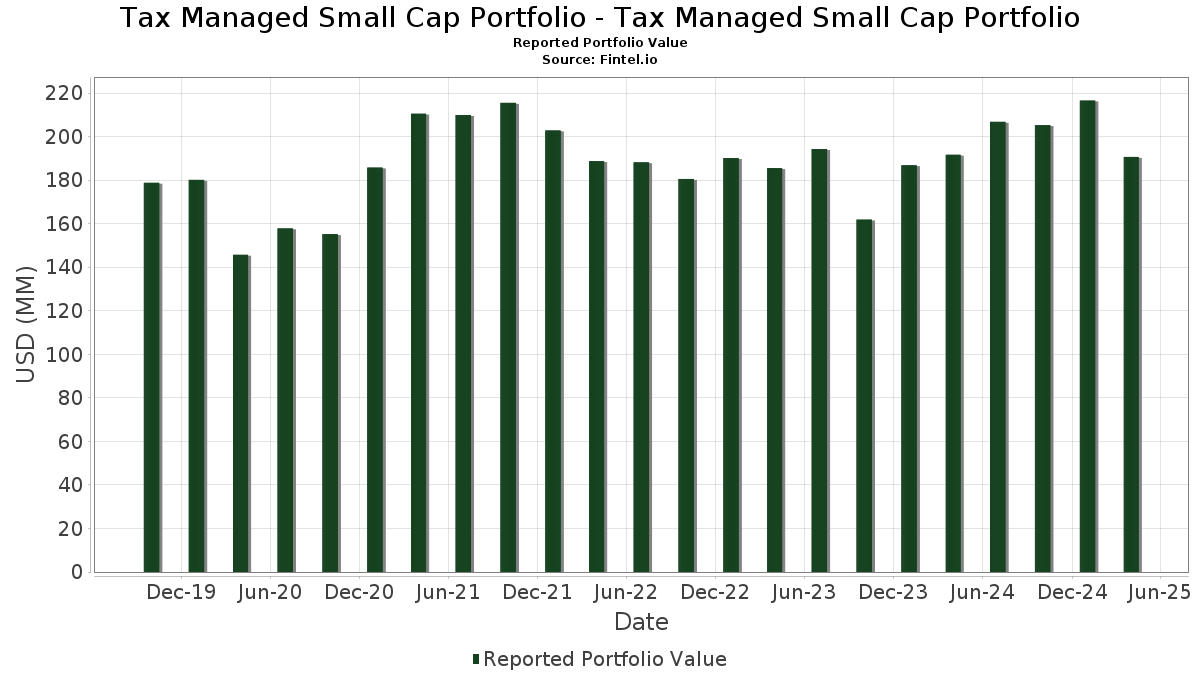
| Valor do Portfólio | $ 194,379,535 |
| Posições Atuais | 69 |
Últimas Participações, Desempenho, AUM (de 13F, 13D)
Tax Managed Small Cap Portfolio - Tax Managed Small Cap Portfolio divulgou 69 participações totais em seus últimos arquivamentos da SEC. O valor mais recente da carteira é calculado como $ 194,379,535 USD. O Ativo Total Sob Gestão (AUM) é esse valor mais o caixa (que não é divulgado). As principais posições de Tax Managed Small Cap Portfolio - Tax Managed Small Cap Portfolio são Commerce Bancshares, Inc. (US:CBSH) , AptarGroup, Inc. (US:ATR) , Aramark (US:ARMK) , SouthState Bank Corporation (US:SSB) , and White Mountains Insurance Group, Ltd. (US:WTM) . As novas posições de Tax Managed Small Cap Portfolio - Tax Managed Small Cap Portfolio incluem The Descartes Systems Group Inc. (US:DSGX) , Post Holdings, Inc. (US:POST) , Caris Life Sciences, Inc. (US:CAI) , .
Maiores Aumentos Este Trimestre
Usamos a mudança na alocação do portfólio porque esta é a métrica mais significativa. As mudanças podem ser devido a operações ou mudanças nos preços das ações.
| Ativo | Ações (MM) |
Valor (MM$) |
% do Portfólio | Δ% do Portfólio |
|---|---|---|---|---|
| 0.02 | 1.95 | 1.0026 | 1.0026 | |
| 0.06 | 4.24 | 2.1827 | 0.9181 | |
| 0.02 | 1.59 | 0.8189 | 0.8189 | |
| 0.02 | 2.84 | 1.4644 | 0.5960 | |
| 0.04 | 2.63 | 1.3542 | 0.5295 | |
| 0.04 | 1.00 | 0.5135 | 0.5135 | |
| 0.04 | 3.86 | 1.9891 | 0.5033 | |
| 0.06 | 1.64 | 0.8420 | 0.4964 | |
| 0.11 | 4.57 | 2.3545 | 0.4863 | |
| 0.05 | 2.62 | 1.3505 | 0.4582 |
Maiores Diminuições Este Trimestre
Usamos a mudança na alocação do portfólio porque esta é a métrica mais significativa. As mudanças podem ser devido a operações ou mudanças nos preços das ações.
| Ativo | Ações (MM) |
Valor (MM$) |
% do Portfólio | Δ% do Portfólio |
|---|---|---|---|---|
| 0.07 | 4.14 | 2.1296 | -0.5524 | |
| 0.05 | 1.42 | 0.7315 | -0.4149 | |
| 0.00 | 0.00 | -0.4064 | ||
| 0.01 | 1.60 | 0.8240 | -0.3701 | |
| 0.04 | 3.00 | 1.5441 | -0.3269 | |
| 0.01 | 3.92 | 2.0156 | -0.2946 | |
| 0.01 | 1.80 | 0.9283 | -0.2852 | |
| 0.07 | 4.41 | 2.2722 | -0.2849 | |
| 0.10 | 2.97 | 1.5269 | -0.2833 | |
| 0.00 | 2.04 | 1.0506 | -0.2286 |
Arquivamentos 13F e Fundo
Este formulário foi arquivado em 2025-09-26 para o período de relatório 2025-07-31. Clique no ícone de link para ver o histórico completo da transação.
Atualize para desbloquear dados premium e exportar para Excel ![]() .
.
| Ativo | Tipo | Preço Médio por Ação | Ações (MM) |
ΔAções (%) |
Valor ($MM) |
ΔAções (%) |
Portfólio (%) |
ΔPortfólio (%) |
|
|---|---|---|---|---|---|---|---|---|---|
| CBSH / Commerce Bancshares, Inc. | 0.10 | 1.07 | 6.03 | 1.84 | 3.1059 | -0.0034 | |||
| ATR / AptarGroup, Inc. | 0.04 | 0.93 | 5.73 | 5.76 | 2.9479 | 0.1063 | |||
| ARMK / Aramark | 0.11 | 0.93 | 4.57 | 28.52 | 2.3545 | 0.4863 | |||
| SSB / SouthState Bank Corporation | 0.05 | 3.89 | 4.50 | 12.74 | 2.3145 | 0.2213 | |||
| WTM / White Mountains Insurance Group, Ltd. | 0.00 | 3.89 | 4.48 | 5.09 | 2.3081 | 0.0689 | |||
| EPRT / Essential Properties Realty Trust, Inc. | 0.15 | 0.86 | 4.46 | -4.42 | 2.2942 | -0.1526 | |||
| CBZ / CBIZ, Inc. | 0.07 | 0.94 | 4.41 | -9.40 | 2.2722 | -0.2849 | |||
| WH / Wyndham Hotels & Resorts, Inc. | 0.05 | -4.32 | 4.37 | -3.53 | 2.2508 | -0.1281 | |||
| CBU / Community Financial System, Inc. | 0.08 | 26.54 | 4.36 | 22.15 | 2.2433 | 0.3711 | |||
| DCI / Donaldson Company, Inc. | 0.06 | 60.71 | 4.24 | 76.01 | 2.1827 | 0.9181 | |||
| VVV / Valvoline Inc. | 0.12 | 17.59 | 4.19 | 20.99 | 2.1575 | 0.3395 | |||
| ESE / ESCO Technologies Inc. | 0.02 | 0.00 | 4.19 | 23.80 | 2.1561 | 0.3806 | |||
| SF / Stifel Financial Corp. | 0.04 | -19.16 | 4.16 | 7.68 | 2.1435 | 0.1138 | |||
| CNM / Core & Main, Inc. | 0.07 | -32.99 | 4.14 | -19.04 | 2.1296 | -0.5524 | |||
| DORM / Dorman Products, Inc. | 0.03 | 3.79 | 4.10 | 10.50 | 2.1082 | 0.1631 | |||
| IDA / IDACORP, Inc. | 0.03 | 0.87 | 4.02 | 7.06 | 2.0679 | 0.0986 | |||
| CHE / Chemed Corporation | 0.01 | 25.46 | 3.92 | -11.06 | 2.0156 | -0.2946 | |||
| FFIN / First Financial Bankshares, Inc. | 0.11 | 3.65 | 3.90 | 7.11 | 2.0086 | 0.0962 | |||
| USPH / U.S. Physical Therapy, Inc. | 0.05 | 26.43 | 3.90 | 30.09 | 2.0077 | 0.4339 | |||
| FELE / Franklin Electric Co., Inc. | 0.04 | 23.43 | 3.86 | 36.49 | 1.9891 | 0.5033 | |||
| RLI / RLI Corp. | 0.06 | 4.22 | 3.73 | -7.09 | 1.9225 | -0.1868 | |||
| CSW / CSW Industrials, Inc. | 0.01 | 55.29 | 3.73 | 28.95 | 1.9193 | 0.4018 | |||
| EGP / EastGroup Properties, Inc. | 0.02 | 0.00 | 3.43 | -0.12 | 1.7680 | -0.0365 | |||
| US61747C7074 / Morgan Stanley Institutional Liquidity Funds Government Portfolio, Institutional Class | 3.37 | -4.84 | 3.37 | -4.82 | 1.7369 | -0.1239 | |||
| BMI / Badger Meter, Inc. | 0.02 | 12.34 | 3.36 | -3.97 | 1.7317 | -0.1069 | |||
| AOS / A. O. Smith Corporation | 0.05 | 3.77 | 3.27 | 8.28 | 1.6822 | 0.0979 | |||
| CNS / Cohen & Steers, Inc. | 0.04 | 0.94 | 3.26 | -2.71 | 1.6790 | -0.0805 | |||
| MIDD / The Middleby Corporation | 0.02 | -9.89 | 3.03 | -1.88 | 1.5589 | -0.0609 | |||
| AAON / AAON, Inc. | 0.04 | -8.03 | 3.00 | -15.88 | 1.5441 | -0.3269 | |||
| HAYW / Hayward Holdings, Inc. | 0.19 | 1.18 | 2.99 | 16.74 | 1.5404 | 0.1952 | |||
| OPCH / Option Care Health, Inc. | 0.10 | -5.33 | 2.97 | -14.00 | 1.5269 | -0.2833 | |||
| ATMU / Atmus Filtration Technologies Inc. | 0.08 | 5.67 | 2.96 | 18.57 | 1.5219 | 0.2135 | |||
| CCCS / CCC Intelligent Solutions Holdings Inc. | 0.30 | 3.41 | 2.94 | 7.97 | 1.5144 | 0.0847 | |||
| KWR / Quaker Chemical Corporation | 0.02 | 59.18 | 2.84 | 71.95 | 1.4644 | 0.5960 | |||
| TRNO / Terreno Realty Corporation | 0.05 | 0.00 | 2.72 | -1.48 | 1.4018 | -0.0490 | |||
| ADUS / Addus HomeCare Corporation | 0.03 | 19.86 | 2.70 | 22.44 | 1.3873 | 0.2319 | |||
| AZZ / AZZ Inc. | 0.02 | 2.80 | 2.65 | 29.74 | 1.3633 | 0.2920 | |||
| HXL / Hexcel Corporation | 0.04 | 35.44 | 2.63 | 67.41 | 1.3542 | 0.5295 | |||
| DIOD / Diodes Incorporated | 0.05 | 20.02 | 2.62 | 54.29 | 1.3505 | 0.4582 | |||
| EEFT / Euronet Worldwide, Inc. | 0.02 | 0.92 | 2.35 | -1.01 | 1.2092 | -0.0365 | |||
| BCPC / Balchem Corporation | 0.02 | 3.87 | 2.34 | 1.13 | 1.2025 | -0.0094 | |||
| AGS / The Hour Glass Limited | 0.11 | 3.01 | 2.33 | 19.65 | 1.1977 | 0.1772 | |||
| BFAM / Bright Horizons Family Solutions Inc. | 0.02 | 3.33 | 2.30 | -6.82 | 1.1823 | -0.1113 | |||
| AIN / Albany International Corp. | 0.04 | 2.97 | 2.19 | -15.14 | 1.1280 | -0.2273 | |||
| WMS / Advanced Drainage Systems, Inc. | 0.02 | 6.22 | 2.12 | 7.44 | 1.0929 | 0.0555 | |||
| GPI / Group 1 Automotive, Inc. | 0.00 | -18.00 | 2.04 | -16.29 | 1.0506 | -0.2286 | |||
| DSGX / The Descartes Systems Group Inc. | 0.02 | 1.95 | 1.0026 | 1.0026 | |||||
| SYBT / Stock Yards Bancorp, Inc. | 0.03 | 0.14 | 1.91 | 2.86 | 0.9818 | 0.0085 | |||
| KMPR / Kemper Corporation | 0.03 | 2.74 | 1.87 | 7.02 | 0.9648 | 0.0458 | |||
| FAF / First American Financial Corporation | 0.03 | 1.90 | 1.86 | 0.60 | 0.9553 | -0.0126 | |||
| LSTR / Landstar System, Inc. | 0.01 | -21.55 | 1.80 | -22.02 | 0.9283 | -0.2852 | |||
| ALGM / Allegro MicroSystems, Inc. | 0.06 | -41.51 | 1.75 | -3.64 | 0.8989 | -0.0523 | |||
| NCNO / nCino, Inc. | 0.06 | 106.36 | 1.64 | 148.48 | 0.8420 | 0.4964 | |||
| ITGR / Integer Holdings Corporation | 0.01 | -18.10 | 1.60 | -29.67 | 0.8240 | -0.3701 | |||
| POST / Post Holdings, Inc. | 0.02 | 1.59 | 0.8189 | 0.8189 | |||||
| SIGI / Selective Insurance Group, Inc. | 0.02 | 0.00 | 1.58 | -10.61 | 0.8155 | -0.1147 | |||
| CWAN / Clearwater Analytics Holdings, Inc. | 0.08 | 0.95 | 1.56 | -10.05 | 0.8018 | -0.1071 | |||
| TMHC / Taylor Morrison Home Corporation | 0.02 | 3.48 | 1.47 | 6.98 | 0.7575 | 0.0355 | |||
| AMSF / AMERISAFE, Inc. | 0.03 | 0.94 | 1.46 | -2.74 | 0.7501 | -0.0365 | |||
| JW.A / John Wiley & Sons Inc. - Class A | 0.04 | 0.93 | 1.43 | -10.76 | 0.7351 | -0.1044 | |||
| LKQ / LKQ Corporation | 0.05 | -15.65 | 1.42 | -34.94 | 0.7315 | -0.4149 | |||
| OLED / Universal Display Corporation | 0.01 | 44.33 | 1.37 | 66.02 | 0.7043 | 0.2714 | |||
| SPSC / SPS Commerce, Inc. | 0.01 | 17.18 | 1.24 | -11.16 | 0.6398 | -0.0940 | |||
| CHEF / The Chefs' Warehouse, Inc. | 0.02 | -29.55 | 1.05 | -15.25 | 0.5408 | -0.1095 | |||
| MTH / Meritage Homes Corporation | 0.02 | 8.66 | 1.02 | 7.34 | 0.5275 | 0.0267 | |||
| CAI / Caris Life Sciences, Inc. | 0.04 | 1.00 | 0.5135 | 0.5135 | |||||
| NOVT / Novanta Inc. | 0.01 | 1.72 | 0.92 | 5.28 | 0.4725 | 0.0149 | |||
| CERT / Certara, Inc. | 0.08 | 1.26 | 0.80 | -28.16 | 0.4102 | -0.1716 | |||
| MZTI / The Marzetti Company | 0.00 | 0.00 | 0.69 | 9.08 | 0.3531 | 0.0234 | |||
| FRPT / Freshpet, Inc. | 0.00 | -100.00 | 0.00 | -100.00 | -0.4064 |