Estatísticas Básicas
| Valor do Portfólio | $ 1,304,170,259 |
| Posições Atuais | 100 |
Últimas Participações, Desempenho, AUM (de 13F, 13D)
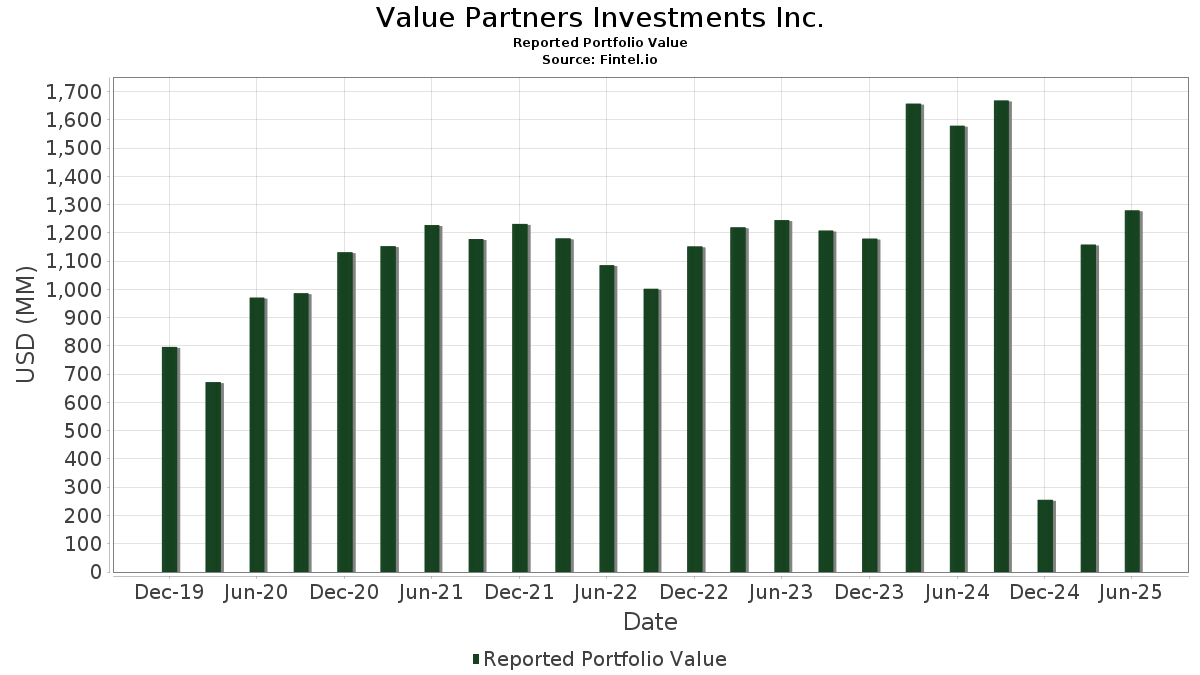
Value Partners Investments Inc. divulgou 100 participações totais em seus últimos arquivamentos da SEC. O valor mais recente da carteira é calculado como $ 1,304,170,259 USD. O Ativo Total Sob Gestão (AUM) é esse valor mais o caixa (que não é divulgado). As principais posições de Value Partners Investments Inc. são Alphabet Inc. (US:GOOGL) , The Bank of Nova Scotia (US:BNS) , Canadian Imperial Bank of Commerce (US:CM) , Sun Life Financial Inc. (US:SLF) , and Rogers Communications Inc. (US:RCI) . As novas posições de Value Partners Investments Inc. incluem Amphenol Corporation (US:APH) , Interactive Brokers Group, Inc. (US:IBKR) , Boyd Group Services Inc. (US:BGSI) , .
Maiores Aumentos Este Trimestre
Usamos a mudança na alocação do portfólio porque esta é a métrica mais significativa. As mudanças podem ser devido a operações ou mudanças nos preços das ações.
| Ativo | Ações (MM) |
Valor (MM$) |
% do Portfólio | Δ% do Portfólio |
|---|---|---|---|---|
| 0.18 | 47.67 | 3.6551 | 3.4837 | |
| 0.22 | 58.71 | 4.5017 | 0.8461 | |
| 0.27 | 85.81 | 6.5794 | 0.5490 | |
| 0.18 | 52.38 | 4.0163 | 0.5321 | |
| 1.52 | 55.23 | 4.2352 | 0.3706 | |
| 0.33 | 56.52 | 4.3338 | 0.3571 | |
| 1.08 | 57.90 | 4.4399 | 0.2528 | |
| 0.02 | 2.91 | 0.2229 | 0.2229 | |
| 0.04 | 2.70 | 0.2069 | 0.2069 | |
| 0.02 | 7.42 | 0.5688 | 0.1701 |
Maiores Diminuições Este Trimestre
Usamos a mudança na alocação do portfólio porque esta é a métrica mais significativa. As mudanças podem ser devido a operações ou mudanças nos preços das ações.
| Ativo | Ações (MM) |
Valor (MM$) |
% do Portfólio | Δ% do Portfólio |
|---|---|---|---|---|
| 1.86 | 60.58 | 4.6449 | -2.1438 | |
| 1.63 | 61.61 | 4.7239 | -1.6490 | |
| 0.47 | 60.52 | 4.6404 | -0.7968 | |
| 0.06 | 20.91 | 1.6036 | -0.4017 | |
| 0.08 | 40.84 | 3.1315 | -0.3827 | |
| 0.98 | 72.58 | 5.5649 | -0.3395 | |
| 0.52 | 38.13 | 2.9239 | -0.2103 | |
| 0.79 | 71.93 | 5.5155 | -0.1200 | |
| 0.02 | 6.76 | 0.5181 | -0.1126 | |
| 0.04 | 10.21 | 0.7832 | -0.1108 |
Arquivamentos 13F e Fundo
Este formulário foi arquivado em 2026-01-08 para o período de relatório 2025-12-31. Clique no ícone de link para ver o histórico completo da transação.
Atualize para desbloquear dados premium e exportar para Excel ![]() .
.
| Ativo | Tipo | Preço Médio por Ação | Ações (MM) |
ΔAções (%) |
Valor ($MM) |
ΔAções (%) |
Portfólio (%) |
ΔPortfólio (%) |
|
|---|---|---|---|---|---|---|---|---|---|
| GOOGL / Alphabet Inc. | 0.27 | -9.86 | 85.81 | 16.15 | 6.5794 | 0.5490 | |||
| BNS / The Bank of Nova Scotia | 0.98 | -12.19 | 72.58 | 0.33 | 5.5649 | -0.3395 | |||
| CM / Canadian Imperial Bank of Commerce | 0.79 | -8.32 | 71.93 | 4.19 | 5.5155 | -0.1200 | |||
| SLF / Sun Life Financial Inc. | 1.12 | 0.42 | 70.25 | 4.57 | 5.3868 | -0.0972 | |||
| RCI / Rogers Communications Inc. | 1.63 | -28.16 | 61.61 | -21.09 | 4.7239 | -1.6490 | |||
| OTEX / Open Text Corporation | 1.86 | -16.54 | 60.58 | -27.16 | 4.6449 | -2.1438 | |||
| BMO / Bank of Montreal | 0.47 | -8.99 | 60.52 | -9.15 | 4.6404 | -0.7968 | |||
| CNI / Canadian National Railway Company | 0.60 | 0.37 | 59.84 | 5.45 | 4.5882 | -0.0437 | |||
| CRM / Salesforce, Inc. | 0.22 | 17.20 | 58.71 | 31.09 | 4.5017 | 0.8461 | |||
| MGA / Magna International Inc. | 1.08 | 0.16 | 57.90 | 12.88 | 4.4399 | 0.2528 | |||
| RY / Royal Bank of Canada | 0.33 | 0.13 | 56.52 | 16.01 | 4.3338 | 0.3571 | |||
| MFC / Manulife Financial Corporation | 1.52 | -0.07 | 55.23 | 16.67 | 4.2352 | 0.3706 | |||
| FDX / FedEx Corporation | 0.18 | 0.10 | 52.38 | 22.71 | 4.0163 | 0.5321 | |||
| AMZN / Amazon.com, Inc. | 0.22 | 0.16 | 50.15 | 5.36 | 3.8451 | -0.0398 | |||
| ACN / Accenture plc | 0.18 | 1,984.79 | 47.67 | 2,169.95 | 3.6551 | 3.4837 | |||
| CVS / CVS Health Corporation | 0.55 | 0.42 | 43.75 | 5.79 | 3.3549 | -0.0212 | |||
| MSFT / Microsoft Corporation | 0.08 | 1.50 | 40.84 | -5.14 | 3.1315 | -0.3827 | |||
| CP / Canadian Pacific Kansas City Limited | 0.52 | 0.29 | 38.13 | -0.69 | 2.9239 | -0.2103 | |||
| HD / The Home Depot, Inc. | 0.06 | 0.17 | 20.91 | -14.87 | 1.6036 | -0.4017 | |||
| FMX / Fomento Económico Mexicano, S.A.B. de C.V. - Depositary Receipt (Common Stock) | 0.14 | 0.00 | 13.86 | 2.54 | 1.0627 | -0.0406 | |||
| YUMC / Yum China Holdings, Inc. | 0.24 | 4.41 | 11.30 | 16.21 | 0.8664 | 0.0727 | |||
| UBS / UBS Group AG | 0.24 | 0.00 | 11.12 | 13.02 | 0.8526 | 0.0495 | |||
| HDB / HDFC Bank Limited - Depositary Receipt (Common Stock) | 0.29 | 0.00 | 10.75 | 7.04 | 0.8241 | 0.0045 | |||
| SAP / SAP SE - Depositary Receipt (Common Stock) | 0.04 | 2.51 | 10.21 | -6.75 | 0.7832 | -0.1108 | |||
| MDT / Medtronic plc | 0.11 | 10.47 | 10.14 | 11.49 | 0.7775 | 0.0351 | |||
| RACE / Ferrari N.V. | 0.02 | 99.29 | 7.42 | 51.88 | 0.5688 | 0.1701 | |||
| UNH / UnitedHealth Group Incorporated | 0.02 | -8.63 | 6.76 | -12.54 | 0.5181 | -0.1126 | |||
| V / Visa Inc. | 0.02 | 4.93 | 6.13 | 8.00 | 0.4700 | 0.0067 | |||
| FTS / Fortis Inc. | 0.11 | 1.73 | 5.89 | 4.46 | 0.4513 | -0.0087 | |||
| TMO / Thermo Fisher Scientific Inc. | 0.01 | -7.57 | 5.60 | 10.63 | 0.4293 | 0.0162 | |||
| TDB / The Toronto-Dominion Bank | 0.05 | 1.09 | 4.65 | 19.35 | 0.3567 | 0.0386 | |||
| PEP / PepsiCo, Inc. | 0.03 | 0.00 | 4.60 | 2.25 | 0.3527 | -0.0145 | |||
| SPGI / S&P Global Inc. | 0.01 | 20.00 | 4.39 | 28.93 | 0.3366 | 0.0587 | |||
| TGT / Target Corporation | 0.04 | 0.00 | 4.30 | 9.05 | 0.3298 | 0.0078 | |||
| VZ / Verizon Communications Inc. | 0.10 | 24.33 | 4.16 | 15.29 | 0.3192 | 0.0245 | |||
| PFE / Pfizer Inc. | 0.16 | 0.38 | 4.10 | -1.84 | 0.3143 | -0.0266 | |||
| AMT / American Tower Corporation | 0.02 | 18.44 | 3.72 | 8.20 | 0.2854 | 0.0046 | |||
| DPZ / Domino's Pizza, Inc. | 0.01 | 0.82 | 3.47 | -2.47 | 0.2664 | -0.0244 | |||
| DEO / Diageo plc - Depositary Receipt (Common Stock) | 0.04 | 4.41 | 3.47 | -5.55 | 0.2660 | -0.0338 | |||
| MDLZ / Mondelez International, Inc. | 0.06 | 0.00 | 3.44 | -13.78 | 0.2639 | -0.0619 | |||
| GIS / General Mills, Inc. | 0.07 | 0.00 | 3.39 | -7.72 | 0.2603 | -0.0400 | |||
| CPB / The Campbell's Company | 0.12 | 0.00 | 3.26 | -11.70 | 0.2501 | -0.0514 | |||
| MA / Mastercard Incorporated | 0.01 | 0.09 | 3.25 | 0.65 | 0.2493 | -0.0144 | |||
| ODFL / Old Dominion Freight Line, Inc. | 0.02 | 38.71 | 3.16 | 54.78 | 0.2420 | 0.0756 | |||
| LLY / Eli Lilly and Company | 0.00 | -11.79 | 3.07 | 24.45 | 0.2358 | 0.0341 | |||
| AMAT / Applied Materials, Inc. | 0.01 | -23.99 | 2.94 | -4.42 | 0.2254 | -0.0256 | |||
| APH / Amphenol Corporation | 0.02 | 2.91 | 0.2229 | 0.2229 | |||||
| MCK / McKesson Corporation | 0.00 | 0.66 | 2.90 | 7.08 | 0.2225 | 0.0013 | |||
| WAB / Westinghouse Air Brake Technologies Corporation | 0.01 | 0.06 | 2.90 | 6.71 | 0.2221 | 0.0006 | |||
| MCO / Moody's Corporation | 0.01 | 1.13 | 2.84 | 8.60 | 0.2180 | 0.0043 | |||
| GE / General Electric Company | 0.01 | -14.39 | 2.78 | -12.18 | 0.2134 | -0.0453 | |||
| IBKR / Interactive Brokers Group, Inc. | 0.04 | 2.70 | 0.2069 | 0.2069 | |||||
| INTU / Intuit Inc. | 0.00 | 0.43 | 2.63 | -2.41 | 0.2016 | -0.0183 | |||
| AVGO / Broadcom Inc. | 0.01 | -23.20 | 2.61 | -19.29 | 0.2002 | -0.0638 | |||
| SHW / The Sherwin-Williams Company | 0.01 | 1.70 | 2.58 | -4.65 | 0.1980 | -0.0231 | |||
| MSCI / MSCI Inc. | 0.00 | 1.32 | 2.56 | 2.61 | 0.1961 | -0.0073 | |||
| CTAS / Cintas Corporation | 0.01 | 0.76 | 2.52 | -7.51 | 0.1936 | -0.0292 | |||
| CARR / Carrier Global Corporation | 0.05 | 41.18 | 2.52 | 25.17 | 0.1933 | 0.0289 | |||
| BRK.B / Berkshire Hathaway Inc. | 0.00 | 3.78 | 2.42 | 3.95 | 0.1855 | -0.0045 | |||
| BN / Brookfield Corporation | 0.05 | 56.47 | 2.35 | 4.87 | 0.1799 | -0.0027 | |||
| ENB / Enbridge Inc. | 0.05 | 0.73 | 2.27 | -4.30 | 0.1741 | -0.0195 | |||
| ICE / Intercontinental Exchange, Inc. | 0.01 | 7.07 | 2.14 | 3.13 | 0.1640 | -0.0053 | |||
| WPM / Wheaton Precious Metals Corp. | 0.02 | 3.77 | 2.07 | 9.17 | 0.1588 | 0.0040 | |||
| MRK / Merck & Co., Inc. | 0.02 | 5.38 | 1.78 | 32.41 | 0.1363 | 0.0267 | |||
| BIP / Brookfield Infrastructure Partners L.P. - Limited Partnership | 0.05 | 3.75 | 1.77 | 9.62 | 0.1356 | 0.0039 | |||
| TFII / TFI International Inc. | 0.02 | 5.36 | 1.76 | 24.03 | 0.1346 | 0.0190 | |||
| AME / AMETEK, Inc. | 0.01 | 4.79 | 1.70 | 14.67 | 0.1301 | 0.0093 | |||
| CNQ / Canadian Natural Resources Limited | 0.05 | 2.09 | 1.64 | 8.33 | 0.1257 | 0.0022 | |||
| NVS / Novartis AG - Depositary Receipt (Common Stock) | 0.01 | 18.91 | 1.52 | 28.08 | 0.1165 | 0.0196 | |||
| BGSI / Boyd Group Services Inc. | 0.01 | 1.47 | 0.1128 | 0.1128 | |||||
| DHR / Danaher Corporation | 0.01 | 21.85 | 1.47 | 40.88 | 0.1126 | 0.0275 | |||
| AON / Aon plc | 0.00 | 19.50 | 1.42 | 18.41 | 0.1085 | 0.0110 | |||
| UL / Unilever PLC - Depositary Receipt (Common Stock) | 0.02 | 1.30 | 0.0000 | ||||||
| HON / Honeywell International Inc. | 0.01 | 19.23 | 1.30 | 10.65 | 0.0996 | 0.0038 | |||
| CSCO / Cisco Systems, Inc. | 0.02 | 17.15 | 1.26 | 32.07 | 0.0963 | 0.0187 | |||
| TSM / Taiwan Semiconductor Manufacturing Company Limited - Depositary Receipt (Common Stock) | 0.00 | 4.57 | 1.18 | 13.97 | 0.0907 | 0.0060 | |||
| LIN / Linde plc | 0.00 | 47.94 | 1.10 | 32.85 | 0.0844 | 0.0168 | |||
| KLAC / KLA Corporation | 0.00 | 1.13 | 1.09 | 14.05 | 0.0835 | 0.0056 | |||
| BDX / Becton, Dickinson and Company | 0.01 | 18.02 | 1.09 | 22.55 | 0.0834 | 0.0109 | |||
| TSLA / Tesla, Inc. | 0.00 | 0.00 | 1.01 | 1.30 | 0.0777 | -0.0039 | |||
| AAPL / Apple Inc. | 0.00 | -13.23 | 1.00 | -7.15 | 0.0767 | -0.0113 | |||
| DE / Deere & Company | 0.00 | 18.09 | 0.97 | 20.50 | 0.0744 | 0.0086 | |||
| HEI / HEICO Corporation | 0.00 | 5.19 | 0.91 | 5.72 | 0.0695 | -0.0005 | |||
| VLTO / Veralto Corporation | 0.01 | 19.56 | 0.88 | 12.07 | 0.0677 | 0.0034 | |||
| TXN / Texas Instruments Incorporated | 0.00 | 6.99 | 0.87 | 1.17 | 0.0664 | -0.0034 | |||
| MEOH / Methanex Corporation | 0.02 | 4.90 | 0.83 | 4.82 | 0.0634 | -0.0010 | |||
| TRI / Thomson Reuters Corporation | 0.01 | 8.08 | 0.79 | -8.05 | 0.0605 | -0.0095 | |||
| BSY / Bentley Systems, Incorporated | 0.02 | 0.00 | 0.77 | -25.79 | 0.0592 | -0.0256 | |||
| LOW / Lowe's Companies, Inc. | 0.00 | -34.75 | 0.77 | -37.32 | 0.0588 | -0.0410 | |||
| ROP / Roper Technologies, Inc. | 0.00 | 7.03 | 0.62 | -4.29 | 0.0479 | -0.0054 | |||
| WM / Waste Management, Inc. | 0.00 | 51.90 | 0.58 | 51.17 | 0.0444 | 0.0132 | |||
| TRP / TC Energy Corporation | 0.01 | 4.60 | 0.57 | 6.20 | 0.0433 | -0.0001 | |||
| DSGX / The Descartes Systems Group Inc. | 0.01 | 7.56 | 0.56 | 0.36 | 0.0427 | -0.0026 | |||
| AQN / Algonquin Power & Utilities Corp. | 0.09 | 49.75 | 0.54 | 71.88 | 0.0413 | 0.0157 | |||
| META / Meta Platforms, Inc. | 0.00 | 6.94 | 0.52 | -3.71 | 0.0398 | -0.0042 | |||
| SU / Suncor Energy Inc. | 0.01 | 10.69 | 0.42 | 17.60 | 0.0323 | 0.0031 | |||
| IGSB / iShares Trust - iShares 1-5 Year Investment Grade Corporate Bond ETF | 0.01 | 0.00 | 0.36 | -0.28 | 0.0277 | -0.0018 | |||
| GOOG / Alphabet Inc. | 0.00 | 0.28 | 0.34 | 29.73 | 0.0258 | 0.0046 | |||
| IEI / iShares Trust - iShares 3-7 Year Treasury Bond ETF | 0.00 | 0.00 | 0.31 | 0.00 | 0.0239 | -0.0015 | |||
| TU / TELUS Corporation | 0.01 | -26.56 | 0.16 | -38.58 | 0.0120 | -0.0088 | |||
| GLD / SPDR Gold Shares | 0.00 | -100.00 | 0.00 | 0.0000 | |||||
| INFY / Infosys Limited - Depositary Receipt (Common Stock) | 0.00 | -100.00 | 0.00 | 0.0000 | |||||
| ZTS / Zoetis Inc. | 0.00 | -100.00 | 0.00 | 0.0000 | |||||
| UL / Unilever PLC - Depositary Receipt (Common Stock) | 0.00 | -100.00 | 0.00 | 0.0000 | |||||
| MMC / Marsh & McLennan Companies, Inc. | 0.00 | -100.00 | 0.00 | 0.0000 |