Estatísticas Básicas
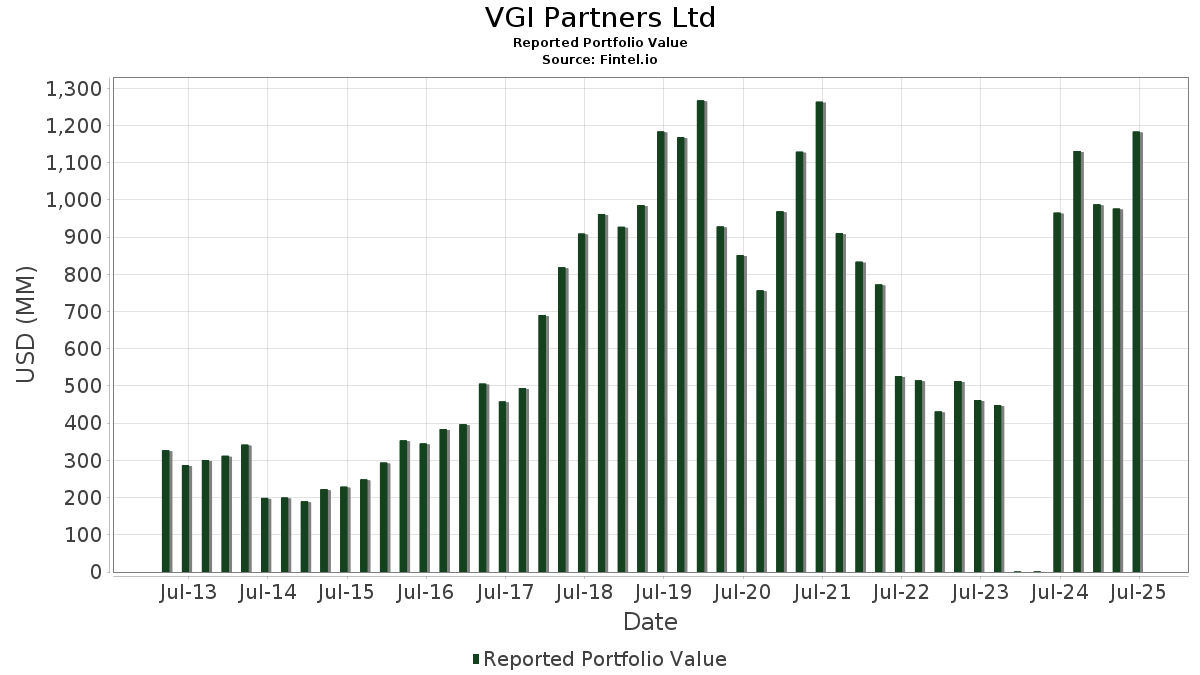
| Valor do Portfólio | $ 1,734,313,092 |
| Posições Atuais | 97 |
Últimas Participações, Desempenho, AUM (de 13F, 13D)
VGI Partners Ltd divulgou 97 participações totais em seus últimos arquivamentos da SEC. O valor mais recente da carteira é calculado como $ 1,734,313,092 USD. O Ativo Total Sob Gestão (AUM) é esse valor mais o caixa (que não é divulgado). As principais posições de VGI Partners Ltd são Newmont Corporation (US:NEM) , Teck Resources Limited (US:TECK) , Freeport-McMoRan Inc. (US:FCX) , Apollo Global Management, Inc. (US:APO) , and Bank of America Corporation (US:BAC) . As novas posições de VGI Partners Ltd incluem NANO Nuclear Energy Inc. (US:NNE) , Equinox Gold Corp. (US:EQX) , Hycroft Mining Holding Corporation (US:HYMC) , Taseko Mines Limited (US:TGB) , and Uranium Energy Corp. (US:UEC) .
Maiores Aumentos Este Trimestre
Usamos a mudança na alocação do portfólio porque esta é a métrica mais significativa. As mudanças podem ser devido a operações ou mudanças nos preços das ações.
| Ativo | Ações (MM) |
Valor (MM$) |
% do Portfólio | Δ% do Portfólio |
|---|---|---|---|---|
| NNE / NANO Nuclear Energy Inc. | 0.98 | 23.53 | 0.7136 | 0.7136 |
| GROY / Gold Royalty Corp. | 5.71 | 23.53 | 0.7136 | 0.7079 |
| HYMC / Hycroft Mining Holding Corporation | 0.31 | 7.48 | 0.4313 | 0.4313 |
| BTG / B2Gold Corp. | 1.37 | 6.18 | 0.3564 | 0.3564 |
| TGB / Taseko Mines Limited | 1.00 | 5.66 | 0.3264 | 0.3264 |
| UEC / Uranium Energy Corp. | 0.47 | 5.44 | 0.3137 | 0.3137 |
| EQX / Equinox Gold Corp. | 0.63 | 8.89 | 0.2697 | 0.2697 |
| ALB / Albemarle Corporation | 0.03 | 4.19 | 0.2414 | 0.2414 |
| BTU / Peabody Energy Corporation | 0.21 | 6.31 | 0.1913 | 0.1913 |
| CNR / Core Natural Resources, Inc. | 0.05 | 4.15 | 0.1258 | 0.1258 |
Maiores Diminuições Este Trimestre
Usamos a mudança na alocação do portfólio porque esta é a métrica mais significativa. As mudanças podem ser devido a operações ou mudanças nos preços das ações.
| Ativo | Ações (MM) |
Valor (MM$) |
% do Portfólio | Δ% do Portfólio |
|---|---|---|---|---|
| NEM / Newmont Corporation | 2.07 | 206.82 | 6.2712 | -7.1866 |
| TECK / Teck Resources Limited | 3.52 | 168.64 | 5.1134 | -5.8193 |
| WYNN / Wynn Resorts, Limited | 0.81 | 96.94 | 2.9395 | -4.4536 |
| BAC / Bank of America Corporation | 2.29 | 125.83 | 3.8153 | -3.6338 |
| SNY / Sanofi - Depositary Receipt (Common Stock) | 1.91 | 92.64 | 2.8090 | -2.7881 |
| WFC / Wells Fargo & Company | 0.60 | 56.35 | 1.7086 | -2.6080 |
| FCX / Freeport-McMoRan Inc. | 3.19 | 162.08 | 4.9147 | -1.9057 |
| TFC / Truist Financial Corporation | 0.92 | 45.17 | 1.3695 | -1.6325 |
| GOOG / Alphabet Inc. | 0.17 | 51.81 | 1.5711 | -1.5394 |
| AEM / Agnico Eagle Mines Limited | 0.09 | 14.77 | 0.4477 | -1.2494 |
Arquivamentos 13F e Fundo
Este formulário foi arquivado em 2026-02-18 para o período de relatório 2025-12-31. Clique no ícone de link para ver o histórico completo da transação.
Atualize para desbloquear dados premium e exportar para Excel ![]() .
.
| Ativo | Tipo | Preço Médio por Ação | Ações (MM) |
ΔAções (%) |
Valor ($MM) |
ΔValor (%) |
Portfólio (%) |
ΔPortfólio (%) |
|
|---|---|---|---|---|---|---|---|---|---|
| NEM / Newmont Corporation | 2.07 | -7.17 | 206.82 | 9.95 | 6.2712 | -7.1866 | |||
| TECK / Teck Resources Limited | 3.52 | 1.14 | 168.64 | 10.35 | 5.1134 | -5.8193 | |||
| FCX / Freeport-McMoRan Inc. | 3.19 | 31.28 | 162.08 | 70.01 | 4.9147 | -1.9057 | |||
| APO / Apollo Global Management, Inc. | 0.99 | 55.85 | 143.18 | 69.29 | 4.3416 | -0.6995 | |||
| BAC / Bank of America Corporation | 2.29 | 13.35 | 125.83 | 20.84 | 3.8153 | -3.6338 | |||
| RPRX / Royalty Pharma plc | 2.64 | 84.01 | 102.04 | 101.53 | 3.0939 | 0.0762 | |||
| WYNN / Wynn Resorts, Limited | 0.81 | 0.00 | 96.94 | -6.19 | 2.9395 | -4.4536 | |||
| SNY / Sanofi - Depositary Receipt (Common Stock) | 1.91 | 15.33 | 92.64 | 18.41 | 2.8090 | -2.7881 | |||
| UNP / Union Pacific Corporation | 0.27 | 132.29 | 62.84 | 127.32 | 1.9054 | -0.0722 | |||
| WFC / Wells Fargo & Company | 0.60 | -16.01 | 56.35 | -6.61 | 1.7086 | -2.6080 | |||
| GOOG / Alphabet Inc. | 0.17 | -22.94 | 51.81 | -0.71 | 1.5711 | -1.5394 | |||
| TFC / Truist Financial Corporation | 0.92 | 0.00 | 45.17 | 7.64 | 1.3695 | -1.6325 | |||
| B / Barrick Mining Corporation | 0.83 | 15.25 | 36.29 | 53.17 | 1.1004 | -0.5946 | |||
| CCJ / Cameco Corporation | 0.38 | -16.00 | 34.40 | -8.35 | 1.0430 | -1.1941 | |||
| NNE / NANO Nuclear Energy Inc. | 0.98 | 23.53 | 0.7136 | 0.7136 | |||||
| GROY / Gold Royalty Corp. | 5.71 | 22,977.82 | 23.53 | 24,672.63 | 0.7136 | 0.7079 | |||
| AMZN / Amazon.com, Inc. | 0.10 | 2.78 | 22.59 | 8.05 | 0.6849 | -0.8107 | |||
| KGC / Kinross Gold Corporation | 0.80 | -18.30 | 22.48 | -7.42 | 0.6817 | -1.0556 | |||
| INSP / Inspire Medical Systems, Inc. | 0.21 | 107.74 | 19.49 | 158.22 | 0.5909 | 0.0510 | |||
| GEHC / GE HealthCare Technologies Inc. | 0.23 | -13.97 | 18.65 | -6.04 | 0.5655 | -0.6175 | |||
| SCCO / Southern Copper Corporation | 0.11 | 73.03 | 15.51 | 104.56 | 0.4702 | 0.0184 | |||
| AEM / Agnico Eagle Mines Limited | 0.09 | -48.44 | 14.77 | -48.14 | 0.4477 | -1.2494 | |||
| TW / Tradeweb Markets Inc. | 0.11 | 11.98 | 11.37 | 8.51 | 0.3449 | -0.4050 | |||
| SII / Sprott Inc. | 0.10 | 3.93 | 10.07 | 22.32 | 0.3052 | -0.1852 | |||
| EQX / Equinox Gold Corp. | 0.63 | 8.89 | 0.2697 | 0.2697 | |||||
| HYMC / Hycroft Mining Holding Corporation | 0.31 | 7.48 | 0.4313 | 0.4313 | |||||
| CRM / Salesforce, Inc. | 0.03 | -0.42 | 7.24 | 11.31 | 0.2194 | -0.2457 | |||
| HBM / Hudbay Minerals Inc. | 0.34 | -47.04 | 6.75 | -30.66 | 0.2046 | -0.3755 | |||
| BTU / Peabody Energy Corporation | 0.21 | 6.31 | 0.1913 | 0.1913 | |||||
| BTG / B2Gold Corp. | 1.37 | 6.18 | 0.3564 | 0.3564 | |||||
| TGB / Taseko Mines Limited | 1.00 | 5.66 | 0.3264 | 0.3264 | |||||
| UEC / Uranium Energy Corp. | 0.47 | 5.44 | 0.3137 | 0.3137 | |||||
| IREN / IREN Limited | 0.14 | -0.70 | 5.34 | -20.09 | 0.1620 | -0.3163 | |||
| APP / AppLovin Corporation | 0.01 | 98.35 | 5.01 | 86.01 | 0.1520 | -0.0086 | |||
| ALB / Albemarle Corporation | 0.03 | 4.19 | 0.2414 | 0.2414 | |||||
| CNR / Core Natural Resources, Inc. | 0.05 | 4.15 | 0.1258 | 0.1258 | |||||
| XLF / The Select Sector SPDR Trust - State Street Financial Select Sector SPDR ETF | 0.07 | 3.80 | 0.1152 | 0.1152 | |||||
| META / Meta Platforms, Inc. | 0.01 | -5.16 | 3.78 | -14.77 | 0.1145 | -0.2024 | |||
| SEZL / Sezzle Inc. | 0.06 | 3.75 | 0.1137 | 0.1137 | |||||
| STLD / Steel Dynamics, Inc. | 0.02 | 3.70 | 0.1123 | 0.1123 | |||||
| HCC / Warrior Met Coal, Inc. | 0.04 | 3.66 | 0.1111 | 0.1111 | |||||
| NU / Nu Holdings Ltd. | 0.20 | 1,751.86 | 3.37 | 1,837.36 | 0.1022 | 0.0918 | |||
| DAVE / Dave Inc. | 0.02 | 184.87 | 3.32 | 216.59 | 0.1007 | 0.0381 | |||
| XLU / The Select Sector SPDR Trust - State Street Utilities Select Sector SPDR ETF | 0.08 | 3.32 | 0.1006 | 0.1006 | |||||
| NUE / Nucor Corporation | 0.02 | -12.71 | 3.15 | 5.11 | 0.0954 | -0.1187 | |||
| GDX / VanEck ETF Trust - VanEck Gold Miners ETF | 0.04 | 74.88 | 3.05 | 96.33 | 0.0925 | -0.0187 | |||
| VNOM / Viper Energy, Inc. | 0.08 | 36.20 | 2.90 | 37.99 | 0.0880 | -0.0625 | |||
| AA / Alcoa Corporation | 0.05 | -88.19 | 2.84 | -80.91 | 0.0860 | -0.9774 | |||
| CIFR / Cipher Digital Inc. | 0.18 | -24.69 | 2.66 | -11.73 | 0.0806 | -0.1347 | |||
| NWS / News Corporation | 0.09 | -57.18 | 2.52 | -63.29 | 0.0766 | -0.4154 | |||
| CVNA / Carvana Co. | 0.01 | 113.46 | 2.34 | 138.98 | 0.0710 | 0.0009 | |||
| GDXJ / VanEck ETF Trust - VanEck Junior Gold Miners ETF | 0.02 | 25.07 | 2.32 | 43.73 | 0.0703 | -0.0451 | |||
| DNN / Denison Mines Corp. | 0.83 | 2.22 | 0.0673 | 0.0673 | |||||
| LC / LendingClub Corporation | 0.11 | 2.11 | 0.0640 | 0.0640 | |||||
| FIX / Comfort Systems USA, Inc. | 0.00 | -0.90 | 2.05 | 12.12 | 0.0623 | -0.0688 | |||
| NXE / NexGen Energy Ltd. | 0.20 | 412.50 | 1.89 | 426.82 | 0.1087 | 0.0831 | |||
| XLI / The Select Sector SPDR Trust - State Street Industrial Select Sector SPDR ETF | 0.01 | 1.73 | 0.0525 | 0.0525 | |||||
| TKO / TKO Group Holdings, Inc. | 0.01 | 1.72 | 0.0522 | 0.0522 | |||||
| NTRA / Natera, Inc. | 0.01 | 1.72 | 0.0521 | 0.0521 | |||||
| HOOD / Robinhood Markets, Inc. | 0.01 | 58.21 | 1.54 | 25.06 | 0.0466 | -0.0267 | |||
| SOFI / SoFi Technologies, Inc. | 0.06 | 89.68 | 1.49 | 88.13 | 0.0452 | -0.0115 | |||
| LNT / Alliant Energy Corporation | 0.02 | 1.33 | 0.0404 | 0.0404 | |||||
| KRP / Kimbell Royalty Partners, LP - Limited Partnership | 0.11 | 1.33 | 0.0403 | 0.0403 | |||||
| PM / Philip Morris International Inc. | 0.01 | 1.27 | 0.0385 | 0.0385 | |||||
| FICO / Fair Isaac Corporation | 0.00 | 1.27 | 0.0384 | 0.0384 | |||||
| CVS / CVS Health Corporation | 0.02 | 1.21 | 0.0368 | 0.0368 | |||||
| HSAI / Hesai Group - Depositary Receipt (Common Stock) | 0.05 | -16.43 | 1.19 | -33.41 | 0.0362 | -0.0919 | |||
| RCL / Royal Caribbean Cruises Ltd. | 0.00 | 1.15 | 0.0349 | 0.0349 | |||||
| MHK / Mohawk Industries, Inc. | 0.01 | 1.15 | 0.0347 | 0.0347 | |||||
| DHR / Danaher Corporation | 0.00 | 1.10 | 0.0334 | 0.0334 | |||||
| APLD / Applied Digital Corporation | 0.04 | 26.86 | 1.09 | 35.66 | 0.0330 | -0.0148 | |||
| BKD / Brookdale Senior Living Inc. | 0.10 | 1.08 | 0.0327 | 0.0327 | |||||
| LGN / Legence Corp. | 0.03 | 1.08 | 0.0326 | 0.0326 | |||||
| GRAB / Grab Holdings Limited | 0.21 | 79.52 | 1.07 | 48.82 | 0.0617 | 0.0103 | |||
| TMDX / TransMedics Group, Inc. | 0.01 | 1.05 | 0.0317 | 0.0317 | |||||
| AMR / Alpha Metallurgical Resources, Inc. | 0.00 | 0.98 | 0.0296 | 0.0296 | |||||
| WGS / GeneDx Holdings Corp. | 0.01 | 180.00 | 0.91 | 238.29 | 0.0276 | 0.0116 | |||
| UBER / Uber Technologies, Inc. | 0.01 | -4.23 | 0.89 | -20.16 | 0.0270 | -0.0528 | |||
| HHH / Howard Hughes Holdings Inc. | 0.01 | 0.80 | 0.0242 | 0.0242 | |||||
| OR / OR Royalties Inc. | 0.02 | 0.00 | 0.67 | -11.70 | 0.0204 | -0.0341 | |||
| WWD / Woodward, Inc. | 0.00 | 0.60 | 0.0183 | 0.0183 | |||||
| FORM / FormFactor, Inc. | 0.01 | 0.56 | 0.0169 | 0.0169 | |||||
| RMBS / Rambus Inc. | 0.01 | 50.00 | 0.55 | 32.45 | 0.0167 | -0.0131 | |||
| TEM / Tempus AI, Inc. | 0.01 | 0.53 | 0.0161 | 0.0161 | |||||
| FSLR / First Solar, Inc. | 0.00 | 0.52 | 0.0158 | 0.0158 | |||||
| RADX / Radiopharm Theranostics Limited - Depositary Receipt (Common Stock) | 0.09 | 0.00 | 0.47 | -5.39 | 0.0144 | -0.0155 | |||
| NXDR / Nextdoor Holdings, Inc. | 0.22 | 79.76 | 0.47 | 80.46 | 0.0143 | -0.0044 | |||
| CLS / Celestica Inc. | 0.00 | 50.00 | 0.44 | 80.08 | 0.0134 | -0.0042 | |||
| RMD / ResMed Inc. | 0.00 | 38.46 | 0.43 | 21.97 | 0.0131 | -0.0081 | |||
| ZETA / Zeta Global Holdings Corp. | 0.02 | -60.00 | 0.41 | -59.01 | 0.0123 | -0.0587 | |||
| VRT / Vertiv Holdings Co | 0.00 | 0.00 | 0.41 | 7.43 | 0.0123 | -0.0147 | |||
| GRAL / GRAIL, Inc. | 0.00 | 0.34 | 0.0104 | 0.0104 | |||||
| NET / Cloudflare, Inc. | 0.00 | 0.30 | 0.0090 | 0.0090 | |||||
| CCLD / CareCloud, Inc. | 0.10 | 0.00 | 0.29 | -9.03 | 0.0089 | -0.0141 | |||
| APEI / American Public Education, Inc. | 0.01 | 0.00 | 0.28 | -4.15 | 0.0084 | -0.0123 | |||
| PODD / Insulet Corporation | 0.00 | 0.00 | 0.26 | -7.94 | 0.0078 | -0.0121 | |||
| SYM / Symbotic Inc. | 0.00 | -46.94 | 0.24 | -41.38 | 0.0072 | -0.0219 | |||
| CORZ / Core Scientific, Inc. | 0.00 | -100.00 | 0.00 | -100.00 | -0.3569 | ||||
| NBIS / Nebius Group N.V. | 0.00 | -100.00 | 0.00 | -100.00 | -0.0161 | ||||
| CRWV / CoreWeave, Inc. | 0.00 | -100.00 | 0.00 | 0.0000 | |||||
| TCOM / Trip.com Group Limited - Depositary Receipt (Common Stock) | 0.00 | -100.00 | 0.00 | 0.0000 | |||||
| MOB / Mobilicom Limited | 0.00 | -100.00 | 0.00 | 0.0000 | |||||
| OXY / Occidental Petroleum Corporation | 0.00 | -100.00 | 0.00 | 0.0000 | |||||
| ZONE / CleanCore Solutions, Inc. | 0.00 | -100.00 | 0.00 | -100.00 | -0.4335 | ||||
| IMG / IAMGOLD Corporation | 0.00 | -100.00 | 0.00 | 0.0000 | |||||
| BKKT / Bakkt, Inc. | 0.00 | -100.00 | 0.00 | 0.0000 | |||||
| OUST / Ouster, Inc. | 0.00 | -100.00 | 0.00 | 0.0000 | |||||
| OPT / Opthea Limited - Depositary Receipt (Common Stock) | 0.00 | -100.00 | 0.00 | 0.0000 | |||||
| LODE / Comstock Inc. | 0.00 | -100.00 | 0.00 | -100.00 | -0.2828 | ||||
| FUTU / Futu Holdings Limited - Depositary Receipt (Common Stock) | 0.00 | -100.00 | 0.00 | 0.0000 | |||||
| CPNG / Coupang, Inc. | 0.00 | -100.00 | 0.00 | 0.0000 | |||||
| NTES / NetEase, Inc. - Depositary Receipt (Common Stock) | 0.00 | -100.00 | 0.00 | 0.0000 | |||||
| ELD / Eldorado Gold Corporation | 0.00 | -100.00 | 0.00 | 0.0000 | |||||
| AZ / A2Z Cust2Mate Solutions Corp. | 0.00 | -100.00 | 0.00 | 0.0000 | |||||
| FLNG / FLEX LNG Ltd. | 0.00 | -100.00 | 0.00 | 0.0000 | |||||
| JD / JD.com, Inc. - Depositary Receipt (Common Stock) | 0.00 | -100.00 | 0.00 | 0.0000 | |||||
| LIF / Life360, Inc. | 0.00 | -100.00 | 0.00 | 0.0000 | |||||
| MTAL / MAC Copper Limited | 0.00 | -100.00 | 0.00 | 0.0000 | |||||
| FOXA / Fox Corporation | 0.00 | -100.00 | 0.00 | 0.0000 | |||||
| SLV / iShares Silver Trust | 0.00 | -100.00 | 0.00 | 0.0000 | |||||
| GLXY / Galaxy Digital Inc. | 0.00 | -100.00 | 0.00 | 0.0000 | |||||
| HUT / Hut 8 Corp. | 0.00 | -100.00 | 0.00 | -100.00 | -0.2362 | ||||
| BABA / Alibaba Group Holding Limited - Depositary Receipt (Common Stock) | 0.00 | -100.00 | 0.00 | 0.0000 | |||||
| MNSO / MINISO Group Holding Limited - Depositary Receipt (Common Stock) | 0.00 | -100.00 | 0.00 | 0.0000 | |||||
| LITS / Lite Strategy, Inc. | 0.00 | -100.00 | 0.00 | -100.00 | -0.0605 |