Estatísticas Básicas
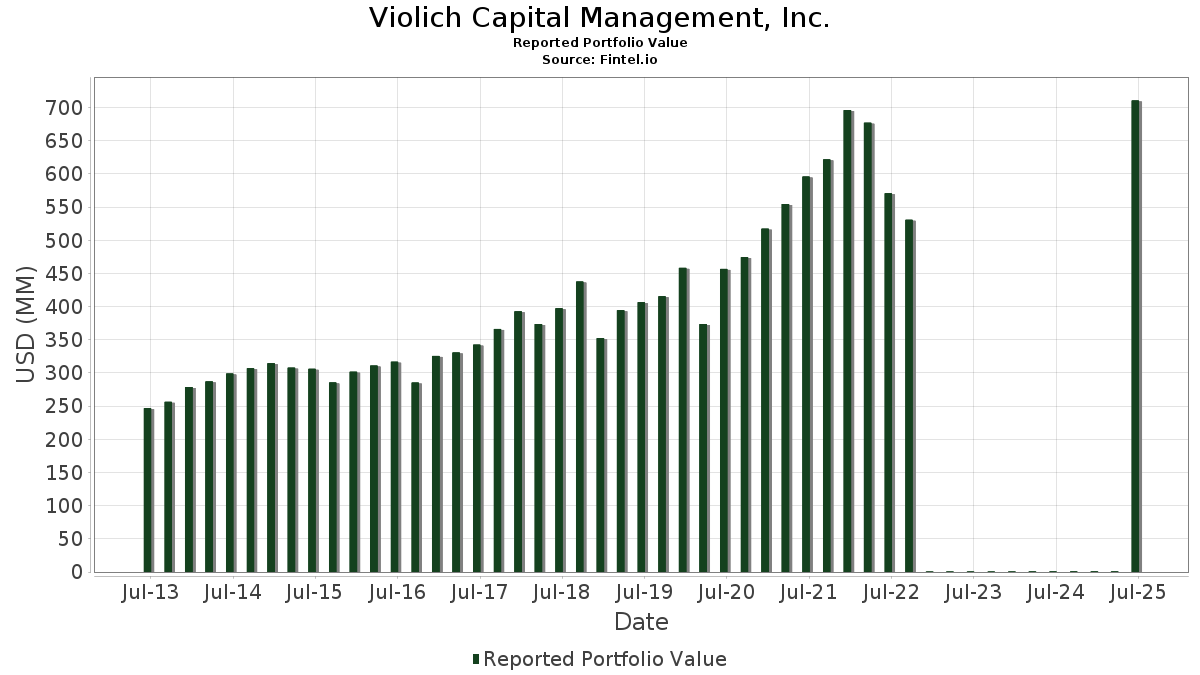
| Valor do Portfólio | $ 840,443,758 |
| Posições Atuais | 109 |
Últimas Participações, Desempenho, AUM (de 13F, 13D)
Violich Capital Management, Inc. divulgou 109 participações totais em seus últimos arquivamentos da SEC. O valor mais recente da carteira é calculado como $ 840,443,758 USD. O Ativo Total Sob Gestão (AUM) é esse valor mais o caixa (que não é divulgado). As principais posições de Violich Capital Management, Inc. são Microsoft Corporation (US:MSFT) , Alphabet Inc. (US:GOOG) , Alphabet Inc. (US:GOOGL) , Oracle Corporation (US:ORCL) , and Apple Inc. (US:AAPL) . As novas posições de Violich Capital Management, Inc. incluem Advanced Micro Devices, Inc. (US:AMD) , Resideo Technologies, Inc. (US:REZI) , ACM Research, Inc. (US:ACMR) , Cameco Corporation (US:CCJ) , and RTX Corporation (US:RTX) .
Maiores Aumentos Este Trimestre
Usamos a mudança na alocação do portfólio porque esta é a métrica mais significativa. As mudanças podem ser devido a operações ou mudanças nos preços das ações.
| Ativo | Ações (MM) |
Valor (MM$) |
% do Portfólio | Δ% do Portfólio |
|---|---|---|---|---|
| 0.34 | 82.17 | 9.7774 | 1.5508 | |
| 0.32 | 77.82 | 9.2598 | 1.5083 | |
| 0.02 | 10.11 | 1.2030 | 0.8931 | |
| 0.21 | 60.08 | 7.1488 | 0.7119 | |
| 0.11 | 25.56 | 3.0408 | 0.3205 | |
| 0.01 | 2.12 | 0.2522 | 0.2522 | |
| 0.04 | 7.08 | 0.8430 | 0.2351 | |
| 0.01 | 1.95 | 0.2320 | 0.2320 | |
| 0.10 | 13.42 | 1.5972 | 0.2240 | |
| 0.10 | 17.75 | 2.1121 | 0.2133 |
Maiores Diminuições Este Trimestre
Usamos a mudança na alocação do portfólio porque esta é a métrica mais significativa. As mudanças podem ser devido a operações ou mudanças nos preços das ações.
| Ativo | Ações (MM) |
Valor (MM$) |
% do Portfólio | Δ% do Portfólio |
|---|---|---|---|---|
| 0.05 | 45.44 | 5.4068 | -1.1338 | |
| 0.14 | 48.37 | 5.7550 | -0.9591 | |
| 0.18 | 91.81 | 10.9237 | -0.7158 | |
| 0.06 | 12.69 | 1.5104 | -0.3553 | |
| 0.03 | 8.46 | 1.0060 | -0.3260 | |
| 0.06 | 29.04 | 3.4552 | -0.2654 | |
| 0.27 | 12.74 | 1.5154 | -0.2261 | |
| 0.07 | 11.64 | 1.3848 | -0.2085 | |
| 0.02 | 7.49 | 0.8913 | -0.1784 | |
| 0.08 | 10.73 | 1.2766 | -0.1653 |
Arquivamentos 13F e Fundo
Este formulário foi arquivado em 2025-10-29 para o período de relatório 2025-09-30. Clique no ícone de link para ver o histórico completo da transação.
Atualize para desbloquear dados premium e exportar para Excel ![]() .
.
| Ativo | Tipo | Preço Médio por Ação | Ações (MM) |
ΔAções (%) |
Valor ($MM) |
ΔAções (%) |
Portfólio (%) |
ΔPortfólio (%) |
|
|---|---|---|---|---|---|---|---|---|---|
| MSFT / Microsoft Corporation | 0.18 | 6.59 | 91.81 | 11.00 | 10.9237 | -0.7158 | |||
| GOOG / Alphabet Inc. | 0.34 | 2.38 | 82.17 | 40.57 | 9.7774 | 1.5508 | |||
| GOOGL / Alphabet Inc. | 0.32 | 2.42 | 77.82 | 41.29 | 9.2598 | 1.5083 | |||
| ORCL / Oracle Corporation | 0.21 | 2.11 | 60.08 | 31.35 | 7.1488 | 0.7119 | |||
| AAPL / Apple Inc. | 0.21 | -3.93 | 54.41 | 19.23 | 6.4735 | 0.0519 | |||
| V / Visa Inc. | 0.14 | 5.43 | 48.37 | 1.37 | 5.7550 | -0.9591 | |||
| COST / Costco Wholesale Corporation | 0.05 | 4.56 | 45.44 | -2.23 | 5.4068 | -1.1338 | |||
| BRK.B / Berkshire Hathaway Inc. | 0.06 | 6.13 | 29.04 | 9.83 | 3.4552 | -0.2654 | |||
| ABBV / AbbVie Inc. | 0.11 | 5.98 | 25.56 | 32.20 | 3.0408 | 0.3205 | |||
| JNJ / Johnson & Johnson | 0.10 | 8.38 | 17.75 | 31.56 | 2.1121 | 0.2133 | |||
| GLD / SPDR Gold Shares | 0.05 | 5.16 | 17.03 | 22.63 | 2.0259 | 0.0721 | |||
| AMZN / Amazon.com, Inc. | 0.07 | 13.53 | 16.00 | 13.62 | 1.9032 | -0.0779 | |||
| LRCX / Lam Research Corporation | 0.10 | 0.00 | 13.42 | 37.56 | 1.5972 | 0.2240 | |||
| AMLP / ALPS ETF Trust - Alerian MLP ETF | 0.27 | 7.15 | 12.74 | 2.92 | 1.5154 | -0.2261 | |||
| HON / Honeywell International Inc. | 0.06 | 5.93 | 12.69 | -4.25 | 1.5104 | -0.3553 | |||
| PM / Philip Morris International Inc. | 0.07 | 15.43 | 11.64 | 2.79 | 1.3848 | -0.2085 | |||
| CVX / Chevron Corporation | 0.07 | 0.72 | 10.85 | 9.23 | 1.2915 | -0.1069 | |||
| BHP / BHP Group Limited - Depositary Receipt (Common Stock) | 0.19 | 4.90 | 10.75 | 21.60 | 1.2787 | 0.0351 | |||
| PEP / PepsiCo, Inc. | 0.08 | -1.56 | 10.73 | 4.70 | 1.2766 | -0.1653 | |||
| UNH / UnitedHealth Group Incorporated | 0.03 | 0.68 | 10.29 | 11.43 | 1.2243 | -0.0751 | |||
| VOO / Vanguard Index Funds - Vanguard S&P 500 ETF | 0.02 | 325.84 | 10.11 | 359.13 | 1.2030 | 0.8931 | |||
| UNP / Union Pacific Corporation | 0.04 | 5.64 | 8.52 | 8.53 | 1.0143 | -0.0911 | |||
| ACN / Accenture plc | 0.03 | 8.26 | 8.46 | -10.67 | 1.0060 | -0.3260 | |||
| AON / Aon plc | 0.02 | -1.41 | 7.49 | -1.45 | 0.8913 | -0.1784 | |||
| AEM / Agnico Eagle Mines Limited | 0.04 | 15.73 | 7.08 | 64.02 | 0.8430 | 0.2351 | |||
| ADP / Automatic Data Processing, Inc. | 0.02 | 3.83 | 7.04 | -1.18 | 0.8378 | -0.1650 | |||
| DHR / Danaher Corporation | 0.03 | 6.23 | 6.87 | 6.62 | 0.8169 | -0.0893 | |||
| VZ / Verizon Communications Inc. | 0.15 | -0.66 | 6.74 | 0.90 | 0.8015 | -0.1380 | |||
| JPM / JPMorgan Chase & Co. | 0.02 | 10.43 | 6.68 | 20.15 | 0.7947 | 0.0124 | |||
| AVGO / Broadcom Inc. | 0.02 | 0.00 | 5.97 | 19.68 | 0.7099 | 0.0084 | |||
| MRK / Merck & Co., Inc. | 0.07 | -8.39 | 5.87 | -2.86 | 0.6980 | -0.1519 | |||
| COP / ConocoPhillips | 0.06 | 5.92 | 5.50 | 11.63 | 0.6543 | -0.0388 | |||
| MA / Mastercard Incorporated | 0.01 | 3.30 | 5.35 | 4.56 | 0.6361 | -0.0834 | |||
| XOM / Exxon Mobil Corporation | 0.04 | 4.05 | 4.42 | 8.82 | 0.5256 | -0.0456 | |||
| CVS / CVS Health Corporation | 0.06 | 3.40 | 4.24 | 13.00 | 0.5047 | -0.0235 | |||
| GS / The Goldman Sachs Group, Inc. | 0.01 | 9.68 | 4.06 | 23.40 | 0.4832 | 0.0201 | |||
| NEE / NextEra Energy, Inc. | 0.05 | 0.00 | 4.01 | 8.77 | 0.4769 | -0.0418 | |||
| BDX / Becton, Dickinson and Company | 0.02 | 15.17 | 3.71 | 25.13 | 0.4415 | 0.0243 | |||
| NKE / NIKE, Inc. | 0.05 | -8.29 | 3.65 | -9.97 | 0.4340 | -0.1362 | |||
| META / Meta Platforms, Inc. | 0.00 | 6.25 | 3.56 | 5.74 | 0.4234 | -0.0503 | |||
| AMGN / Amgen Inc. | 0.01 | -1.72 | 3.22 | -0.65 | 0.3828 | -0.0730 | |||
| KO / The Coca-Cola Company | 0.05 | -0.21 | 3.08 | -6.46 | 0.3669 | -0.0970 | |||
| GJR / Strats Trust For Procter & Gambel Security - Preferred Security | 0.02 | 0.00 | 3.02 | -3.58 | 0.3591 | -0.0813 | |||
| DE / Deere & Company | 0.00 | -2.00 | 2.24 | -11.88 | 0.2666 | -0.0912 | |||
| KMB / Kimberly-Clark Corporation | 0.02 | -0.39 | 2.23 | -3.91 | 0.2659 | -0.0614 | |||
| SPY / SPDR S&P 500 ETF | 0.00 | 1.18 | 2.17 | 9.10 | 0.2584 | -0.0217 | |||
| AMD / Advanced Micro Devices, Inc. | 0.01 | 2.12 | 0.2522 | 0.2522 | |||||
| CPAY / Corpay, Inc. | 0.01 | 12.31 | 2.10 | -2.50 | 0.2502 | -0.0533 | |||
| SYK / Stryker Corporation | 0.01 | 1.95 | 0.2320 | 0.2320 | |||||
| ADBE / Adobe Inc. | 0.01 | 19.66 | 1.83 | 9.12 | 0.2179 | -0.0183 | |||
| DIS / The Walt Disney Company | 0.02 | -0.45 | 1.77 | -8.12 | 0.2102 | -0.0603 | |||
| VTWO / Vanguard Scottsdale Funds - Vanguard Russell 2000 ETF | 0.02 | -38.18 | 1.66 | -30.69 | 0.1979 | -0.1397 | |||
| SLV / iShares Silver Trust | 0.04 | 33.10 | 1.58 | 71.99 | 0.1885 | 0.0588 | |||
| CSCO / Cisco Systems, Inc. | 0.02 | 591.23 | 1.54 | 583.11 | 0.1829 | 0.1512 | |||
| IVV / iShares Trust - iShares Core S&P 500 ETF | 0.00 | 6.41 | 1.53 | 14.67 | 0.1824 | -0.0057 | |||
| CMCSA / Comcast Corporation | 0.05 | -4.53 | 1.44 | -15.96 | 0.1718 | -0.0699 | |||
| MCD / McDonald's Corporation | 0.00 | 0.17 | 1.44 | 4.19 | 0.1715 | -0.0232 | |||
| QQQ / Invesco QQQ Trust, Series 1 | 0.00 | 1.36 | 0.1616 | 0.1616 | |||||
| WMT / Walmart Inc. | 0.01 | 0.00 | 1.30 | 5.43 | 0.1548 | -0.0189 | |||
| PKB / Invesco Exchange-Traded Fund Trust - Invesco Building & Construction ETF | 0.01 | 0.00 | 1.19 | 4.41 | 0.1411 | -0.0188 | |||
| RIO / Rio Tinto Group - Depositary Receipt (Common Stock) | 0.02 | -5.32 | 1.17 | 7.12 | 0.1398 | -0.0145 | |||
| DELL / Dell Technologies Inc. | 0.01 | 10.04 | 1.12 | 27.33 | 0.1331 | 0.0094 | |||
| DUK / Duke Energy Corporation | 0.01 | 0.00 | 1.09 | 4.89 | 0.1301 | -0.0166 | |||
| QUAL / iShares Trust - iShares MSCI USA Quality Factor ETF | 0.01 | 0.73 | 1.08 | 7.16 | 0.1282 | -0.0133 | |||
| FDX / FedEx Corporation | 0.00 | -18.48 | 1.07 | -15.43 | 0.1279 | -0.0510 | |||
| SLB / SLB N.V. | 0.03 | -7.18 | 0.93 | -5.57 | 0.1110 | -0.0281 | |||
| CAT / Caterpillar Inc. | 0.00 | 0.00 | 0.86 | 22.92 | 0.1022 | 0.0039 | |||
| PFE / Pfizer Inc. | 0.03 | 0.00 | 0.79 | 5.05 | 0.0941 | -0.0118 | |||
| DT / Dynatrace, Inc. | 0.01 | 0.00 | 0.73 | -12.32 | 0.0865 | -0.0301 | |||
| LIN / Linde plc | 0.00 | 0.00 | 0.67 | 1.36 | 0.0800 | -0.0135 | |||
| VLTO / Veralto Corporation | 0.01 | 13.88 | 0.58 | 20.41 | 0.0695 | 0.0012 | |||
| PANW / Palo Alto Networks, Inc. | 0.00 | 0.58 | 0.0690 | 0.0690 | |||||
| NVS / Novartis AG - Depositary Receipt (Common Stock) | 0.00 | -1.14 | 0.56 | 4.70 | 0.0663 | -0.0085 | |||
| KVUE / Kenvue Inc. | 0.03 | 12.03 | 0.55 | -13.11 | 0.0654 | -0.0237 | |||
| MMM / 3M Company | 0.00 | 0.00 | 0.55 | 1.86 | 0.0653 | -0.0105 | |||
| NVDA / NVIDIA Corporation | 0.00 | 17.87 | 0.55 | 39.19 | 0.0652 | 0.0098 | |||
| RGLD / Royal Gold, Inc. | 0.00 | 0.00 | 0.52 | 12.77 | 0.0621 | -0.0030 | |||
| TMO / Thermo Fisher Scientific Inc. | 0.00 | 3.86 | 0.51 | 24.45 | 0.0606 | 0.0029 | |||
| HD / The Home Depot, Inc. | 0.00 | 0.00 | 0.51 | 10.48 | 0.0603 | -0.0042 | |||
| EPD / Enterprise Products Partners L.P. - Limited Partnership | 0.02 | 0.00 | 0.48 | 0.84 | 0.0569 | -0.0098 | |||
| WDOFF / Wesdome Gold Mines Ltd. | 0.03 | 100.33 | 0.47 | 124.29 | 0.0561 | 0.0265 | |||
| BLK / BlackRock, Inc. | 0.00 | 0.00 | 0.47 | 11.22 | 0.0555 | -0.0036 | |||
| NSRGY / Nestlé S.A. - Depositary Receipt (Common Stock) | 0.00 | 0.00 | 0.45 | -7.55 | 0.0539 | -0.0151 | |||
| CL / Colgate-Palmolive Company | 0.01 | 0.00 | 0.45 | -12.03 | 0.0531 | -0.0183 | |||
| SO / The Southern Company | 0.00 | 0.00 | 0.44 | 3.06 | 0.0522 | -0.0076 | |||
| FANG / Diamondback Energy, Inc. | 0.00 | 0.00 | 0.41 | 4.02 | 0.0494 | -0.0067 | |||
| NXE / NexGen Energy Ltd. | 0.05 | 0.00 | 0.41 | 28.89 | 0.0483 | 0.0040 | |||
| CI / The Cigna Group | 0.00 | 0.00 | 0.39 | -12.75 | 0.0464 | -0.0165 | |||
| PCAR / PACCAR Inc | 0.00 | 0.00 | 0.38 | 3.51 | 0.0456 | -0.0065 | |||
| SPGI / S&P Global Inc. | 0.00 | 0.00 | 0.37 | -7.59 | 0.0434 | -0.0122 | |||
| PCT / PureCycle Technologies, Inc. | 0.03 | 9.21 | 0.34 | 4.89 | 0.0408 | -0.0052 | |||
| AMT / American Tower Corporation | 0.00 | 0.32 | 0.0378 | 0.0378 | |||||
| HII / Huntington Ingalls Industries, Inc. | 0.00 | 1.47 | 0.30 | 20.73 | 0.0355 | 0.0008 | |||
| D / Dominion Energy, Inc. | 0.00 | 0.00 | 0.28 | 7.98 | 0.0339 | -0.0031 | |||
| DORM / Dorman Products, Inc. | 0.00 | 0.25 | 0.0293 | 0.0293 | |||||
| ACIW / ACI Worldwide, Inc. | 0.00 | 0.00 | 0.24 | 15.09 | 0.0290 | -0.0008 | |||
| AGI / Alamos Gold Inc. | 0.01 | 0.24 | 0.0290 | 0.0290 | |||||
| REZI / Resideo Technologies, Inc. | 0.01 | 0.24 | 0.0283 | 0.0283 | |||||
| BA / The Boeing Company | 0.00 | 0.00 | 0.24 | 3.04 | 0.0282 | -0.0042 | |||
| ACMR / ACM Research, Inc. | 0.01 | 0.23 | 0.0275 | 0.0275 | |||||
| SCHW / The Charles Schwab Corporation | 0.00 | 0.00 | 0.23 | 5.05 | 0.0273 | -0.0036 | |||
| CMA / Comerica Incorporated | 0.00 | 0.23 | 0.0272 | 0.0272 | |||||
| CCJ / Cameco Corporation | 0.00 | 0.23 | 0.0269 | 0.0269 | |||||
| MCHP / Microchip Technology Incorporated | 0.00 | 0.00 | 0.22 | -8.94 | 0.0267 | -0.0079 | |||
| VO / Vanguard Index Funds - Vanguard Mid-Cap ETF | 0.00 | 0.00 | 0.21 | 4.90 | 0.0255 | -0.0032 | |||
| WFC / Wells Fargo & Company | 0.00 | 0.00 | 0.21 | 4.50 | 0.0249 | -0.0033 | |||
| RTX / RTX Corporation | 0.00 | 0.21 | 0.0249 | 0.0249 | |||||
| GD / General Dynamics Corporation | 0.00 | 0.20 | 0.0241 | 0.0241 | |||||
| OVV / Ovintiv Inc. | 0.01 | 0.20 | 0.0240 | 0.0240 | |||||
| OKE / ONEOK, Inc. | 0.00 | -100.00 | 0.00 | 0.0000 | |||||
| THC / Tenet Healthcare Corporation | 0.00 | -100.00 | 0.00 | 0.0000 | |||||
| KD / Kyndryl Holdings, Inc. | 0.00 | -100.00 | 0.00 | 0.0000 |