Estatísticas Básicas
| Valor do Portfólio | $ 30,959,000 |
| Posições Atuais | 13 |
Últimas Participações, Desempenho, AUM (de 13F, 13D)
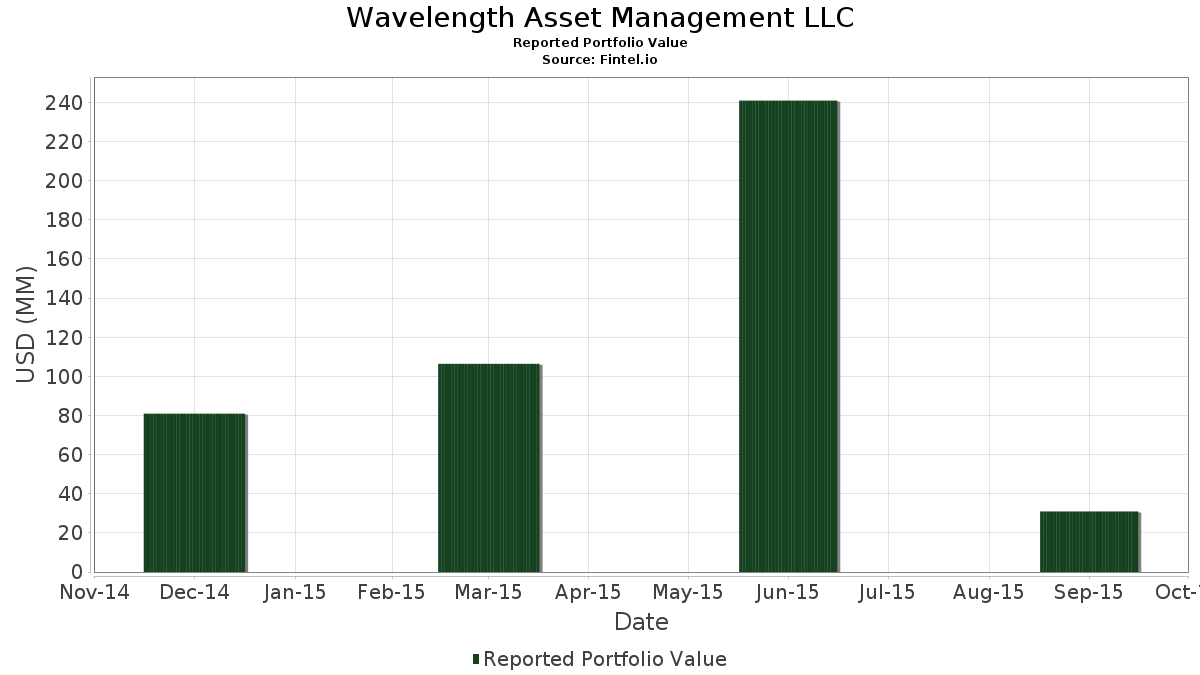
Wavelength Asset Management LLC divulgou 13 participações totais em seus últimos arquivamentos da SEC. O valor mais recente da carteira é calculado como $ 30,959,000 USD. O Ativo Total Sob Gestão (AUM) é esse valor mais o caixa (que não é divulgado). As principais posições de Wavelength Asset Management LLC são Altaba Inc (US:AABA) , Rackspace Hosting, Inc. (US:RAX) , SBA Communications Corporation (US:SBAC) , Gray Media, Inc. (US:GTN) , and Verizon Communications Inc. (US:VZ) . As novas posições de Wavelength Asset Management LLC incluem Verizon Communications Inc. (US:VZ) , RiskOn International, Inc. (US:ROI) , Nexstar Media Group, Inc. (US:NXST) , Media General, Inc. (US:58441K100) , and InterXion Holding N.V. (US:INXN) .
Maiores Aumentos Este Trimestre
Usamos a mudança na alocação do portfólio porque esta é a métrica mais significativa. As mudanças podem ser devido a operações ou mudanças nos preços das ações.
| Ativo | Ações (MM) |
Valor (MM$) |
% do Portfólio | Δ% do Portfólio |
|---|---|---|---|---|
| 0.34 | 4.28 | 13.8312 | 13.8312 | |
| 0.04 | 4.71 | 15.2137 | 13.6463 | |
| 0.20 | 4.99 | 16.1116 | 13.1648 | |
| 0.18 | 5.18 | 16.7253 | 8.3285 | |
| 0.06 | 2.44 | 7.8652 | 7.8652 | |
| 0.12 | 1.36 | 4.3864 | 4.3864 | |
| 0.11 | 1.08 | 3.4853 | 3.4853 | |
| 0.02 | 0.93 | 3.0137 | 3.0137 | |
| 0.00 | 0.56 | 1.8121 | 1.8121 | |
| 0.47 | 2.25 | 7.2677 | 0.5590 |
Maiores Diminuições Este Trimestre
Usamos a mudança na alocação do portfólio porque esta é a métrica mais significativa. As mudanças podem ser devido a operações ou mudanças nos preços das ações.
| Ativo | Ações (MM) |
Valor (MM$) |
% do Portfólio | Δ% do Portfólio |
|---|---|---|---|---|
| 0.00 | 0.00 | -7.0415 | ||
| 0.00 | 0.00 | -6.2157 | ||
| 0.00 | 0.00 | -5.5509 | ||
| 0.00 | 0.00 | -4.7823 | ||
| 0.00 | 0.00 | -4.6537 | ||
| 0.00 | 0.00 | -4.3835 | ||
| 0.00 | 0.00 | -3.7727 | ||
| 0.00 | 0.00 | -3.3959 | ||
| 0.00 | 0.00 | -2.9423 | ||
| 0.00 | 0.00 | -2.4007 |
Arquivamentos 13F e Fundo
Este formulário foi arquivado em 2015-11-05 para o período de relatório 2015-09-30. Clique no ícone de link para ver o histórico completo da transação.
Atualize para desbloquear dados premium e exportar para Excel ![]() .
.
| Ativo | Tipo | Preço Médio por Ação | Ações (MM) |
ΔAções (%) |
Valor ($MM) |
ΔAções (%) |
Portfólio (%) |
ΔPortfólio (%) |
|
|---|---|---|---|---|---|---|---|---|---|
| AABA / Altaba Inc | 0.18 | -65.22 | 5.18 | -74.41 | 16.7253 | 8.3285 | |||
| RAX / Rackspace Hosting, Inc. | 0.20 | 5.85 | 4.99 | -29.76 | 16.1116 | 13.1648 | |||
| SBAC / SBA Communications Corporation | 0.04 | 36.87 | 4.71 | 24.70 | 15.2137 | 13.6463 | |||
| GTN / Gray Media, Inc. | 0.34 | 4.28 | 13.8312 | 13.8312 | |||||
| VZ / Verizon Communications Inc. | 0.06 | 2.44 | 7.8652 | 7.8652 | |||||
| FTR / Frontier Communications Corp. | 0.47 | -85.50 | 2.25 | -86.08 | 7.2677 | 0.5590 | |||
| TTWO / Take-Two Interactive Software, Inc. | 0.07 | -89.12 | 1.91 | -88.66 | 6.1533 | -0.8173 | |||
| EHIC / eHi Car Services Ltd. | 0.12 | 1.36 | 4.3864 | 4.3864 | |||||
| SBGI / Sinclair, Inc. | 0.05 | -88.97 | 1.18 | -89.99 | 3.7953 | -1.0779 | |||
| ROI / RiskOn International, Inc. | 0.11 | 1.08 | 3.4853 | 3.4853 | |||||
| NXST / Nexstar Media Group, Inc. | 0.02 | 0.93 | 3.0137 | 3.0137 | |||||
| 58441K100 / Media General, Inc. | 0.00 | 0.56 | 1.8121 | 1.8121 | |||||
| INXN / InterXion Holding N.V. | 0.00 | 0.10 | 0.3392 | 0.3392 | |||||
| CVC / Cablevision Systems Corp. | 0.00 | -100.00 | 0.00 | -100.00 | -2.3555 | ||||
| THRY / Thryv Holdings, Inc. | 0.00 | -100.00 | 0.00 | -100.00 | -0.1212 | ||||
| T / AT&T Inc. | 0.00 | -100.00 | 0.00 | -100.00 | -4.6537 | ||||
| DLR / Digital Realty Trust, Inc. | 0.00 | -100.00 | 0.00 | -100.00 | -2.9423 | ||||
| QQQ / Invesco QQQ Trust, Series 1 | 0.00 | -100.00 | 0.00 | -100.00 | 0.0000 | ||||
| DFT / Dupont Fabros Technology, Inc. | 0.00 | -100.00 | 0.00 | -100.00 | -6.2157 | ||||
| CONE / CyrusOne Inc | 0.00 | -100.00 | 0.00 | -100.00 | -1.7081 | ||||
| CCOI / Cogent Communications Holdings, Inc. | 0.00 | -100.00 | 0.00 | -100.00 | -1.0736 | ||||
| DY / Dycom Industries, Inc. | 0.00 | -100.00 | 0.00 | -100.00 | -4.7823 | ||||
| CMCSA / Comcast Corporation | 0.00 | -100.00 | 0.00 | -100.00 | -3.3959 | ||||
| ZAYO / Zayo Group Holdings, Inc. | 0.00 | -100.00 | 0.00 | -100.00 | -1.6898 | ||||
| ZNGA / Zynga Inc - Class A | 0.00 | -100.00 | 0.00 | -100.00 | -0.4947 | ||||
| GRPN / Groupon, Inc. | 0.00 | -100.00 | 0.00 | -100.00 | -4.3835 | ||||
| LUMN / Lumen Technologies, Inc. | 0.00 | -100.00 | 0.00 | -100.00 | -2.4007 | ||||
| EQIX / Equinix, Inc. | 0.00 | -100.00 | 0.00 | -100.00 | -3.7727 | ||||
| EA / Electronic Arts Inc. | 0.00 | -100.00 | 0.00 | -100.00 | -5.5509 | ||||
| PUT S 07/17/15 4.50 SPRINT NEXTEL CORPORATION / Option (SS1715004) | 0.00 | -100.00 | 0.00 | 0.0000 | |||||
| PUT GSAT 07/17/15 2 GLOBALSTAR INC / Option (GSATS1715) | 0.00 | -100.00 | 0.00 | 0.0000 | |||||
| CALL TMUS 08/21/15 40 T MOBILE US INC / Option (TMUSH2115) | 0.00 | -100.00 | 0.00 | 0.0000 | |||||
| PUT TMUS 08/21/15 35 T MOBILE US INC / Option (TMUST2115) | 0.00 | -100.00 | 0.00 | 0.0000 | |||||
| DISH / DISH Network Corporation | 0.00 | -100.00 | 0.00 | -100.00 | -1.7205 | ||||
| AMT / American Tower Corporation | 0.00 | -100.00 | 0.00 | -100.00 | -0.6320 | ||||
| SPY / SPDR S&P 500 ETF | 0.00 | -100.00 | 0.00 | -100.00 | -7.0415 |