BridgeBio Pharma, Inc.
Introdução
Esta página fornece uma análise abrangente do histórico conhecido de negociações internas de Henry R Kravis. Insiders são oficiais, diretores ou investidores significativos em uma empresa. É ilegal para insiders realizarem negociações em suas próprias empresas baseados em informações específicas, não públicas. Isso não significa que seja ilegal para eles realizarem qualquer negociação em suas próprias empresas. No entanto, eles devem reportar todas as negociações à SEC através de um Formulário 4. Apesar dessas restrições, pesquisas acadêmicas sugerem que insiders - em geral - tendem a superar o mercado em suas próprias empresas.
Rentabilidade Média de Negociação
A rentabilidade média de negociação é o retorno médio de todas as compras de mercado abertas feitas pelo insider nos últimos três anos. Para calcular isso, examinamos cada compra de mercado aberto, não planejada, feita pelo insider, excluindo todas as negociações que foram marcadas como parte de um plano de negociação 10b5-1. Em seguida, calculamos o desempenho médio dessas negociações ao longo de 3, 6 e 12 meses, fazendo a média de cada uma dessas durações para gerar uma métrica de desempenho final para cada negociação. Finalmente, fazemos a média de todas as métricas de desempenho para calcular uma métrica de desempenho para o insider. Esta lista inclui apenas insiders que fizeram pelo menos três negociações nos últimos dois anos.
Se a rentabilidade de negociação deste insider é "N/A", então o insider ou não fez quaisquer compras de mercado aberto nos últimos três anos, ou as negociações que eles fizeram são muito recentes para calcular uma métrica de desempenho confiável.
Frequência de Atualização: Diariamente
Empresas com Posições Internas Reportadas
As declarações à SEC indicam que Henry R Kravis reportou posses ou negociações nas seguintes empresas:
Como Interpretar os Gráficos
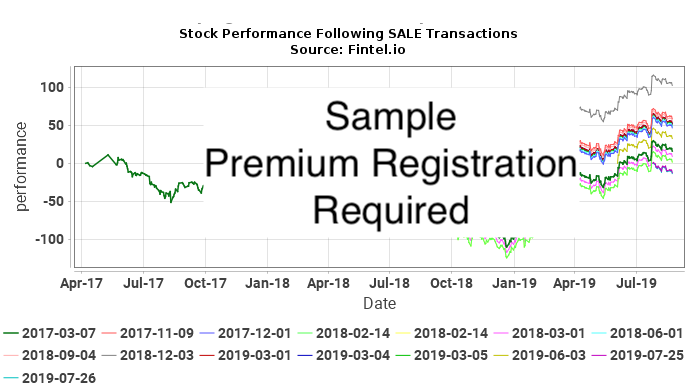
Os gráficos a seguir mostram o desempenho das ações dos a ativos ubsequentes a cada transação de mercado aberto, não planejada feita por Henry R Kravis. Transações não planejadas são negociações que não foram feitas como parte de um plano de negociação 10b5-1. O desempenho das ações é representado como mudança percentual cumulativa no preço das ações. Por exemplo, se uma transação interna foi feita em 1 de janeiro de 2019, o gráfico mostrará a mudança percentual diária da segurança até o dia presente. Se o preço da ação passasse de $10 para $15 durante este período, a mudança percentual cumulativa no preço das ações seria de 50%. Uma mudança no preço de $10 para $20 seria de 100%, e uma mudança no preço de $10 para $5 seria de -50%.
Ultimamente, estamos tentando determinar quão estreitamente as negociações do interno correlacionam-se a retornos excessivos (positivos ou negativos) no preço da ação para ver se o interno está cronometrando suas transações para lucrar com informações internas. Considere a situação onde um interno estava fazendo isso. Nesta situação, esperaríamos (a) retornos positivos após compras, ou (b) retornos negativos após vendas. No caso de (a), o gráfico de COMPRA mostraria uma série de curvas ascendentes, indicando retornos positivos após cada transação de compra. No caso de (b), o gráfico de VENDA mostraria uma série de curvas descendentes, indicando retornos negativos após cada transação de venda.
No entanto, isso sozinho não é suficiente para tirar conclusões. Se, por exemplo, o preço da ação da empresa estivesse em uma escalada não cíclica ao longo de muitos anos, então esperaríamos que todos os gráficos pós-compra tivessem uma inclinação ascendente. Da mesma forma, declínios não cíclicos ao longo de muitos anos resultariam em gráficos pós-negociação inclinados para baixo. Nenhum desses gráficos sugeriria atividade de negociação interna.
O indicador mais forte seria uma situação em que o preço da ação fosse extremamente cíclico, e houvesse sinais positivos no gráfico de COMPRA e gráficos negativos no gráfico de VENDA. Esta situação seria altamente sugestiva de um interno que estava cronometrando transações para sua vantagem financeira.
Compras Internas BBIO / BridgeBio Pharma, Inc. - Análise de Lucro de Curto Prazo
Nesta seção, analisamos a lucratividade de cada compra interna de mercado aberto, não planejada, feita em BBIO / BridgeBio Pharma, Inc.. Esta análise ajuda a entender se o interno gera consistentemente retornos anormais, e vale a pena seguir. Esta análise é para um ano seguinte a cada transação, e os resultados são teóricos.
A tabela a seguir mostra as compras de mercado aberto mais recentes que não faziam parte de um plano de negociação automático.
| Data de Negociação | Ticker | Insider | Ações Reportadas |
Preço Reportado |
Ações Ajustadas |
Preço Ajustado |
Base de Custos | Dias para Máx |
Preço em Máx |
Lucro Máx ($) |
Retorno Máx (%) |
|---|---|---|---|---|---|---|---|---|---|---|---|
| 2019-07-01 | BBIO | KKR Genetic Disorder L.P. | 2,647,100 | 17.0000 | 2,647,100 | 17.0000 | 45,000,700 | 175 | 46.63 | 78,433,573 | 174.29 |
O Preço Ajustado é o preço ajustado pela divisão. Ações Ajustadas são as ações ajustadas pela divisão.
Vendas Internas BBIO / BridgeBio Pharma, Inc. - Análise de Perda de Curto Prazo
Nesta seção, analisamos a evitação de perdas de curto prazo de cada venda interna de mercado aberto, não planejada feita em BBIO / BridgeBio Pharma, Inc.. Um padrão consistente de evitação de perdas pode sugerir que transações futuras de venda possam prever declínios no preço. Esta análise é para um ano seguinte a cada transação, e os resultados são teóricos.
A tabela a seguir mostra as vendas de mercado aberto mais recentes que não faziam parte de um plano de negociação automático.
O Preço Ajustado é o preço ajustado pela divisão. Ações Ajustadas são as ações ajustadas pela divisão.
Compras Internas BTSGU / BrightSpring Health Services, Inc. - Análise de Lucro de Curto Prazo
Nesta seção, analisamos a lucratividade de cada compra interna de mercado aberto, não planejada, feita em BBIO / BridgeBio Pharma, Inc.. Esta análise ajuda a entender se o interno gera consistentemente retornos anormais, e vale a pena seguir. Esta análise é para um ano seguinte a cada transação, e os resultados são teóricos.
A tabela a seguir mostra as compras de mercado aberto mais recentes que não faziam parte de um plano de negociação automático.
| Data de Negociação | Ticker | Insider | Ações Reportadas |
Preço Reportado |
Ações Ajustadas |
Preço Ajustado |
Base de Custos | Dias para Máx |
Preço em Máx |
Lucro Máx ($) |
Retorno Máx (%) |
|---|---|---|---|---|---|---|---|---|---|---|---|
| 2024-09-11 | BTSG | KKR Fund Holdings L.P. | 11,619,998 | 11.1300 | 11,619,998 | 11.1300 | 129,330,578 | 364 | 28.0800 | 196,958,967 | 152.29 |
O Preço Ajustado é o preço ajustado pela divisão. Ações Ajustadas são as ações ajustadas pela divisão.
Vendas Internas BTSGU / BrightSpring Health Services, Inc. - Análise de Perda de Curto Prazo
Nesta seção, analisamos a evitação de perdas de curto prazo de cada venda interna de mercado aberto, não planejada feita em BBIO / BridgeBio Pharma, Inc.. Um padrão consistente de evitação de perdas pode sugerir que transações futuras de venda possam prever declínios no preço. Esta análise é para um ano seguinte a cada transação, e os resultados são teóricos.
A tabela a seguir mostra as vendas de mercado aberto mais recentes que não faziam parte de um plano de negociação automático.
O Preço Ajustado é o preço ajustado pela divisão. Ações Ajustadas são as ações ajustadas pela divisão.
Compras Internas BV / BrightView Holdings, Inc. - Análise de Lucro de Curto Prazo
Nesta seção, analisamos a lucratividade de cada compra interna de mercado aberto, não planejada, feita em BBIO / BridgeBio Pharma, Inc.. Esta análise ajuda a entender se o interno gera consistentemente retornos anormais, e vale a pena seguir. Esta análise é para um ano seguinte a cada transação, e os resultados são teóricos.
A tabela a seguir mostra as compras de mercado aberto mais recentes que não faziam parte de um plano de negociação automático.
| Data de Negociação | Ticker | Insider | Ações Reportadas |
Preço Reportado |
Ações Ajustadas |
Preço Ajustado |
Base de Custos | Dias para Máx |
Preço em Máx |
Lucro Máx ($) |
Retorno Máx (%) |
|---|---|---|---|---|---|---|---|
| Não há negociações abertas de mercado não planejadas conhecidas para esta combinação de insider e ativo |
O Preço Ajustado é o preço ajustado pela divisão. Ações Ajustadas são as ações ajustadas pela divisão.
Vendas Internas BV / BrightView Holdings, Inc. - Análise de Perda de Curto Prazo
Nesta seção, analisamos a evitação de perdas de curto prazo de cada venda interna de mercado aberto, não planejada feita em BBIO / BridgeBio Pharma, Inc.. Um padrão consistente de evitação de perdas pode sugerir que transações futuras de venda possam prever declínios no preço. Esta análise é para um ano seguinte a cada transação, e os resultados são teóricos.
A tabela a seguir mostra as vendas de mercado aberto mais recentes que não faziam parte de um plano de negociação automático.
O Preço Ajustado é o preço ajustado pela divisão. Ações Ajustadas são as ações ajustadas pela divisão.
Compras Internas CHRS / Coherus Oncology, Inc. - Análise de Lucro de Curto Prazo
Nesta seção, analisamos a lucratividade de cada compra interna de mercado aberto, não planejada, feita em BBIO / BridgeBio Pharma, Inc.. Esta análise ajuda a entender se o interno gera consistentemente retornos anormais, e vale a pena seguir. Esta análise é para um ano seguinte a cada transação, e os resultados são teóricos.
A tabela a seguir mostra as compras de mercado aberto mais recentes que não faziam parte de um plano de negociação automático.
| Data de Negociação | Ticker | Insider | Ações Reportadas |
Preço Reportado |
Ações Ajustadas |
Preço Ajustado |
Base de Custos | Dias para Máx |
Preço em Máx |
Lucro Máx ($) |
Retorno Máx (%) |
|---|---|---|---|---|---|---|---|
| Não há negociações abertas de mercado não planejadas conhecidas para esta combinação de insider e ativo |
O Preço Ajustado é o preço ajustado pela divisão. Ações Ajustadas são as ações ajustadas pela divisão.
Vendas Internas CHRS / Coherus Oncology, Inc. - Análise de Perda de Curto Prazo
Nesta seção, analisamos a evitação de perdas de curto prazo de cada venda interna de mercado aberto, não planejada feita em BBIO / BridgeBio Pharma, Inc.. Um padrão consistente de evitação de perdas pode sugerir que transações futuras de venda possam prever declínios no preço. Esta análise é para um ano seguinte a cada transação, e os resultados são teóricos.
A tabela a seguir mostra as vendas de mercado aberto mais recentes que não faziam parte de um plano de negociação automático.
| Data de Negociação | Ticker | Insider | Ações Reportadas |
Preço Reportado |
Ações Ajustadas |
Preço Ajustado |
Base de Custos | Dias para Mín |
Preço em Mín |
Máxima Perda Evitada ($) |
Máxima Perda Evitada (%) |
|---|---|---|---|---|---|---|---|
| Não há negociações abertas de mercado não planejadas conhecidas para esta combinação de insider e ativo |
O Preço Ajustado é o preço ajustado pela divisão. Ações Ajustadas são as ações ajustadas pela divisão.
Compras Internas CRGY / Crescent Energy Company - Análise de Lucro de Curto Prazo
Nesta seção, analisamos a lucratividade de cada compra interna de mercado aberto, não planejada, feita em BBIO / BridgeBio Pharma, Inc.. Esta análise ajuda a entender se o interno gera consistentemente retornos anormais, e vale a pena seguir. Esta análise é para um ano seguinte a cada transação, e os resultados são teóricos.
A tabela a seguir mostra as compras de mercado aberto mais recentes que não faziam parte de um plano de negociação automático.
| Data de Negociação | Ticker | Insider | Ações Reportadas |
Preço Reportado |
Ações Ajustadas |
Preço Ajustado |
Base de Custos | Dias para Máx |
Preço em Máx |
Lucro Máx ($) |
Retorno Máx (%) |
|---|---|---|---|---|---|---|---|
| Não há negociações abertas de mercado não planejadas conhecidas para esta combinação de insider e ativo |
O Preço Ajustado é o preço ajustado pela divisão. Ações Ajustadas são as ações ajustadas pela divisão.
Vendas Internas CRGY / Crescent Energy Company - Análise de Perda de Curto Prazo
Nesta seção, analisamos a evitação de perdas de curto prazo de cada venda interna de mercado aberto, não planejada feita em BBIO / BridgeBio Pharma, Inc.. Um padrão consistente de evitação de perdas pode sugerir que transações futuras de venda possam prever declínios no preço. Esta análise é para um ano seguinte a cada transação, e os resultados são teóricos.
A tabela a seguir mostra as vendas de mercado aberto mais recentes que não faziam parte de um plano de negociação automático.
O Preço Ajustado é o preço ajustado pela divisão. Ações Ajustadas são as ações ajustadas pela divisão.
Compras Internas DZSIQ / DZS Inc. - Análise de Lucro de Curto Prazo
Nesta seção, analisamos a lucratividade de cada compra interna de mercado aberto, não planejada, feita em BBIO / BridgeBio Pharma, Inc.. Esta análise ajuda a entender se o interno gera consistentemente retornos anormais, e vale a pena seguir. Esta análise é para um ano seguinte a cada transação, e os resultados são teóricos.
A tabela a seguir mostra as compras de mercado aberto mais recentes que não faziam parte de um plano de negociação automático.
| Data de Negociação | Ticker | Insider | Ações Reportadas |
Preço Reportado |
Ações Ajustadas |
Preço Ajustado |
Base de Custos | Dias para Máx |
Preço em Máx |
Lucro Máx ($) |
Retorno Máx (%) |
|---|---|---|---|---|---|---|---|
| Não há negociações abertas de mercado não planejadas conhecidas para esta combinação de insider e ativo |
O Preço Ajustado é o preço ajustado pela divisão. Ações Ajustadas são as ações ajustadas pela divisão.
Vendas Internas DZSIQ / DZS Inc. - Análise de Perda de Curto Prazo
Nesta seção, analisamos a evitação de perdas de curto prazo de cada venda interna de mercado aberto, não planejada feita em BBIO / BridgeBio Pharma, Inc.. Um padrão consistente de evitação de perdas pode sugerir que transações futuras de venda possam prever declínios no preço. Esta análise é para um ano seguinte a cada transação, e os resultados são teóricos.
A tabela a seguir mostra as vendas de mercado aberto mais recentes que não faziam parte de um plano de negociação automático.
| Data de Negociação | Ticker | Insider | Ações Reportadas |
Preço Reportado |
Ações Ajustadas |
Preço Ajustado |
Base de Custos | Dias para Mín |
Preço em Mín |
Máxima Perda Evitada ($) |
Máxima Perda Evitada (%) |
|---|---|---|---|---|---|---|---|
| Não há negociações abertas de mercado não planejadas conhecidas para esta combinação de insider e ativo |
O Preço Ajustado é o preço ajustado pela divisão. Ações Ajustadas são as ações ajustadas pela divisão.
Compras Internas EYE / National Vision Holdings, Inc. - Análise de Lucro de Curto Prazo
Nesta seção, analisamos a lucratividade de cada compra interna de mercado aberto, não planejada, feita em BBIO / BridgeBio Pharma, Inc.. Esta análise ajuda a entender se o interno gera consistentemente retornos anormais, e vale a pena seguir. Esta análise é para um ano seguinte a cada transação, e os resultados são teóricos.
A tabela a seguir mostra as compras de mercado aberto mais recentes que não faziam parte de um plano de negociação automático.
| Data de Negociação | Ticker | Insider | Ações Reportadas |
Preço Reportado |
Ações Ajustadas |
Preço Ajustado |
Base de Custos | Dias para Máx |
Preço em Máx |
Lucro Máx ($) |
Retorno Máx (%) |
|---|---|---|---|---|---|---|---|
| Não há negociações abertas de mercado não planejadas conhecidas para esta combinação de insider e ativo |
O Preço Ajustado é o preço ajustado pela divisão. Ações Ajustadas são as ações ajustadas pela divisão.
Vendas Internas EYE / National Vision Holdings, Inc. - Análise de Perda de Curto Prazo
Nesta seção, analisamos a evitação de perdas de curto prazo de cada venda interna de mercado aberto, não planejada feita em BBIO / BridgeBio Pharma, Inc.. Um padrão consistente de evitação de perdas pode sugerir que transações futuras de venda possam prever declínios no preço. Esta análise é para um ano seguinte a cada transação, e os resultados são teóricos.
A tabela a seguir mostra as vendas de mercado aberto mais recentes que não faziam parte de um plano de negociação automático.
O Preço Ajustado é o preço ajustado pela divisão. Ações Ajustadas são as ações ajustadas pela divisão.
Compras Internas KRP / Kimbell Royalty Partners, LP - Limited Partnership - Análise de Lucro de Curto Prazo
Nesta seção, analisamos a lucratividade de cada compra interna de mercado aberto, não planejada, feita em BBIO / BridgeBio Pharma, Inc.. Esta análise ajuda a entender se o interno gera consistentemente retornos anormais, e vale a pena seguir. Esta análise é para um ano seguinte a cada transação, e os resultados são teóricos.
A tabela a seguir mostra as compras de mercado aberto mais recentes que não faziam parte de um plano de negociação automático.
| Data de Negociação | Ticker | Insider | Ações Reportadas |
Preço Reportado |
Ações Ajustadas |
Preço Ajustado |
Base de Custos | Dias para Máx |
Preço em Máx |
Lucro Máx ($) |
Retorno Máx (%) |
|---|---|---|---|---|---|---|---|
| Não há negociações abertas de mercado não planejadas conhecidas para esta combinação de insider e ativo |
O Preço Ajustado é o preço ajustado pela divisão. Ações Ajustadas são as ações ajustadas pela divisão.
Vendas Internas KRP / Kimbell Royalty Partners, LP - Limited Partnership - Análise de Perda de Curto Prazo
Nesta seção, analisamos a evitação de perdas de curto prazo de cada venda interna de mercado aberto, não planejada feita em BBIO / BridgeBio Pharma, Inc.. Um padrão consistente de evitação de perdas pode sugerir que transações futuras de venda possam prever declínios no preço. Esta análise é para um ano seguinte a cada transação, e os resultados são teóricos.
A tabela a seguir mostra as vendas de mercado aberto mais recentes que não faziam parte de um plano de negociação automático.
O Preço Ajustado é o preço ajustado pela divisão. Ações Ajustadas são as ações ajustadas pela divisão.
Compras Internas LAUR / Laureate Education, Inc. - Análise de Lucro de Curto Prazo
Nesta seção, analisamos a lucratividade de cada compra interna de mercado aberto, não planejada, feita em BBIO / BridgeBio Pharma, Inc.. Esta análise ajuda a entender se o interno gera consistentemente retornos anormais, e vale a pena seguir. Esta análise é para um ano seguinte a cada transação, e os resultados são teóricos.
A tabela a seguir mostra as compras de mercado aberto mais recentes que não faziam parte de um plano de negociação automático.
O Preço Ajustado é o preço ajustado pela divisão. Ações Ajustadas são as ações ajustadas pela divisão.
Vendas Internas LAUR / Laureate Education, Inc. - Análise de Perda de Curto Prazo
Nesta seção, analisamos a evitação de perdas de curto prazo de cada venda interna de mercado aberto, não planejada feita em BBIO / BridgeBio Pharma, Inc.. Um padrão consistente de evitação de perdas pode sugerir que transações futuras de venda possam prever declínios no preço. Esta análise é para um ano seguinte a cada transação, e os resultados são teóricos.
A tabela a seguir mostra as vendas de mercado aberto mais recentes que não faziam parte de um plano de negociação automático.
O Preço Ajustado é o preço ajustado pela divisão. Ações Ajustadas são as ações ajustadas pela divisão.
Compras Internas OI / O-I Glass, Inc. - Análise de Lucro de Curto Prazo
Nesta seção, analisamos a lucratividade de cada compra interna de mercado aberto, não planejada, feita em BBIO / BridgeBio Pharma, Inc.. Esta análise ajuda a entender se o interno gera consistentemente retornos anormais, e vale a pena seguir. Esta análise é para um ano seguinte a cada transação, e os resultados são teóricos.
A tabela a seguir mostra as compras de mercado aberto mais recentes que não faziam parte de um plano de negociação automático.
| Data de Negociação | Ticker | Insider | Ações Reportadas |
Preço Reportado |
Ações Ajustadas |
Preço Ajustado |
Base de Custos | Dias para Máx |
Preço em Máx |
Lucro Máx ($) |
Retorno Máx (%) |
|---|---|---|---|---|---|---|---|
| Não há negociações abertas de mercado não planejadas conhecidas para esta combinação de insider e ativo |
O Preço Ajustado é o preço ajustado pela divisão. Ações Ajustadas são as ações ajustadas pela divisão.
Vendas Internas OI / O-I Glass, Inc. - Análise de Perda de Curto Prazo
Nesta seção, analisamos a evitação de perdas de curto prazo de cada venda interna de mercado aberto, não planejada feita em BBIO / BridgeBio Pharma, Inc.. Um padrão consistente de evitação de perdas pode sugerir que transações futuras de venda possam prever declínios no preço. Esta análise é para um ano seguinte a cada transação, e os resultados são teóricos.
A tabela a seguir mostra as vendas de mercado aberto mais recentes que não faziam parte de um plano de negociação automático.
O Preço Ajustado é o preço ajustado pela divisão. Ações Ajustadas são as ações ajustadas pela divisão.
Compras Internas ROC / Rank One Computing Corporation - Análise de Lucro de Curto Prazo
Nesta seção, analisamos a lucratividade de cada compra interna de mercado aberto, não planejada, feita em BBIO / BridgeBio Pharma, Inc.. Esta análise ajuda a entender se o interno gera consistentemente retornos anormais, e vale a pena seguir. Esta análise é para um ano seguinte a cada transação, e os resultados são teóricos.
A tabela a seguir mostra as compras de mercado aberto mais recentes que não faziam parte de um plano de negociação automático.
| Data de Negociação | Ticker | Insider | Ações Reportadas |
Preço Reportado |
Ações Ajustadas |
Preço Ajustado |
Base de Custos | Dias para Máx |
Preço em Máx |
Lucro Máx ($) |
Retorno Máx (%) |
|---|---|---|---|---|---|---|---|
| Não há negociações abertas de mercado não planejadas conhecidas para esta combinação de insider e ativo |
O Preço Ajustado é o preço ajustado pela divisão. Ações Ajustadas são as ações ajustadas pela divisão.
Vendas Internas ROC / Rank One Computing Corporation - Análise de Perda de Curto Prazo
Nesta seção, analisamos a evitação de perdas de curto prazo de cada venda interna de mercado aberto, não planejada feita em BBIO / BridgeBio Pharma, Inc.. Um padrão consistente de evitação de perdas pode sugerir que transações futuras de venda possam prever declínios no preço. Esta análise é para um ano seguinte a cada transação, e os resultados são teóricos.
A tabela a seguir mostra as vendas de mercado aberto mais recentes que não faziam parte de um plano de negociação automático.
| Data de Negociação | Ticker | Insider | Ações Reportadas |
Preço Reportado |
Ações Ajustadas |
Preço Ajustado |
Base de Custos | Dias para Mín |
Preço em Mín |
Máxima Perda Evitada ($) |
Máxima Perda Evitada (%) |
|---|---|---|---|---|---|---|---|
| Não há negociações abertas de mercado não planejadas conhecidas para esta combinação de insider e ativo |
O Preço Ajustado é o preço ajustado pela divisão. Ações Ajustadas são as ações ajustadas pela divisão.
Compras Internas SONO / Sonos, Inc. - Análise de Lucro de Curto Prazo
Nesta seção, analisamos a lucratividade de cada compra interna de mercado aberto, não planejada, feita em BBIO / BridgeBio Pharma, Inc.. Esta análise ajuda a entender se o interno gera consistentemente retornos anormais, e vale a pena seguir. Esta análise é para um ano seguinte a cada transação, e os resultados são teóricos.
A tabela a seguir mostra as compras de mercado aberto mais recentes que não faziam parte de um plano de negociação automático.
| Data de Negociação | Ticker | Insider | Ações Reportadas |
Preço Reportado |
Ações Ajustadas |
Preço Ajustado |
Base de Custos | Dias para Máx |
Preço em Máx |
Lucro Máx ($) |
Retorno Máx (%) |
|---|---|---|---|---|---|---|---|
| Não há negociações abertas de mercado não planejadas conhecidas para esta combinação de insider e ativo |
O Preço Ajustado é o preço ajustado pela divisão. Ações Ajustadas são as ações ajustadas pela divisão.
Vendas Internas SONO / Sonos, Inc. - Análise de Perda de Curto Prazo
Nesta seção, analisamos a evitação de perdas de curto prazo de cada venda interna de mercado aberto, não planejada feita em BBIO / BridgeBio Pharma, Inc.. Um padrão consistente de evitação de perdas pode sugerir que transações futuras de venda possam prever declínios no preço. Esta análise é para um ano seguinte a cada transação, e os resultados são teóricos.
A tabela a seguir mostra as vendas de mercado aberto mais recentes que não faziam parte de um plano de negociação automático.
O Preço Ajustado é o preço ajustado pela divisão. Ações Ajustadas são as ações ajustadas pela divisão.
Compras Internas USFD / US Foods Holding Corp. - Análise de Lucro de Curto Prazo
Nesta seção, analisamos a lucratividade de cada compra interna de mercado aberto, não planejada, feita em BBIO / BridgeBio Pharma, Inc.. Esta análise ajuda a entender se o interno gera consistentemente retornos anormais, e vale a pena seguir. Esta análise é para um ano seguinte a cada transação, e os resultados são teóricos.
A tabela a seguir mostra as compras de mercado aberto mais recentes que não faziam parte de um plano de negociação automático.
| Data de Negociação | Ticker | Insider | Ações Reportadas |
Preço Reportado |
Ações Ajustadas |
Preço Ajustado |
Base de Custos | Dias para Máx |
Preço em Máx |
Lucro Máx ($) |
Retorno Máx (%) |
|---|---|---|---|---|---|---|---|
| Não há negociações abertas de mercado não planejadas conhecidas para esta combinação de insider e ativo |
O Preço Ajustado é o preço ajustado pela divisão. Ações Ajustadas são as ações ajustadas pela divisão.
Vendas Internas USFD / US Foods Holding Corp. - Análise de Perda de Curto Prazo
Nesta seção, analisamos a evitação de perdas de curto prazo de cada venda interna de mercado aberto, não planejada feita em BBIO / BridgeBio Pharma, Inc.. Um padrão consistente de evitação de perdas pode sugerir que transações futuras de venda possam prever declínios no preço. Esta análise é para um ano seguinte a cada transação, e os resultados são teóricos.
A tabela a seguir mostra as vendas de mercado aberto mais recentes que não faziam parte de um plano de negociação automático.
O Preço Ajustado é o preço ajustado pela divisão. Ações Ajustadas são as ações ajustadas pela divisão.
Histórico de Negociações Insider
Esta tabela mostra a lista completa de negociações insider realizadas por Henry R Kravis conforme divulgadas para a Comissão de Valores Mobiliários (SEC).
| Data do Arquivo | Data da Transação | Formulário | Ticker | Ativo | Código | Ações | Ações Restantes | Variação Percentual |
Preço da Ação |
Valor da Transação |
Valor Restante |
|
|---|---|---|---|---|---|---|---|---|---|---|---|---|
| 2026-06-02 |
|
4 | NONE |
KKR Real Estate Select Trust Inc.
Class I Common Stock, par value $0.001 per share |
J - Other | 65,491 | 11,560,716 | 0.57 | 23.26 | 1,523,312 | 268,902,243 | |
| 2026-05-13 | 3 | GMRS |
GMR Solutions Inc.
Class A Common Stock |
14,785,611 | ||||||||
| 2026-05-04 |
|
4 | NONE |
KKR Real Estate Select Trust Inc.
Class I Common Stock, par value $0.001 per share |
J - Other | 63,459 | 11,495,225 | 0.56 | 23.27 | 1,476,681 | 267,493,883 | |
| 2026-04-02 |
|
4 | NONE |
KKR Real Estate Select Trust Inc.
Class I Common Stock, par value $0.001 per share |
J - Other | 149,932 | 11,431,766 | 1.33 | 23.15 | 3,470,915 | 264,645,390 | |
| 2026-03-04 |
|
4 | BTSG |
BrightSpring Health Services, Inc.
Common Stock |
G - Gift | -31,918 | 0 | -100.00 | ||||
| 2026-03-04 |
|
4 | BTSG |
BrightSpring Health Services, Inc.
Common Stock |
G - Gift | -49,295 | 0 | -100.00 | ||||
| 2026-03-04 |
|
4 | BTSG |
BrightSpring Health Services, Inc.
Common Stock |
J - Other | -402,773 | 41,824,259 | -0.95 | ||||
| 2026-03-04 |
|
4 | BTSG |
BrightSpring Health Services, Inc.
Common Stock |
S - Sale | -19,715,000 | 42,227,032 | -31.83 | 40.96 | -807,546,115 | 1,729,661,458 | |
| 2026-03-03 |
|
4 | NONE |
KKR Real Estate Select Trust Inc.
Class I Common Stock, par value $0.001 per share |
J - Other | 59,373 | 11,281,835 | 0.53 | 23.18 | 1,376,259 | 261,512,930 | |
| 2026-02-03 |
|
4 | NONE |
KKR Real Estate Select Trust Inc.
Class I Common Stock, par value $0.001 per share |
J - Other | 64,476 | 11,222,462 | 0.58 | 23.46 | 1,512,613 | 263,278,961 | |
| 2026-01-05 |
|
4 | NONE |
KKR Real Estate Select Trust Inc.
Class I Common Stock, par value $0.001 per share |
J - Other | 142,832 | 11,157,986 | 1.30 | 23.45 | 3,349,422 | 261,654,768 | |
| 2025-12-02 |
|
4 | NONE |
KKR Real Estate Select Trust Inc.
Class I Common Stock, par value $0.001 per share |
J - Other | 60,161 | 11,015,153 | 0.55 | 23.52 | 1,414,990 | 259,076,406 | |
| 2025-11-14 |
|
4 | KKR |
KKR & Co. Inc.
Common Stock |
G - Gift | -350,000 | 5,460,000 | -6.02 | ||||
| 2025-11-04 |
|
4 | NONE |
KKR Real Estate Select Trust Inc.
Class I Common Stock, par value $0.001 per share |
J - Other | 61,725 | 10,954,992 | 0.57 | 23.65 | 1,459,797 | 259,085,566 | |
| 2025-10-22 |
|
4 | BTSG |
BrightSpring Health Services, Inc.
Common Stock |
G - Gift | -39,493 | 0 | -100.00 | ||||
| 2025-10-22 |
|
4 | BTSG |
BrightSpring Health Services, Inc.
Common Stock |
G - Gift | -50,484 | 0 | -100.00 | ||||
| 2025-10-22 |
|
4 | BTSG |
BrightSpring Health Services, Inc.
Common Stock |
J - Other | -409,305 | 61,942,032 | -0.66 | ||||
| 2025-10-22 |
|
4 | BTSG |
BrightSpring Health Services, Inc.
Common Stock |
S - Sale | -14,745,000 | 62,351,337 | -19.13 | 28.78 | -424,390,590 | 1,794,596,182 | |
| 2025-10-02 |
|
4 | NONE |
KKR Real Estate Select Trust Inc.
Class I Common Stock, par value $0.001 per share |
J - Other | 121,051 | 10,893,267 | 1.12 | 23.63 | 2,860,440 | 257,407,903 | |
| 2025-09-03 |
|
4 | NONE |
KKR Real Estate Select Trust Inc.
Class I Common Stock, par value $0.001 per share |
J - Other | 57,813 | 10,772,216 | 0.54 | 23.71 | 1,370,744 | 255,409,240 | |
| 2025-08-04 |
|
4 | NONE |
KKR Real Estate Select Trust Inc.
Class I Common Stock, par value $0.001 per share |
J - Other | 56,795 | 10,714,403 | 0.53 | 23.84 | 1,353,988 | 255,431,369 | |
| 2025-07-23 | 3 | NIQ |
NIQ Global Intelligence plc
Ordinary Shares |
30,022,789 | ||||||||
| 2025-07-02 |
|
4 | NONE |
KKR Real Estate Select Trust Inc.
Class I Common Stock, par value $0.001 per share |
J - Other | 121,083 | 10,657,608 | 1.15 | 23.96 | 2,901,156 | 255,356,293 | |
| 2025-06-26 |
|
4 | BTSG |
BrightSpring Health Services, Inc.
Common Stock |
S - Sale | -2,100,000 | 77,096,337 | -2.65 | 21.15 | -44,418,990 | 1,630,734,011 | |
| 2025-06-16 |
|
4 | BTSG |
BrightSpring Health Services, Inc.
Common Stock |
G - Gift | -51,364 | 0 | -100.00 | ||||
| 2025-06-16 |
|
4 | BTSG |
BrightSpring Health Services, Inc.
Common Stock |
G - Gift | -60,002 | 0 | -100.00 | ||||
| 2025-06-16 |
|
4 | BTSG |
BrightSpring Health Services, Inc.
Common Stock |
J - Other | -475,546 | 79,196,337 | -0.60 | ||||
| 2025-06-16 |
|
4 | BTSG |
BrightSpring Health Services, Inc.
Common Stock |
S - Sale | -13,288,101 | 79,671,883 | -14.29 | 21.15 | -281,068,584 | 1,685,211,702 | |
| 2025-06-10 |
|
4 | BV |
BrightView Holdings, Inc.
Common Stock |
S - Sale | -11,600,000 | 21,533,123 | -35.01 | 14.40 | -167,040,000 | 310,076,971 | |
| 2025-06-03 |
|
4 | NONE |
KKR Real Estate Select Trust Inc.
Class I Common Stock, par value $0.001 per share |
J - Other | 55,537 | 10,536,525 | 0.53 | 23.92 | 1,328,447 | 252,033,676 | |
| 2025-06-02 |
|
4 | KKR |
KKR & Co. Inc.
Common Stock |
S - Sale | -130,925 | 0 | -100.00 | 121.67 | -15,929,645 | ||
| 2025-06-02 |
|
4 | KKR |
KKR & Co. Inc.
Common Stock |
S - Sale | -1,150,469 | 73,006,022 | -1.55 | 119.80 | -137,826,186 | 8,746,121,436 | |
| 2025-05-16 | 3 | HSIC |
HENRY SCHEIN INC
Common Stock |
15,263,662 | ||||||||
| 2025-05-16 | 3 | HSIC |
HENRY SCHEIN INC
Common Stock |
388,370 | ||||||||
| 2025-05-16 |
|
4 | KKR |
KKR & Co. Inc.
Common Stock |
J - Other | -250,377 | 1,549,369 | -13.91 | ||||
| 2025-05-14 |
|
4 | BBIO |
BridgeBio Pharma, Inc.
Common Stock |
S - Sale | -6,000,000 | 13,260,971 | -31.15 | 34.20 | -205,200,000 | 453,525,208 | |
| 2025-05-02 |
|
4 | NONE |
KKR Real Estate Select Trust Inc.
Class I Common Stock, par value $0.001 per share |
J - Other | 52,614 | 10,480,988 | 0.50 | 24.26 | 1,276,412 | 254,268,765 | |
| 2025-04-30 | 3 | NONE |
Capital Group KKR Multi-Sector (plus)
Class F-3 Shares of Beneficial Interest |
7,500,000 | ||||||||
| 2025-04-30 | 3 | NONE |
Capital Group KKR Core Plus (plus)
Class F-3 Shares of Beneficial Interest |
7,500,000 | ||||||||
| 2025-04-08 |
|
4 | CRGY |
Crescent Energy Co
Class A Common Stock |
C - Conversion | 26,185,773 | 26,185,773 | |||||
| 2025-04-08 |
|
4 | CRGY |
Crescent Energy Co
Class B Common Stock |
J - Other | -26,185,773 | 0 | -100.00 | ||||
| 2025-04-02 |
|
4 | NONE |
KKR Real Estate Select Trust Inc.
Class I Common Stock, par value $0.001 per share |
J - Other | 117,903 | 10,428,374 | 1.14 | 24.47 | 2,885,086 | 255,182,312 | |
| 2025-03-14 |
|
4 | KKR |
KKR & Co. Inc.
Common Stock |
G - Gift | -208,676 | 0 | -100.00 | ||||
| 2025-03-11 |
|
4 | CRGY |
Crescent Energy Co
Class A Common Stock |
S - Sale | -2,948,723 | 0 | -100.00 | 9.91 | -29,221,845 | ||
| 2025-03-11 |
|
4 | CRGY |
Crescent Energy Co
Class A Common Stock |
C - Conversion | 2,948,723 | 2,948,723 | |||||
| 2025-03-11 |
|
4 | CRGY |
Crescent Energy Co
Class B Common Stock |
J - Other | -2,948,723 | 26,185,773 | -10.12 | ||||
| 2025-03-07 |
|
4 | BBIO |
BridgeBio Pharma, Inc.
Common Stock |
S - Sale | -6,000,000 | 19,260,971 | -23.75 | 32.96 | -197,760,000 | 634,841,604 | |
| 2025-03-04 |
|
4 | NONE |
KKR Real Estate Select Trust Inc.
Class I Common Stock, par value $0.001 per share |
J - Other | 47,996 | 10,310,471 | 0.47 | 24.70 | 1,185,496 | 254,668,634 | |
| 2025-02-04 |
|
4 | NONE |
KKR Real Estate Select Trust Inc.
Class I Common Stock, par value $0.001 per share |
J - Other | 52,975 | 10,262,475 | 0.52 | 24.73 | 1,310,078 | 253,791,011 | |
| 2025-01-03 |
|
4 | NONE |
KKR Real Estate Select Trust Inc.
Class I Common Stock, par value $0.001 per share |
J - Other | 102,613 | 10,209,500 | 1.02 | 24.86 | 2,550,963 | 253,808,169 | |
| 2024-12-03 |
|
4 | NONE |
KKR Real Estate Select Trust Inc.
Class I Common Stock, par value $0.001 per share |
J - Other | 50,100 | 10,106,887 | 0.50 | 25.18 | 1,261,520 | 254,491,409 | |
| 2024-11-29 |
|
4 | OS |
OneStream, Inc.
Class A Common Stock |
S - Sale | -22,308 | 0 | -100.00 | 29.99 | -669,073 | ||
| 2024-11-29 |
|
4 | OS |
OneStream, Inc.
Class A Common Stock |
S - Sale | -20,963 | 0 | -100.00 | 29.99 | -628,733 | ||
| 2024-11-29 |
|
4 | OS |
OneStream, Inc.
Class A Common Stock |
S - Sale | -139,876 | 0 | -100.00 | 29.99 | -4,195,231 | ||
| 2024-11-29 |
|
4 | OS |
OneStream, Inc.
Class A Common Stock |
S - Sale | -104,100 | 0 | -100.00 | 29.99 | -3,122,219 | ||
| 2024-11-29 |
|
4 | OS |
OneStream, Inc.
Class A Common Stock |
S - Sale | -14,871 | 0 | -100.00 | 29.99 | -446,018 | ||
| 2024-11-29 |
|
4 | OS |
OneStream, Inc.
Class A Common Stock |
S - Sale | -30,640 | 0 | -100.00 | 29.99 | -918,970 | ||
| 2024-11-29 |
|
4 | OS |
OneStream, Inc.
Class A Common Stock |
S - Sale | -43,129 | 0 | -100.00 | 29.99 | -1,293,547 | ||
| 2024-11-29 |
|
4 | OS |
OneStream, Inc.
Class A Common Stock |
S - Sale | -1,704 | 0 | -100.00 | 29.99 | -51,107 | ||
| 2024-11-29 |
|
4 | OS |
OneStream, Inc.
Class A Common Stock |
S - Sale | -64,021 | 0 | -100.00 | 29.99 | -1,920,150 | ||
| 2024-11-29 |
|
4 | OS |
OneStream, Inc.
Class A Common Stock |
S - Sale | -514,850 | 0 | -100.00 | 29.99 | -15,441,639 | ||
| 2024-11-29 |
|
4 | OS |
OneStream, Inc.
Class A Common Stock |
C - Conversion | 22,308 | 22,308 | |||||
| 2024-11-29 |
|
4 | OS |
OneStream, Inc.
Class A Common Stock |
C - Conversion | 20,963 | 20,963 | |||||
| 2024-11-29 |
|
4 | OS |
OneStream, Inc.
Class A Common Stock |
C - Conversion | 139,876 | 139,876 | |||||
| 2024-11-29 |
|
4 | OS |
OneStream, Inc.
Class A Common Stock |
C - Conversion | 104,100 | 104,100 | |||||
| 2024-11-29 |
|
4 | OS |
OneStream, Inc.
Class A Common Stock |
C - Conversion | 14,871 | 14,871 | |||||
| 2024-11-29 |
|
4 | OS |
OneStream, Inc.
Class A Common Stock |
C - Conversion | 30,640 | 30,640 | |||||
| 2024-11-29 |
|
4 | OS |
OneStream, Inc.
Class A Common Stock |
C - Conversion | 43,129 | 43,129 | |||||
| 2024-11-29 |
|
4 | OS |
OneStream, Inc.
Class A Common Stock |
C - Conversion | 1,704 | 1,704 | |||||
| 2024-11-29 |
|
4 | OS |
OneStream, Inc.
Class A Common Stock |
C - Conversion | 64,021 | 64,021 | |||||
| 2024-11-29 |
|
4 | OS |
OneStream, Inc.
Class A Common Stock |
C - Conversion | 514,850 | 514,850 | |||||
| 2024-11-25 |
|
4 | APP |
AppLovin Corp
Class A Common Stock |
G - Gift | -11,377 | 0 | -100.00 | ||||
| 2024-11-25 |
|
4 | APP |
AppLovin Corp
Class A Common Stock |
G - Gift | -5,685 | 0 | -100.00 | ||||
| 2024-11-25 |
|
4 | APP |
AppLovin Corp
Class A Common Stock |
J - Other | -68,037 | 0 | -100.00 | ||||
| 2024-11-25 |
|
4 | APP |
AppLovin Corp
Class A Common Stock |
S - Sale | -200 | 68,037 | -0.29 | 329.06 | -65,812 | 22,388,255 | |
| 2024-11-25 |
|
4 | APP |
AppLovin Corp
Class A Common Stock |
S - Sale | -5,841 | 68,237 | -7.88 | 327.88 | -1,915,161 | 22,373,711 | |
| 2024-11-25 |
|
4 | APP |
AppLovin Corp
Class A Common Stock |
S - Sale | -34,757 | 74,078 | -31.94 | 326.92 | -11,362,891 | 24,217,861 | |
| 2024-11-25 |
|
4 | APP |
AppLovin Corp
Class A Common Stock |
S - Sale | -98,528 | 108,835 | -47.51 | 325.84 | -32,104,413 | 35,462,851 | |
| 2024-11-25 |
|
4 | APP |
AppLovin Corp
Class A Common Stock |
S - Sale | -178,893 | 207,363 | -46.31 | 324.94 | -58,129,241 | 67,380,243 | |
| 2024-11-25 |
|
4 | APP |
AppLovin Corp
Class A Common Stock |
S - Sale | -217,168 | 386,256 | -35.99 | 323.90 | -70,340,802 | 125,108,473 | |
| 2024-11-25 |
|
4 | APP |
AppLovin Corp
Class A Common Stock |
S - Sale | -104,577 | 603,424 | -14.77 | 322.98 | -33,776,332 | 194,894,185 | |
| 2024-11-25 |
|
4 | APP |
AppLovin Corp
Class A Common Stock |
S - Sale | -53,121 | 708,001 | -6.98 | 321.91 | -17,100,117 | 227,911,752 | |
| 2024-11-25 |
|
4 | APP |
AppLovin Corp
Class A Common Stock |
S - Sale | -75,952 | 761,122 | -9.07 | 321.02 | -24,382,050 | 244,334,776 | |
| 2024-11-25 |
|
4 | APP |
AppLovin Corp
Class A Common Stock |
S - Sale | -164,923 | 837,074 | -16.46 | 319.81 | -52,743,843 | 267,703,715 | |
| 2024-11-25 |
|
4 | APP |
AppLovin Corp
Class A Common Stock |
S - Sale | -212,136 | 1,001,997 | -17.47 | 318.80 | -67,628,363 | 319,433,838 | |
| 2024-11-25 |
|
4 | APP |
AppLovin Corp
Class A Common Stock |
S - Sale | -120,493 | 1,214,133 | -9.03 | 317.84 | -38,297,833 | 385,903,432 | |
| 2024-11-25 |
|
4 | APP |
AppLovin Corp
Class A Common Stock |
S - Sale | -113,953 | 1,334,626 | -7.87 | 316.89 | -36,110,840 | 422,932,836 | |
| 2024-11-25 |
|
4 | APP |
AppLovin Corp
Class A Common Stock |
S - Sale | -71,838 | 1,448,579 | -4.72 | 315.69 | -22,678,459 | 457,300,311 | |
| 2024-11-25 |
|
4 | APP |
AppLovin Corp
Class A Common Stock |
S - Sale | -23,291 | 1,520,417 | -1.51 | 315.04 | -7,337,699 | 478,998,862 | |
| 2024-11-25 |
|
4 | APP |
AppLovin Corp
Class A Common Stock |
S - Sale | -6,900 | 1,543,708 | -0.44 | 313.82 | -2,165,366 | 484,448,297 | |
| 2024-11-25 |
|
4 | APP |
AppLovin Corp
Class A Common Stock |
S - Sale | -5,122 | 1,550,608 | -0.33 | 312.83 | -1,602,306 | 485,073,754 | |
| 2024-11-25 |
|
4 | APP |
AppLovin Corp
Class A Common Stock |
S - Sale | -4,897 | 1,555,730 | -0.31 | 311.84 | -1,527,078 | 485,138,065 | |
| 2024-11-25 |
|
4 | APP |
AppLovin Corp
Class A Common Stock |
S - Sale | -5,410 | 1,560,627 | -0.35 | 310.16 | -1,677,952 | 484,040,169 | |
| 2024-11-25 |
|
4 | APP |
AppLovin Corp
Class A Common Stock |
S - Sale | -2,000 | 1,566,037 | -0.13 | 309.00 | -618,002 | 483,906,999 | |
| 2024-11-25 |
|
4 | APP |
AppLovin Corp
Class A Common Stock |
S - Sale | -3,774,246 | 1,568,037 | -70.65 | 305.57 | -1,153,296,350 | 479,145,066 | |
| 2024-11-25 |
|
4 | APP |
AppLovin Corp
Class A Common Stock |
C - Conversion | 5,205,489 | 5,342,283 | 3,805.35 | ||||
| 2024-11-18 |
|
4 | OS |
OneStream, Inc.
Class A Common Stock |
S - Sale | -148,719 | 0 | -100.00 | 29.99 | -4,460,455 | ||
| 2024-11-18 |
|
4 | OS |
OneStream, Inc.
Class A Common Stock |
S - Sale | -139,753 | 0 | -100.00 | 29.99 | -4,191,542 | ||
| 2024-11-18 |
|
4 | OS |
OneStream, Inc.
Class A Common Stock |
S - Sale | -932,505 | 0 | -100.00 | 29.99 | -27,968,156 | ||
| 2024-11-18 |
|
4 | OS |
OneStream, Inc.
Class A Common Stock |
S - Sale | -693,998 | 0 | -100.00 | 29.99 | -20,814,735 | ||
| 2024-11-18 |
|
4 | OS |
OneStream, Inc.
Class A Common Stock |
S - Sale | -99,143 | 0 | -100.00 | 29.99 | -2,973,546 | ||
| 2024-11-18 |
|
4 | OS |
OneStream, Inc.
Class A Common Stock |
S - Sale | -204,269 | 0 | -100.00 | 29.99 | -6,126,538 | ||
| 2024-11-18 |
|
4 | OS |
OneStream, Inc.
Class A Common Stock |
S - Sale | -287,524 | 0 | -100.00 | 29.99 | -8,623,564 | ||
| 2024-11-18 |
|
4 | OS |
OneStream, Inc.
Class A Common Stock |
S - Sale | -11,359 | 0 | -100.00 | 29.99 | -340,685 | ||
| 2024-11-18 |
|
4 | OS |
OneStream, Inc.
Class A Common Stock |
S - Sale | -426,807 | 0 | -100.00 | 29.99 | -12,801,009 | ||
| 2024-11-18 |
|
4 | OS |
OneStream, Inc.
Class A Common Stock |
S - Sale | -3,432,334 | 0 | -100.00 | 29.99 | -102,944,277 | ||
| 2024-11-18 |
|
4 | OS |
OneStream, Inc.
Class A Common Stock |
C - Conversion | 148,719 | 148,719 | |||||
| 2024-11-18 |
|
4 | OS |
OneStream, Inc.
Class A Common Stock |
C - Conversion | 139,753 | 139,753 | |||||
| 2024-11-18 |
|
4 | OS |
OneStream, Inc.
Class A Common Stock |
C - Conversion | 932,505 | 932,505 | |||||
| 2024-11-18 |
|
4 | OS |
OneStream, Inc.
Class A Common Stock |
C - Conversion | 693,998 | 693,998 | |||||
| 2024-11-18 |
|
4 | OS |
OneStream, Inc.
Class A Common Stock |
C - Conversion | 99,143 | 99,143 | |||||
| 2024-11-18 |
|
4 | OS |
OneStream, Inc.
Class A Common Stock |
C - Conversion | 204,269 | 204,269 | |||||
| 2024-11-18 |
|
4 | OS |
OneStream, Inc.
Class A Common Stock |
C - Conversion | 287,524 | 287,524 | |||||
| 2024-11-18 |
|
4 | OS |
OneStream, Inc.
Class A Common Stock |
C - Conversion | 11,359 | 11,359 | |||||
| 2024-11-18 |
|
4 | OS |
OneStream, Inc.
Class A Common Stock |
C - Conversion | 426,807 | 426,807 | |||||
| 2024-11-18 |
|
4 | OS |
OneStream, Inc.
Class A Common Stock |
C - Conversion | 3,432,334 | 3,432,334 | |||||
| 2024-11-04 |
|
4 | NONE |
KKR Real Estate Select Trust Inc.
Class I Common Stock, par value $0.001 per share |
J - Other | 51,469 | 10,056,787 | 0.51 | 25.21 | 1,297,526 | 253,531,593 | |
| 2024-10-02 |
|
4 | NONE |
KKR Real Estate Select Trust Inc.
Class I Common Stock, par value $0.001 per share |
J - Other | 104,407 | 10,005,318 | 1.05 | 25.32 | 2,643,574 | 253,334,652 | |
| 2024-09-17 |
|
4 | BBIO |
BridgeBio Pharma, Inc.
Common Stock |
S - Sale | -5,800,000 | 25,260,971 | -18.67 | 25.75 | -149,350,000 | 650,470,003 | |
| 2024-09-13 |
|
4 | BTSG |
BrightSpring Health Services, Inc.
Common Stock |
P - Purchase | 11,619,998 | 92,959,984 | 14.29 | 11.13 | 129,330,578 | 1,034,644,622 | |
| 2024-09-04 |
|
4 | NONE |
KKR Real Estate Select Trust Inc.
Class I Common Stock, par value $0.001 per share |
J - Other | 51,129 | 9,900,911 | 0.52 | 25.39 | 1,298,174 | 251,384,142 | |
| 2024-08-02 |
|
4 | NONE |
KKR Real Estate Select Trust Inc.
Class I Common Stock, par value $0.001 per share |
J - Other | 51,305 | 9,849,782 | 0.52 | 25.52 | 1,309,301 | 251,366,440 | |
| 2024-07-29 |
|
4 | OS |
OneStream, Inc.
Class A Common Stock |
S - Sale | -59,582 | 0 | -100.00 | 18.85 | -1,123,121 | ||
| 2024-07-29 |
|
4 | OS |
OneStream, Inc.
Class A Common Stock |
C - Conversion | 59,582 | 59,582 | |||||
| 2024-07-29 |
|
4 | OS |
OneStream, Inc.
Class A Common Stock |
S - Sale | -55,990 | 0 | -100.00 | 18.85 | -1,055,412 | ||
| 2024-07-29 |
|
4 | OS |
OneStream, Inc.
Class A Common Stock |
C - Conversion | 55,990 | 55,990 | |||||
| 2024-07-29 |
|
4 | OS |
OneStream, Inc.
Class A Common Stock |
S - Sale | -373,599 | 0 | -100.00 | 18.85 | -7,042,341 | ||
| 2024-07-29 |
|
4 | OS |
OneStream, Inc.
Class A Common Stock |
C - Conversion | 373,599 | 373,599 | |||||
| 2024-07-29 |
|
4 | OS |
OneStream, Inc.
Class A Common Stock |
S - Sale | -278,043 | 0 | -100.00 | 18.85 | -5,241,111 | ||
| 2024-07-29 |
|
4 | OS |
OneStream, Inc.
Class A Common Stock |
C - Conversion | 278,043 | 278,043 | |||||
| 2024-07-29 |
|
4 | OS |
OneStream, Inc.
Class A Common Stock |
S - Sale | -39,720 | 0 | -100.00 | 18.85 | -748,722 | ||
| 2024-07-29 |
|
4 | OS |
OneStream, Inc.
Class A Common Stock |
C - Conversion | 39,720 | 39,720 | |||||
| 2024-07-29 |
|
4 | OS |
OneStream, Inc.
Class A Common Stock |
S - Sale | -81,838 | 0 | -100.00 | 18.85 | -1,542,646 | ||
| 2024-07-29 |
|
4 | OS |
OneStream, Inc.
Class A Common Stock |
C - Conversion | 81,838 | 81,838 | |||||
| 2024-07-29 |
|
4 | OS |
OneStream, Inc.
Class A Common Stock |
S - Sale | -115,193 | 0 | -100.00 | 18.85 | -2,171,388 | ||
| 2024-07-29 |
|
4 | OS |
OneStream, Inc.
Class A Common Stock |
C - Conversion | 115,193 | 115,193 | |||||
| 2024-07-29 |
|
4 | OS |
OneStream, Inc.
Class A Common Stock |
S - Sale | -4,551 | 0 | -100.00 | 18.85 | -85,786 | ||
| 2024-07-29 |
|
4 | OS |
OneStream, Inc.
Class A Common Stock |
C - Conversion | 4,551 | 4,551 | |||||
| 2024-07-29 |
|
4 | OS |
OneStream, Inc.
Class A Common Stock |
S - Sale | -170,996 | 0 | -100.00 | 18.85 | -3,223,275 | ||
| 2024-07-29 |
|
4 | OS |
OneStream, Inc.
Class A Common Stock |
C - Conversion | 170,996 | 170,996 | |||||
| 2024-07-29 |
|
4 | OS |
OneStream, Inc.
Class A Common Stock |
S - Sale | -1,375,132 | 0 | -100.00 | 18.85 | -25,921,238 | ||
| 2024-07-29 |
|
4 | OS |
OneStream, Inc.
Class A Common Stock |
C - Conversion | 1,375,132 | 1,375,132 | |||||
| 2024-07-02 |
|
4 | NONE |
KKR Real Estate Select Trust Inc.
Class I Common Stock, par value $0.001 per share |
J - Other | 109,860 | 9,798,477 | 1.13 | 25.62 | 2,814,606 | 251,036,987 | |
| 2024-06-20 |
|
4 | TGAN |
Transphorm, Inc.
Common Stock |
S - Sale | -24,411,968 | 0 | -100.00 | 5.10 | -124,501,037 | ||
| 2024-06-06 |
|
4 | NONE |
KKR Real Estate Select Trust Inc.
Class I Common Stock, par value $0.001 per share |
P - Purchase | 1,956,182 | 9,688,618 | 25.30 | 25.56 | 50,000,000 | 247,641,064 | |
| 2024-06-04 |
|
4 | NONE |
KKR Real Estate Select Trust Inc.
Class I Common Stock, par value $0.001 per share |
J - Other | 49,899 | 7,732,436 | 0.65 | 25.56 | 1,275,422 | 197,641,064 | |
| 2024-05-28 |
|
4 | BV |
BrightView Holdings, Inc.
Common Stock |
S - Sale | -17,500,000 | 33,133,123 | -34.56 | 12.48 | -218,400,000 | 413,501,375 | |
| 2024-05-15 |
|
4 | APP |
AppLovin Corp
Class A Common Stock |
G - Gift | -38,308 | 0 | -100.00 | ||||
| 2024-05-15 |
|
4 | APP |
AppLovin Corp
Class A Common Stock |
G - Gift | -19,789 | 0 | -100.00 | ||||
| 2024-05-15 |
|
4 | APP |
AppLovin Corp
Class A Common Stock |
J - Other | -229,773 | 136,794 | -62.68 | ||||
| 2024-05-15 |
|
4 | APP |
AppLovin Corp
Class A Common Stock |
S - Sale | -17,500,000 | 366,567 | -97.95 | 83.36 | -1,458,800,000 | 30,557,025 | |
| 2024-05-15 |
|
4 | APP |
AppLovin Corp
Class A Common Stock |
C - Conversion | 17,700,000 | 17,866,567 | 10,626.35 | ||||
| 2024-05-02 |
|
4 | NONE |
KKR Real Estate Select Trust Inc.
Class I Common Stock, par value $0.001 per share |
J - Other | 48,296 | 7,682,537 | 0.63 | 25.94 | 1,252,792 | 199,285,006 | |
| 2024-04-03 |
|
4 | CRGY |
Crescent Energy Co
Class A Common Stock |
S - Sale | -6,000,000 | 0 | -100.00 | 10.74 | -64,440,000 | ||
| 2024-04-03 |
|
4 | CRGY |
Crescent Energy Co
Class A Common Stock |
C - Conversion | 6,000,000 | 6,000,000 | |||||
| 2024-04-03 |
|
4 | CRGY |
Crescent Energy Co
Class B Common Stock |
J - Other | -6,000,000 | 29,134,496 | -17.08 | ||||
| 2024-04-01 |
|
4 | NONE |
KKR Real Estate Select Trust Inc.
Class I Common Stock, par value $0.001 per share |
J - Other | 105,080 | 7,634,241 | 1.40 | 26.07 | 2,739,447 | 199,024,665 | |
| 2024-03-28 |
|
4 | NONE |
KKR FS Income Trust Select
Common Shares of Ben. Interest, par value $0.01 per share |
P - Purchase | 571,429 | 1,000,687 | 133.12 | 25.00 | 14,285,714 | 25,017,184 | |
| 2024-03-15 |
|
4 | NONE |
KKR FS Income Trust Select
Common Shares of Ben. Interest, par value $0.01 per share |
P - Purchase | 286,402 | 429,259 | 200.48 | 24.94 | 7,142,857 | 10,705,714 | |
| 2024-03-11 |
|
4 | CRGY |
Crescent Energy Co
Class A Common Stock |
S - Sale | -13,800,000 | 0 | -100.00 | 9.87 | -136,206,000 | ||
| 2024-03-11 |
|
4 | CRGY |
Crescent Energy Co
Class A Common Stock |
C - Conversion | 13,800,000 | 13,800,000 | |||||
| 2024-03-11 |
|
4 | CRGY |
Crescent Energy Co
Class B Common Stock |
J - Other | -13,800,000 | 35,134,496 | -28.20 | ||||
| 2024-03-11 |
|
4 | CRGY |
Crescent Energy Co
Class B Common Stock |
J - Other | -2,300,000 | 48,934,496 | -4.49 | ||||
| 2024-03-08 |
|
4 | APP |
AppLovin Corp
Class A Common Stock |
G - Gift | -46,812 | 0 | -100.00 | ||||
| 2024-03-08 |
|
4 | APP |
AppLovin Corp
Class A Common Stock |
G - Gift | -26,790 | 0 | -100.00 | ||||
| 2024-03-08 |
|
4 | APP |
AppLovin Corp
Class A Common Stock |
J - Other | -416,926 | 166,567 | -71.45 | ||||
| 2024-03-08 |
|
4 | APP |
AppLovin Corp
Class A Common Stock |
S - Sale | -19,866,397 | 583,493 | -97.15 | 54.46 | -1,081,923,981 | 31,777,029 | |
| 2024-03-08 |
|
4 | APP |
AppLovin Corp
Class A Common Stock |
C - Conversion | 16,000,000 | 20,449,890 | 359.56 | ||||
| 2024-03-08 |
|
4 | KKR |
KKR & Co. Inc.
Common Stock |
G - Gift | -500,000 | 5,810,000 | -7.92 | ||||
| 2024-03-05 | 3 | NONE |
KKR FS Income Trust Select
Common Shares of Ben. Interest, par value $0.01 per share |
142,857 | ||||||||
| 2024-03-04 |
|
4 | NONE |
KKR Real Estate Select Trust Inc.
Class I Common Stock, par value $0.001 per share |
J - Other | 47,431 | 7,529,161 | 0.63 | 26.52 | 1,257,878 | 199,673,341 | |
| 2024-02-02 |
|
4 | NONE |
KKR Real Estate Select Trust Inc.
Class I Common Stock, par value $0.001 per share |
J - Other | 51,232 | 7,481,729 | 0.69 | 26.82 | 1,374,041 | 200,659,982 | |
| 2024-01-26 | 3 | BTSG |
BrightSpring Health Services, Inc.
Common Stock |
81,339,986 | ||||||||
| 2024-01-03 |
|
4 | NONE |
KKR Real Estate Select Trust Inc.
Class I Common Stock, par value $0.001 per share |
J - Other | 105,913 | 7,430,497 | 1.45 | 27.00 | 2,859,642 | 200,623,431 | |
| 2023-12-04 |
|
4 | NONE |
KKR Real Estate Select Trust Inc.
Class I Common Stock, par value $0.001 per share |
J - Other | 50,810 | 7,324,585 | 0.70 | 27.65 | 1,404,890 | 202,524,769 | |
| 2023-11-17 |
|
4 | CRGY |
Crescent Energy Co
Class A Common Stock |
S - Sale | -3,000,000 | 0 | -100.00 | 10.90 | -32,700,000 | ||
| 2023-11-17 |
|
4 | CRGY |
Crescent Energy Co
Class A Common Stock |
C - Conversion | 3,000,000 | 3,000,000 | |||||
| 2023-11-17 |
|
4 | CRGY |
Crescent Energy Co
Class B Common Stock |
J - Other | -3,000,000 | 51,234,496 | -5.53 | ||||
| 2023-11-02 |
|
4 | NONE |
KKR Real Estate Select Trust Inc.
Class I Common Stock, par value $0.001 per share |
J - Other | 52,439 | 7,273,775 | 0.73 | 28.21 | 1,479,306 | 205,193,192 | |
| 2023-10-03 |
|
4 | NONE |
KKR Real Estate Select Trust Inc.
Class I Common Stock, par value $0.001 per share |
J - Other | 101,672 | 7,221,336 | 1.43 | 28.52 | 2,899,684 | 205,952,501 | |
| 2023-09-05 |
|
4 | NONE |
KKR Real Estate Select Trust Inc.
Class I Common Stock, par value $0.001 per share |
J - Other | 53,174 | 7,119,664 | 0.75 | 28.55 | 1,518,121 | 203,266,407 | |
| 2023-08-23 |
|
4 | APP |
AppLovin Corp
Class A Common Stock |
G - Gift | -6,546 | 0 | -100.00 | ||||
| 2023-08-23 |
|
4 | APP |
AppLovin Corp
Class A Common Stock |
J - Other | -120,437 | 4,449,890 | -2.64 | ||||
| 2023-08-23 |
|
4 | APP |
AppLovin Corp
Class A Common Stock |
S - Sale | -15,000,000 | 4,570,327 | -76.65 | 36.85 | -552,750,000 | 168,416,550 | |
| 2023-08-16 |
|
4 | APP |
AppLovin Corp
Class A Common Stock |
G - Gift | -4,052 | 0 | -100.00 | ||||
| 2023-08-16 |
|
4 | APP |
AppLovin Corp
Class A Common Stock |
J - Other | -74,569 | 19,570,327 | -0.38 | ||||
| 2023-08-16 |
|
4 | APP |
AppLovin Corp
Class A Common Stock |
S - Sale | -10,000,000 | 19,644,896 | -33.73 | 37.00 | -370,000,000 | 726,861,152 | |
| 2023-08-02 |
|
4 | NONE |
KKR Real Estate Select Trust Inc.
Class I Common Stock, par value $0.001 per share |
J - Other | 53,480 | 7,066,490 | 0.76 | 28.71 | 1,535,421 | 202,878,925 | |
| 2023-07-25 |
|
4 | TGAN |
Transphorm, Inc.
Common Stock |
P - Purchase | 1,735,988 | 24,411,968 | 7.66 | 3.30 | 5,728,760 | 80,559,494 | |
| 2023-07-05 |
|
4 | NONE |
KKR Real Estate Select Trust Inc.
Class I Common Stock, par value $0.001 per share |
J - Other | 114,048 | 7,013,010 | 1.65 | 28.85 | 3,290,274 | 202,325,325 | |
| 2023-07-05 |
|
4 | NONE |
KKR FS Income Trust
Common Shares of Beneficial Interest |
P - Purchase | 459,348 | 943,806 | 94.82 | 27.99 | 12,857,143 | 26,417,117 | |
| 2023-07-05 |
|
4 | CRGY |
Crescent Energy Co
Class A Common Stock |
J - Other | -27,597,199 | 0 | -100.00 | ||||
| 2023-07-05 |
|
4 | CRGY |
Crescent Energy Co
Class A Common Stock |
C - Conversion | 27,597,199 | 27,597,199 | |||||
| 2023-07-05 |
|
4 | CRGY |
Crescent Energy Co
Class B Common Stock |
J - Other | -27,597,199 | 54,234,496 | -33.72 | ||||
| 2023-06-05 |
|
4 | APP |
AppLovin Corp
Class A Common Stock |
G - Gift | -6,079 | 0 | -100.00 | ||||
| 2023-06-05 |
|
4 | APP |
AppLovin Corp
Class A Common Stock |
J - Other | -137,723 | 29,644,896 | -0.46 | ||||
| 2023-06-05 |
|
4 | APP |
AppLovin Corp
Class A Common Stock |
S - Sale | -15,000,000 | 29,782,619 | -33.50 | 23.00 | -345,000,000 | 685,000,237 | |
| 2023-06-02 |
|
4 | NONE |
KKR Real Estate Select Trust Inc.
Class I Common Stock, par value $0.001 per share |
J - Other | 55,244 | 6,898,962 | 0.81 | 29.26 | 1,616,451 | 201,863,626 | |
| 2023-06-01 |
|
4 | NONE |
KKR FS Income Trust
Common Shares of Beneficial Interest |
P - Purchase | 27,315 | 484,458 | 5.98 | 26.15 | 714,286 | 12,668,571 | |
| 2023-05-30 | 3 | NONE |
KKR FS Income Trust
Common Shares of Beneficial Interest |
457,143 | ||||||||
| 2023-05-19 |
|
4 | APP |
AppLovin Corp
Class A Common Stock |
S - Sale | -15,952,381 | 44,782,619 | -26.27 | 21.00 | -335,000,001 | 940,434,999 | |
| 2023-05-02 |
|
4 | NONE |
KKR Real Estate Select Trust Inc.
Class I Common Stock, par value $0.001 per share |
J - Other | 53,597 | 6,843,718 | 0.79 | 30.11 | 1,613,818 | 206,064,335 | |
| 2023-04-04 |
|
4 | NONE |
KKR Real Estate Select Trust Inc.
Class I Common Stock, par value $0.001 per share |
J - Other | 116,154 | 6,790,120 | 1.74 | 30.56 | 3,549,665 | 207,506,071 | |
| 2023-03-09 |
|
4 | USFD |
US Foods Holding Corp.
Common Stock |
S - Sale | -7,600,000 | 37 | -100.00 | 38.83 | -295,108,000 | 1,437 | |
| 2023-03-09 |
|
4 | USFD |
US Foods Holding Corp.
Common Stock |
C - Conversion | 7,600,037 | 7,600,037 | 21.50 | 163,400,796 | 163,400,796 | ||
| 2023-03-02 |
|
4 | NONE |
KKR Real Estate Select Trust Inc.
Class I Common Stock, par value $0.001 per share |
J - Other | 49,666 | 6,673,966 | 0.75 | 30.01 | 1,490,483 | 200,285,724 | |
| 2023-02-10 |
|
5 | FORG |
ForgeRock, Inc.
Class A Common Stock |
C - Conversion | 793,103 | 793,103 | |||||
| 2023-02-03 |
|
4 | KNBE |
KnowBe4, Inc.
Class A Common Stock |
D - Sale to Issuer | -12,048,193 | 0 | -100.00 | 24.90 | -300,000,006 | ||
| 2023-02-02 |
|
4 | NONE |
KKR Real Estate Select Trust Inc.
Class I Common Stock, par value $0.001 per share |
J - Other | 54,873 | 6,624,300 | 0.84 | 30.42 | 1,669,242 | 201,511,205 | |
| 2023-01-04 |
|
4 | NONE |
KKR Real Estate Select Trust Inc.
Class I Common Stock, par value $0.001 per share |
J - Other | 116,329 | 6,569,427 | 1.80 | 30.39 | 3,535,238 | 199,644,880 | |
| 2022-12-05 |
|
4 | KNBE |
KnowBe4, Inc.
Class A Common Stock |
C - Conversion | 12,048,193 | 12,048,193 | |||||
| 2022-12-02 |
|
4 | NONE |
KKR Real Estate Select Trust Inc.
Class I Common Stock, par value $0.001 per share |
J - Other | 52,818 | 6,453,098 | 0.83 | 30.84 | 1,628,892 | 199,013,536 | |
| 2022-11-22 |
|
4 | LAUR |
LAUREATE EDUCATION, INC.
Common Stock |
S - Sale | -1,050,119 | 0 | -100.00 | 9.41 | -9,880,570 | ||
| 2022-11-22 |
|
4 | LAUR |
LAUREATE EDUCATION, INC.
Common Stock |
S - Sale | -31,792,064 | 0 | -100.00 | 9.41 | -299,131,530 | ||
| 2022-11-02 |
|
4 | NONE |
KKR Real Estate Select Trust Inc.
Class I Common Stock, par value $0.001 per share |
J - Other | 52,184 | 6,400,280 | 0.82 | 31.33 | 1,634,935 | 200,520,781 | |
| 2022-10-04 |
|
4 | NONE |
KKR Real Estate Select Trust Inc.
Class I Common Stock, par value $0.001 per share |
J - Other | 93,314 | 6,348,096 | 1.49 | 31.37 | 2,927,271 | 199,139,770 | |
| 2022-09-15 |
|
4 | CRGY |
Crescent Energy Co
Class A Common Stock |
S - Sale | -5,750,000 | 572,354 | -90.95 | 14.10 | -81,075,000 | 8,070,191 | |
| 2022-09-15 |
|
4 | CRGY |
Crescent Energy Co
Class A Common Stock |
C - Conversion | 6,322,354 | 6,322,354 | |||||
| 2022-09-15 |
|
4 | CRGY |
Crescent Energy Co
Class B Common Stock |
J - Other | -6,322,354 | 81,831,695 | -7.17 | ||||
| 2022-09-02 |
|
4 | NONE |
KKR Real Estate Select Trust Inc.
Class I Common Stock, par value $0.001 per share |
J - Other | 46,868 | 6,254,782 | 0.75 | 31.50 | 1,476,329 | 197,025,621 | |
| 2022-08-02 |
|
4 | NONE |
KKR Real Estate Select Trust Inc.
Class I Common Stock, par value $0.001 per share |
J - Other | 44,980 | 6,207,914 | 0.73 | 31.34 | 1,409,668 | 194,556,025 | |
| 2022-07-05 |
|
4 | NONE |
KKR Real Estate Select Trust Inc.
Class I Common Stock, par value $0.001 per share |
J - Other | 54,955 | 6,162,934 | 0.90 | 32.11 | 1,764,592 | 197,891,816 | |
| 2022-06-09 |
|
4 | KREF |
KKR Real Estate Finance Trust Inc.
Common Stock |
S - Sale | -4,250,000 | 10,000,000 | -29.82 | 19.51 | -82,917,500 | 195,100,000 | |
| 2022-06-03 |
|
4 | TGAN |
Transphorm, Inc.
Common Stock |
X - Other | 500,000 | 22,675,980 | 2.25 | 5.00 | 2,500,000 | 113,379,900 | |
| 2022-06-02 |
|
4 | NONE |
KKR Real Estate Select Trust Inc.
Class I Common Stock, par value $0.001 per share |
J - Other | 19,367 | 6,107,980 | 0.32 | 32.49 | 629,239 | 198,448,257 | |
| 2022-05-31 |
|
4 | KKR |
KKR & Co. Inc.
Common Stock |
A - Award | 49,369 | 1,549,369 | 3.29 | ||||
| 2022-05-31 |
|
4 | KKR |
KKR & Co. Inc.
Common Stock |
M - Exercise | 1,500,000 | 1,500,000 | |||||
| 2022-05-31 |
|
4 | KKR |
KKR & Co. Inc.
Common Stock |
A - Award | 2,364,773 | 75,365,167 | 3.24 | ||||
| 2022-05-31 |
|
4 | KKR |
KKR & Co. Inc.
Common Stock |
M - Exercise | 71,849,925 | 73,000,394 | 6,245.27 | ||||
| 2022-05-31 |
|
4 | KKR |
KKR & Co. Inc.
Common Stock |
J - Other | 1,338 | 1,150,469 | 0.12 | ||||
| 2022-05-31 |
|
4 | KKR |
KKR & Co. Inc.
Common Stock |
G - Gift | -340,000 | 6,310,000 | -5.11 | ||||
| 2022-05-03 |
|
4 | NONE |
KKR Real Estate Select Trust Inc.
Class I Common Stock, par value $0.001 per share |
J - Other | 16,944 | 6,088,612 | 0.28 | 32.50 | 550,685 | 197,879,904 | |
| 2022-04-04 |
|
4 | NONE |
KKR Real Estate Select Trust Inc.
Class I Common Stock, par value $0.001 per share |
J - Other | 55,028 | 6,071,668 | 0.91 | 31.65 | 1,741,645 | 192,168,301 | |
| 2022-03-02 |
|
4 | NONE |
KKR Real Estate Select Trust Inc.
Class I Common Stock, par value $0.001 per share |
J - Other | 12,694 | 6,016,640 | 0.21 | 30.60 | 388,435 | 184,109,184 | |
| 2022-02-11 |
|
5 | KKR |
KKR & Co. Inc.
Common Stock |
G - Gift | -350,000 | 6,650,000 | -5.00 | ||||
| 2022-02-10 |
|
5 | IR |
Ingersoll Rand Inc.
Common Stock |
G - Gift | -17,449 | 0 | -100.00 | ||||
| 2022-02-02 |
|
4 | NONE |
KKR Real Estate Select Trust Inc.
Class I Common Stock, par value $0.001 per share |
J - Other | 12,663 | 6,003,946 | 0.21 | 29.82 | 377,615 | 179,037,671 | |
| 2022-01-04 |
|
4 | NONE |
KKR Real Estate Select Trust Inc.
Class I Common Stock, par value $0.001 per share |
J - Other | 35,974 | 5,991,283 | 0.60 | 29.49 | 1,060,875 | 176,682,932 | |
| 2021-12-09 |
|
4 | APP |
AppLovin Corp
Class B Common Stock |
C - Conversion | -69,145,000 | 38,905,489 | -63.99 | ||||
| 2021-12-09 |
|
4 | APP |
AppLovin Corp
Class A Common Stock |
S - Sale | -8,410,000 | 60,735,000 | -12.16 | 80.51 | -677,089,100 | 4,889,774,850 | |
| 2021-12-09 |
|
4 | APP |
AppLovin Corp
Class A Common Stock |
C - Conversion | 69,145,000 | 69,145,000 | |||||
| 2021-12-07 | 3 | CRGY |
Crescent Energy Co
Class B Common Stock |
88,154,049 | ||||||||
| 2021-11-17 |
|
4 | KNBE |
KnowBe4, Inc.
Class B Common Stock |
C - Conversion | -2,695,063 | 26,115,895 | -9.35 | ||||
| 2021-11-17 |
|
4 | KNBE |
KnowBe4, Inc.
Class A Common Stock |
S - Sale | -2,695,063 | 0 | -100.00 | 24.72 | -66,621,957 | ||
| 2021-11-17 |
|
4 | KNBE |
KnowBe4, Inc.
Class A Common Stock |
C - Conversion | 2,695,063 | 2,695,063 | |||||
| 2021-11-08 |
|
4 | NONE |
Transphorm, Inc.
Contractual Right to Purchase Warrant (Right to Buy) |
P - Purchase | 104,167 | 104,167 | |||||
| 2021-11-08 |
|
4 | NONE |
Transphorm, Inc.
Contractual Right to Purchase |
P - Purchase | 500,000 | 500,000 | |||||
| 2021-11-08 |
|
4 | NONE |
Transphorm, Inc.
Warrant (Right to Buy) |
P - Purchase | 208,333 | 208,333 | |||||
| 2021-11-08 |
|
4 | NONE |
Transphorm, Inc.
Common Stock |
P - Purchase | 1,000,000 | 22,175,980 | 4.72 | 5.00 | 5,000,000 | 110,879,900 | |
| 2021-11-05 |
|
4 | KKR |
KKR & Co. Inc.
Common Stock |
S - Sale | -4,667,166 | 0 | -100.00 | 82.25 | -383,874,404 | ||
| 2021-11-03 |
|
4 | KREF |
KKR Real Estate Finance Trust Inc.
Special Voting Preferred Stock |
C - Conversion | -1 | 0 | -100.00 | ||||
| 2021-11-03 |
|
4 | KREF |
KKR Real Estate Finance Trust Inc.
Common Stock |
C - Conversion | 1 | 1 | |||||
| 2021-11-01 |
|
4 | LAUR |
LAUREATE EDUCATION, INC.
Class B Common Stock |
C - Conversion | -699,340 | 0 | -100.00 | ||||
| 2021-11-01 |
|
4 | LAUR |
LAUREATE EDUCATION, INC.
Class B Common Stock |
C - Conversion | -15,374,715 | 0 | -100.00 | ||||
| 2021-11-01 |
|
4 | LAUR |
LAUREATE EDUCATION, INC.
Common Stock |
C - Conversion | 699,340 | 1,050,119 | 199.37 | ||||
| 2021-11-01 |
|
4 | LAUR |
LAUREATE EDUCATION, INC.
Common Stock |
C - Conversion | 15,374,715 | 31,792,064 | 93.65 | ||||
| 2021-10-04 |
|
4 | NONE |
KKR Real Estate Select Trust Inc.
Class I Common Stock, par value $0.001 per share |
J - Other | 20,872 | 5,955,309 | 0.35 | 28.33 | 591,313 | 168,713,899 | |
| 2021-10-01 |
|
4 | COTY |
COTY INC.
Series B Convertible Preferred Stock |
S - Sale | -290,465 | 277,902 | -51.11 | ||||
| 2021-09-22 |
|
4 | FORG |
ForgeRock, Inc.
Class B Common Stock |
J - Other | 5,287,352 | 5,287,352 | |||||
| 2021-09-22 |
|
4 | FORG |
ForgeRock, Inc.
Series E Convertible Preferred Stock |
C - Conversion | -2,591,935 | 0 | -100.00 | ||||
| 2021-09-22 |
|
4 | FORG |
ForgeRock, Inc.
Series D Convertible Preferred Stock |
C - Conversion | -2,695,417 | 0 | -100.00 | ||||
| 2021-09-22 |
|
4 | FORG |
ForgeRock, Inc.
Common Stock |
J - Other | -5,287,352 | 0 | -100.00 | ||||
| 2021-09-22 |
|
4 | FORG |
ForgeRock, Inc.
Common Stock |
C - Conversion | 2,591,935 | 5,287,352 | 96.16 | ||||
| 2021-09-22 |
|
4 | FORG |
ForgeRock, Inc.
Common Stock |
C - Conversion | 2,695,417 | 2,695,417 | |||||
| 2021-09-21 |
|
4 | ASO |
Academy Sports & Outdoors, Inc.
Common Stock |
S - Sale | -8,614,193 | 0 | -100.00 | 43.52 | -374,889,679 | ||
| 2021-09-21 |
|
4 | ASO |
Academy Sports & Outdoors, Inc.
Common Stock |
S - Sale | -6,670,127 | 0 | -100.00 | 43.52 | -290,283,927 | ||
| 2021-09-21 |
|
4 | ASO |
Academy Sports & Outdoors, Inc.
Common Stock |
S - Sale | -3,361,282 | 0 | -100.00 | 43.52 | -146,282,993 | ||
| 2021-09-10 |
|
4 | COTY |
COTY INC.
Class A Common Stock |
S - Sale | -50,000,088 | 0 | -100.00 | 8.39 | -419,500,738 | ||
| 2021-09-09 |
|
4 | COTY |
COTY INC.
Series B Convertible Preferred Stock |
C - Conversion | -285,576 | 568,367 | -33.44 | ||||
| 2021-09-09 |
|
4 | COTY |
COTY INC.
Class A Common Stock |
C - Conversion | 50,000,088 | 50,000,088 | 6.24 | 312,000,549 | 312,000,549 | ||
| 2021-08-18 |
|
4 | KNBE |
KnowBe4, Inc.
Class B Common Stock |
C - Conversion | -2,341,922 | 28,810,958 | -7.52 | ||||
| 2021-08-18 |
|
4 | KNBE |
KnowBe4, Inc.
Class A Common Stock |
S - Sale | -2,341,922 | 0 | -100.00 | 19.92 | -46,651,086 | ||
| 2021-08-18 |
|
4 | KNBE |
KnowBe4, Inc.
Class A Common Stock |
C - Conversion | 2,341,922 | 2,341,922 | |||||
| 2021-08-18 |
|
4 | NONE |
KKR Real Estate Select Trust Inc.
Class I Common Stock, par value $0.001 per share |
J - Other | 7,184 | 5,934,436 | 0.12 | 26.71 | 191,878 | 158,508,799 | |
| 2021-08-03 |
|
4 | COOP |
Mr. Cooper Group Inc.
Series A Convertible Preferred Stock |
S - Sale | -1,000,000 | 0 | -100.00 | 27.89 | -27,890,000 | ||
| 2021-08-03 |
|
4 | COOP |
Mr. Cooper Group Inc.
Common Stock |
S - Sale | -9,749,189 | 0 | -100.00 | 33.25 | -324,160,534 | ||
| 2021-08-03 |
|
4 | COOP |
Mr. Cooper Group Inc.
Common Stock |
S - Sale | -1,324,056 | 0 | -100.00 | 33.25 | -44,024,862 | ||
| 2021-07-14 |
|
4 | KRP |
Kimbell Royalty Partners, LP
Common units representing limited partner interests |
S - Sale | -63,906 | 202,170 | -24.02 | 12.20 | -779,653 | 2,466,474 | |
| 2021-07-14 |
|
4 | KRP |
Kimbell Royalty Partners, LP
Common units representing limited partner interests |
S - Sale | -936,094 | 2,961,389 | -24.02 | 12.20 | -11,420,347 | 36,128,946 | |
| 2021-07-14 |
|
4 | ASO |
Academy Sports & Outdoors, Inc.
Common Stock |
S - Sale | -4,666,158 | 8,614,193 | -35.14 | 38.30 | -178,713,851 | 329,923,592 | |
| 2021-07-14 |
|
4 | ASO |
Academy Sports & Outdoors, Inc.
Common Stock |
S - Sale | -3,613,093 | 6,670,127 | -35.14 | 38.30 | -138,381,462 | 255,465,864 | |
| 2021-07-14 |
|
4 | ASO |
Academy Sports & Outdoors, Inc.
Common Stock |
S - Sale | -1,820,749 | 3,361,282 | -35.14 | 38.30 | -69,734,687 | 128,737,101 | |
| 2021-07-08 |
|
4 | LAUR |
LAUREATE EDUCATION, INC.
Class B Common Stock |
C - Conversion | -62,758 | 699,340 | -8.23 | ||||
| 2021-07-08 |
|
4 | LAUR |
LAUREATE EDUCATION, INC.
Class B Common Stock |
C - Conversion | -2,937,242 | 15,374,715 | -16.04 | ||||
| 2021-07-08 |
|
4 | LAUR |
LAUREATE EDUCATION, INC.
Class A Common Stock |
C - Conversion | 62,758 | 62,758 | |||||
| 2021-07-08 |
|
4 | LAUR |
LAUREATE EDUCATION, INC.
Class A Common Stock |
C - Conversion | 2,937,242 | 2,937,242 | |||||
| 2021-06-24 |
|
4 | FOCS |
Focus Financial Partners Inc.
Units of Focus Financial Partners, LLC |
C - Conversion | -3,654,044 | 0 | -100.00 | ||||
| 2021-06-24 |
|
4 | FOCS |
Focus Financial Partners Inc.
Class A Common Stock |
S - Sale | -403,615 | 0 | -100.00 | 49.87 | -20,128,280 | ||
| 2021-06-24 |
|
4 | FOCS |
Focus Financial Partners Inc.
Class A Common Stock |
S - Sale | -3,086,585 | 0 | -100.00 | 49.87 | -153,927,994 | ||
| 2021-06-24 |
|
4 | FOCS |
Focus Financial Partners Inc.
Class A Common Stock |
S - Sale | -3,654,044 | 0 | -100.00 | 49.87 | -182,227,174 | ||
| 2021-06-24 |
|
4 | FOCS |
Focus Financial Partners Inc.
Class A Common Stock |
C - Conversion | 3,654,044 | 3,654,044 | |||||
| 2021-06-17 | 3 | MCF |
CONTANGO OIL & GAS CO
Common Stock |
0 | ||||||||
| 2021-05-28 |
|
4 | KREF |
KKR Real Estate Finance Trust Inc.
Common Stock |
S - Sale | -750,000 | 14,250,000 | -5.00 | 20.07 | -15,052,500 | 285,997,500 | |
| 2021-05-18 | 3 | NONE |
KKR Real Estate Select Trust Inc.
Common Stock |
5,927,253 | ||||||||
| 2021-05-17 |
|
4 | IR |
Ingersoll Rand Inc.
Common Stock |
J - Other | -75,919 | 29,788,635 | -0.25 | ||||
| 2021-05-17 |
|
4 | IR |
Ingersoll Rand Inc.
Common Stock |
S - Sale | -14,924,081 | 29,864,554 | -33.32 | 48.57 | -724,862,614 | 1,450,521,388 | |
| 2021-05-14 |
|
4 | KREF |
KKR Real Estate Finance Trust Inc.
Common Stock |
S - Sale | -5,000,000 | 15,000,000 | -25.00 | 20.07 | -100,350,000 | 301,050,000 | |
| 2021-05-12 |
|
4 | ASO |
Academy Sports & Outdoors, Inc.
Common Stock |
S - Sale | -6,052,145 | 13,280,351 | -31.31 | 30.96 | -187,374,409 | 411,159,667 | |
| 2021-05-12 |
|
4 | ASO |
Academy Sports & Outdoors, Inc.
Common Stock |
S - Sale | -4,686,289 | 10,283,220 | -31.31 | 30.96 | -145,087,507 | 318,368,491 | |
| 2021-05-12 |
|
4 | ASO |
Academy Sports & Outdoors, Inc.
Common Stock |
S - Sale | -2,361,566 | 5,182,031 | -31.31 | 30.96 | -73,114,083 | 160,435,680 | |
| 2021-05-04 |
|
4 | FISV |
FISERV INC
Common Stock |
S - Sale | -23,000,000 | 62,300,667 | -26.96 | 117.70 | -2,707,100,000 | 7,332,788,506 | |
| 2021-04-29 |
|
4 | IMPL |
IMPEL NEUROPHARMA INC
Series D Preferred Stock |
C - Conversion | -42,307,448 | 0 | -100.00 | ||||
| 2021-04-29 |
|
4 | IMPL |
IMPEL NEUROPHARMA INC
Common Stock |
P - Purchase | 1,100,000 | 3,802,638 | 40.70 | 15.00 | 16,500,000 | 57,039,570 | |
| 2021-04-29 |
|
4 | IMPL |
IMPEL NEUROPHARMA INC
Common Stock |
J - Other | 118,712 | 2,702,638 | 4.59 | 13.50 | 1,602,612 | 36,485,613 | |
| 2021-04-29 |
|
4 | IMPL |
IMPEL NEUROPHARMA INC
Common Stock |
C - Conversion | 2,583,926 | 2,583,926 | |||||
| 2021-04-28 |
|
4 | KNBE |
KnowBe4, Inc.
Class B Common Stock |
J - Other | 31,152,880 | 31,152,880 | |||||
| 2021-04-28 |
|
4 | KNBE |
KnowBe4, Inc.
Series C-1 Convertible Preferred Stock |
C - Conversion | -26,438,760 | 0 | -100.00 | ||||
| 2021-04-28 |
|
4 | KNBE |
KnowBe4, Inc.
Series C Convertible Preferred Stock |
C - Conversion | -4,431,800 | 0 | -100.00 | ||||
| 2021-04-28 |
|
4 | KNBE |
KnowBe4, Inc.
Common Stock |
J - Other | -31,152,880 | 0 | -100.00 | ||||
| 2021-04-28 |
|
4 | KNBE |
KnowBe4, Inc.
Common Stock |
C - Conversion | 26,438,760 | 31,152,880 | 560.84 | ||||
| 2021-04-28 |
|
4 | KNBE |
KnowBe4, Inc.
Common Stock |
C - Conversion | 4,431,800 | 4,714,120 | 1,569.78 | ||||
| 2021-04-26 |
|
4 | BCPL |
BC Partners Lending Corp
Common Stock |
P - Purchase | 11,433 | 413,949 | 2.84 | 26.24 | 300,000 | 10,862,030 | |
| 2021-04-21 |
|
4 | APP |
Applovin Corp
Class B Common Stock |
C - Conversion | -2,500,000 | 108,050,489 | -2.26 | ||||
| 2021-04-21 |
|
4 | APP |
Applovin Corp
Class B Common Stock |
C - Conversion | 109,090,908 | 110,550,489 | 7,474.12 | ||||
| 2021-04-21 |
|
4 | APP |
Applovin Corp
Series A Preferred Stock |
C - Conversion | -109,090,908 | 0 | -100.00 | ||||
| 2021-04-21 |
|
4 | APP |
Applovin Corp
Class A Common Stock |
S - Sale | -2,500,000 | 0 | -100.00 | 77.90 | -194,760,000 | ||
| 2021-04-21 |
|
4 | APP |
Applovin Corp
Class A Common Stock |
C - Conversion | 2,500,000 | 2,500,000 | |||||
| 2021-04-21 | 3 | KNBE |
KnowBe4, Inc.
Common Stock |
282,320 | ||||||||
| 2021-04-09 |
|
4 | ASO |
Academy Sports & Outdoors, Inc.
Common Stock |
S - Sale | -3,601,091 | 19,332,496 | -15.70 | 28.48 | -102,559,072 | 550,589,486 | |
| 2021-04-09 |
|
4 | ASO |
Academy Sports & Outdoors, Inc.
Common Stock |
S - Sale | -2,788,392 | 14,969,509 | -15.70 | 28.48 | -79,413,404 | 426,331,616 | |
| 2021-04-09 |
|
4 | ASO |
Academy Sports & Outdoors, Inc.
Common Stock |
S - Sale | -1,405,157 | 7,543,597 | -15.70 | 28.48 | -40,018,871 | 214,841,643 | |
| 2021-03-30 |
|
4 | LAUR |
LAUREATE EDUCATION, INC.
Class B Common Stock |
C - Conversion | -190,525 | 762,098 | -20.00 | ||||
| 2021-03-30 |
|
4 | LAUR |
LAUREATE EDUCATION, INC.
Class B Common Stock |
C - Conversion | -4,577,995 | 18,311,957 | -20.00 | ||||
| 2021-03-30 |
|
4 | LAUR |
LAUREATE EDUCATION, INC.
Class A Common Stock |
C - Conversion | 190,525 | 288,021 | 195.42 | ||||
| 2021-03-30 |
|
4 | LAUR |
LAUREATE EDUCATION, INC.
Class A Common Stock |
C - Conversion | 4,577,995 | 13,480,107 | 51.43 | ||||
| 2021-03-30 |
|
4 | COOP |
Mr. Cooper Group Inc.
Common Stock |
S - Sale | -3,257,588 | 9,749,189 | -25.05 | 32.25 | -105,057,213 | 314,411,345 | |
| 2021-03-30 |
|
4 | COOP |
Mr. Cooper Group Inc.
Common Stock |
S - Sale | -442,412 | 1,324,056 | -25.05 | 32.25 | -14,267,787 | 42,700,806 | |
| 2021-03-18 |
|
4 | FOCS |
Focus Financial Partners Inc.
Units of Focus Financial Partners, LLC |
C - Conversion | -155,558 | 3,654,044 | -4.08 | ||||
| 2021-03-18 |
|
4 | FOCS |
Focus Financial Partners Inc.
Class A Common Stock |
S - Sale | -17,182 | 403,615 | -4.08 | 46.20 | -793,808 | 18,647,013 | |
| 2021-03-18 |
|
4 | FOCS |
Focus Financial Partners Inc.
Class A Common Stock |
S - Sale | -131,401 | 3,086,585 | -4.08 | 46.20 | -6,070,726 | 142,600,227 | |
| 2021-03-18 |
|
4 | FOCS |
Focus Financial Partners Inc.
Class A Common Stock |
S - Sale | -155,558 | 0 | -100.00 | 46.20 | -7,186,780 | ||
| 2021-03-18 |
|
4 | FOCS |
Focus Financial Partners Inc.
Class A Common Stock |
C - Conversion | 155,558 | 155,558 | |||||
| 2021-03-03 |
|
4 | FOCS |
Focus Financial Partners Inc.
Units of Focus Financial Partners, LLC |
C - Conversion | -574,400 | 3,809,602 | -13.10 | ||||
| 2021-03-03 |
|
4 | FOCS |
Focus Financial Partners Inc.
Class A Common Stock |
S - Sale | -117,251 | 420,797 | -21.79 | 46.20 | -5,416,996 | 19,440,821 | |
| 2021-03-03 |
|
4 | FOCS |
Focus Financial Partners Inc.
Class A Common Stock |
S - Sale | -896,661 | 3,217,986 | -21.79 | 46.20 | -41,425,738 | 148,670,953 | |
| 2021-03-03 |
|
4 | FOCS |
Focus Financial Partners Inc.
Class A Common Stock |
S - Sale | -1,061,512 | 0 | -100.00 | 46.20 | -49,041,854 | ||
| 2021-03-03 |
|
4 | FOCS |
Focus Financial Partners Inc.
Class A Common Stock |
C - Conversion | 574,400 | 1,061,512 | 117.92 | ||||
| 2021-03-02 |
|
4 | KREF |
KKR Real Estate Finance Trust Inc.
Common Stock |
S - Sale | -177,408 | 0 | -100.00 | 18.71 | -3,319,304 | ||
| 2021-03-02 |
|
4 | KREF |
KKR Real Estate Finance Trust Inc.
Common Stock |
S - Sale | -72,510 | 177,408 | -29.01 | 18.52 | -1,342,885 | 3,285,596 | |
| 2021-02-25 |
|
4 | KREF |
KKR Real Estate Finance Trust Inc.
Common Stock |
S - Sale | -135,300 | 249,918 | -35.12 | 18.78 | -2,540,934 | 4,693,460 | |
| 2021-02-25 |
|
4 | KREF |
KKR Real Estate Finance Trust Inc.
Common Stock |
S - Sale | -288,270 | 385,218 | -42.80 | 18.95 | -5,462,716 | 7,299,881 | |
| 2021-02-25 |
|
4 | KREF |
KKR Real Estate Finance Trust Inc.
Common Stock |
S - Sale | -23,947 | 673,488 | -3.43 | 18.50 | -443,020 | 12,459,528 | |
| 2021-02-22 |
|
4 | KREF |
KKR Real Estate Finance Trust Inc.
Common Stock |
S - Sale | -31,564 | 697,435 | -4.33 | 18.62 | -587,722 | 12,986,240 | |
| 2021-02-22 |
|
4 | KREF |
KKR Real Estate Finance Trust Inc.
Common Stock |
S - Sale | -104,607 | 728,999 | -12.55 | 18.58 | -1,943,598 | 13,544,801 | |
| 2021-02-22 |
|
4 | KREF |
KKR Real Estate Finance Trust Inc.
Common Stock |
S - Sale | -4,111 | 833,606 | -0.49 | 18.50 | -76,054 | 15,421,711 | |
| 2021-02-19 | 3 | NONE |
KKR Credit Opportunities Portfolio
Class I Shares of Beneficial Interest |
2,040,000 | ||||||||
| 2021-02-19 |
|
4 | NONE |
KKR Credit Opportunities Portfolio
Class I Shares of Beneficial Interest |
P - Purchase | 1,960,000 | 4,000,000 | 96.08 | 25.00 | 49,000,000 | 100,000,000 | |
| 2021-02-17 |
|
4 | BBIO |
BridgeBio Pharma, Inc.
Common Stock |
S - Sale | -3,450,000 | 31,060,971 | -10.00 | 60.47 | -208,617,360 | 1,878,219,643 | |
| 2021-02-17 |
|
4 | KREF |
KKR Real Estate Finance Trust Inc.
Common Stock |
S - Sale | -19,524 | 837,717 | -2.28 | 18.51 | -361,389 | 15,506,142 | |
| 2021-02-17 |
|
4 | KREF |
KKR Real Estate Finance Trust Inc.
Common Stock |
S - Sale | -85,920 | 857,241 | -9.11 | 18.95 | -1,628,184 | 16,244,717 | |
| 2021-02-17 |
|
4 | KREF |
KKR Real Estate Finance Trust Inc.
Common Stock |
S - Sale | -76,101 | 943,161 | -7.47 | 18.73 | -1,425,372 | 17,665,406 | |
| 2021-02-12 |
|
4 | KKR |
KKR & Co. Inc.
Common Stock |
G - Gift | -1,000,000 | 7,000,000 | -12.50 | ||||
| 2021-02-12 |
|
4 | KKR |
KKR & Co. Inc.
Common Stock |
G - Gift | -1,000,000 | 8,000,000 | -11.11 | ||||
| 2021-02-11 | 3 | BCPL |
BC Partners Lending Corp
Common Stock |
402,516 | ||||||||
| 2021-02-11 |
|
4 | KREF |
KKR Real Estate Finance Trust Inc.
Common Stock |
S - Sale | -174,920 | 1,019,262 | -14.65 | 18.61 | -3,255,261 | 18,968,466 | |
| 2021-02-11 |
|
4 | KREF |
KKR Real Estate Finance Trust Inc.
Common Stock |
S - Sale | -35,676 | 1,194,182 | -2.90 | 18.66 | -665,714 | 22,283,436 | |
| 2021-02-11 |
|
4 | KREF |
KKR Real Estate Finance Trust Inc.
Common Stock |
S - Sale | -4,670 | 1,229,858 | -0.38 | 18.55 | -86,628 | 22,813,866 | |
| 2021-02-03 |
|
4 | ASO |
Academy Sports & Outdoors, Inc.
Common Stock |
S - Sale | -5,519,492 | 22,933,587 | -19.40 | 20.69 | -114,219,264 | 474,583,063 | |
| 2021-02-03 |
|
4 | ASO |
Academy Sports & Outdoors, Inc.
Common Stock |
S - Sale | -4,273,845 | 17,757,901 | -19.40 | 20.69 | -88,442,094 | 367,478,452 | |
| 2021-02-03 |
|
4 | ASO |
Academy Sports & Outdoors, Inc.
Common Stock |
S - Sale | -2,153,722 | 8,948,754 | -19.40 | 20.69 | -44,568,692 | 185,183,726 | |
| 2020-12-31 |
|
4 | COTY |
COTY INC.
Series B Convertible Preferred Stock |
S - Sale | -146,057 | 0 | -100.00 | 1,027.00 | -150,000,539 | ||
| 2020-12-31 |
|
4 | COTY |
COTY INC.
Series B Convertible Preferred Stock |
J - Other | -146,057 | 853,943 | -14.61 | ||||
| 2020-12-30 |
|
4 | KREF |
KKR Real Estate Finance Trust Inc.
Common Stock |
S - Sale | -17,182 | 1,234,528 | -1.37 | 18.51 | -318,039 | 22,851,113 | |
| 2020-12-30 |
|
4 | KREF |
KKR Real Estate Finance Trust Inc.
Common Stock |
S - Sale | -43,791 | 1,251,710 | -3.38 | 18.54 | -811,885 | 23,206,703 | |
| 2020-12-21 |
|
4 | KREF |
KKR Real Estate Finance Trust Inc.
Common Stock |
S - Sale | -13,291 | 1,295,501 | -1.02 | 18.55 | -246,548 | 24,031,544 | |
| 2020-12-21 |
|
4 | KREF |
KKR Real Estate Finance Trust Inc.
Common Stock |
S - Sale | -73,619 | 1,308,792 | -5.33 | 18.54 | -1,364,896 | 24,265,004 | |
| 2020-12-16 |
|
4 | KREF |
KKR Real Estate Finance Trust Inc.
Common Stock |
S - Sale | -39,847 | 1,382,411 | -2.80 | 18.54 | -738,763 | 25,629,900 | |
| 2020-12-16 |
|
4 | KREF |
KKR Real Estate Finance Trust Inc.
Common Stock |
S - Sale | -24,187 | 1,422,258 | -1.67 | 18.71 | -452,539 | 26,610,447 | |
| 2020-12-16 |
|
4 | KREF |
KKR Real Estate Finance Trust Inc.
Common Stock |
S - Sale | -9,139 | 1,446,445 | -0.63 | 18.51 | -169,163 | 26,773,697 | |
| 2020-12-14 |
|
4 | FISV |
FISERV INC
Common Stock |
S - Sale | -20,125,000 | 85,300,667 | -19.09 | 110.04 | -2,214,555,000 | 9,386,485,397 | |
| 2020-12-09 |
|
4 | KREF |
KKR Real Estate Finance Trust Inc.
Common Stock |
S - Sale | -1,371 | 1,455,584 | -0.09 | 18.67 | -25,597 | 27,175,753 | |
| 2020-12-09 |
|
4 | KREF |
KKR Real Estate Finance Trust Inc.
Common Stock |
S - Sale | -27,865 | 1,456,955 | -1.88 | 18.60 | -518,289 | 27,099,363 | |
| 2020-12-09 |
|
4 | KREF |
KKR Real Estate Finance Trust Inc.
Common Stock |
S - Sale | -27,566 | 1,484,820 | -1.82 | 18.53 | -510,798 | 27,513,715 | |
| 2020-12-04 |
|
4 | KREF |
KKR Real Estate Finance Trust Inc.
Common Stock |
S - Sale | -41,032 | 1,512,386 | -2.64 | 18.55 | -761,144 | 28,054,760 | |
| 2020-12-04 |
|
4 | KREF |
KKR Real Estate Finance Trust Inc.
Common Stock |
S - Sale | -24,402 | 1,553,418 | -1.55 | 18.53 | -452,169 | 28,784,836 | |
| 2020-12-02 |
|
4 | KREF |
KKR Real Estate Finance Trust Inc.
Common Stock |
S - Sale | -32,944 | 1,577,820 | -2.05 | 18.53 | -610,452 | 29,237,005 | |
| 2020-12-02 |
|
4 | KREF |
KKR Real Estate Finance Trust Inc.
Common Stock |
S - Sale | -6,353 | 1,610,764 | -0.39 | 18.57 | -117,975 | 29,911,887 | |
| 2020-12-02 |
|
4 | KREF |
KKR Real Estate Finance Trust Inc.
Common Stock |
S - Sale | -18,950 | 1,617,117 | -1.16 | 18.50 | -350,575 | 29,916,664 | |
| 2020-11-27 |
|
4 | KREF |
KKR Real Estate Finance Trust Inc.
Common Stock |
S - Sale | -7,258 | 1,636,067 | -0.44 | 18.50 | -134,273 | 30,267,240 | |
| 2020-11-27 |
|
4 | KREF |
KKR Real Estate Finance Trust Inc.
Common Stock |
S - Sale | -100,900 | 1,643,325 | -5.78 | 18.51 | -1,867,659 | 30,417,946 | |
| 2020-11-19 |
|
4 | KREF |
KKR Real Estate Finance Trust Inc.
Common Stock |
S - Sale | -9,824 | 1,744,225 | -0.56 | 18.55 | -182,235 | 32,355,374 | |
| 2020-11-19 |
|
4 | KREF |
KKR Real Estate Finance Trust Inc.
Common Stock |
S - Sale | -27,684 | 1,754,049 | -1.55 | 18.50 | -512,154 | 32,449,906 | |
| 2020-11-12 |
|
4 | KREF |
KKR Real Estate Finance Trust Inc.
Common Stock |
S - Sale | -76,623 | 1,781,733 | -4.12 | 18.52 | -1,419,058 | 32,997,695 | |
| 2020-10-02 |
|
4 | TGAN |
Transphorm, Inc.
Common Stock |
J - Other | 0 | 21,175,980 | 0.00 | ||||
| 2020-10-02 | 3 | ASO |
Academy Sports & Outdoors, Inc.
Common Stock |
11,102,476 | ||||||||
| 2020-10-02 | 3 | ASO |
Academy Sports & Outdoors, Inc.
Common Stock |
22,031,746 | ||||||||
| 2020-10-02 | 3 | ASO |
Academy Sports & Outdoors, Inc.
Common Stock |
28,453,079 | ||||||||
| 2020-09-18 |
|
4 | KREF |
KKR Real Estate Finance Trust Inc.
Common Stock |
S - Sale | -94,200 | 1,858,356 | -4.82 | 18.56 | -1,748,352 | 34,491,087 | |
| 2020-09-10 |
|
4 | KREF |
KKR Real Estate Finance Trust Inc.
Common Stock |
S - Sale | -2,623 | 1,952,556 | -0.13 | 18.51 | -48,552 | 36,141,812 | |
| 2020-09-10 |
|
4 | KREF |
KKR Real Estate Finance Trust Inc.
Common Stock |
S - Sale | -16,690 | 1,955,179 | -0.85 | 18.51 | -308,932 | 36,190,363 | |
| 2020-09-10 |
|
4 | KREF |
KKR Real Estate Finance Trust Inc.
Common Stock |
S - Sale | -16,090 | 1,971,869 | -0.81 | 18.51 | -297,826 | 36,499,295 | |
| 2020-09-03 |
|
4 | KREF |
KKR Real Estate Finance Trust Inc.
Common Stock |
S - Sale | -20,657 | 1,987,959 | -1.03 | 18.50 | -382,154 | 36,777,242 | |
| 2020-08-21 |
|
4 | FISV |
FISERV INC
Common Stock |
S - Sale | -5,000,000 | 105,425,667 | -4.53 | 98.00 | -490,000,000 | 10,331,715,366 | |
| 2020-07-30 |
|
4 | COTY |
COTY INC.
Series B Preferred Stock |
J - Other | -4,785 | 1,000,000 | -0.48 | ||||
| 2020-07-30 |
|
4 | COTY |
COTY INC.
Series B Preferred Stock |
J - Other | -179,500 | 1,000,000 | -15.22 | ||||
| 2020-06-23 |
|
4 | IR |
Ingersoll Rand Inc.
Common Stock |
S - Sale | -12,100,000 | 44,788,635 | -21.27 | 30.40 | -367,840,000 | 1,361,574,504 | |
| 2020-06-18 |
|
4 | SONO |
Sonos Inc
Common Stock |
S - Sale | -13,845,682 | 0 | -100.00 | 13.00 | -179,993,866 | ||
| 2020-06-17 |
|
4 | BV |
BrightView Holdings, Inc.
Common Stock |
S - Sale | -7,785,123 | 50,633,123 | -13.33 | 13.25 | -103,152,880 | 670,888,880 | |
| 2020-06-01 |
|
4 | BBIO |
BridgeBio Pharma, Inc.
Common Stock |
S - Sale | -2,389,690 | 34,510,971 | -6.48 | 33.39 | -79,791,749 | 1,152,321,322 | |
| 2020-05-29 |
|
4 | IR |
Ingersoll Rand Inc.
Common Stock |
S - Sale | -13,782,500 | 56,888,635 | -19.50 | 28.82 | -397,211,650 | 1,639,530,461 | |
| 2020-03-13 |
|
4 | NONE |
Transphorm, Inc.
Common Stock |
P - Purchase | 1,250,000 | 21,175,980 | 6.27 | 4.00 | 5,000,000 | 84,703,920 | |
| 2020-03-13 | 3 | NONE |
Transphorm, Inc.
Common Stock |
39,851,960 | ||||||||
| 2020-03-13 | 3 | NONE |
Transphorm, Inc.
Common Stock |
39,851,960 | ||||||||
| 2020-03-13 | 3 | NONE |
Transphorm, Inc.
Common Stock |
39,851,960 | ||||||||
| 2020-03-13 | 3 | NONE |
Transphorm, Inc.
Common Stock |
39,851,960 | ||||||||
| 2020-03-13 | 3 | NONE |
Transphorm, Inc.
Common Stock |
39,851,960 | ||||||||
| 2020-03-13 | 3 | NONE |
Transphorm, Inc.
Common Stock |
39,851,960 | ||||||||
| 2020-03-13 | 3 | NONE |
Transphorm, Inc.
Common Stock |
39,851,960 | ||||||||
| 2020-03-13 | 3 | NONE |
Transphorm, Inc.
Common Stock |
39,851,960 | ||||||||
| 2020-03-13 | 3 | NONE |
Transphorm, Inc.
Common Stock |
39,851,960 | ||||||||
| 2020-03-13 | 3 | NONE |
Transphorm, Inc.
Common Stock |
39,851,960 | ||||||||
| 2020-02-21 |
|
4 | SONO |
Sonos Inc
Common Stock |
S - Sale | -8,000,000 | 13,845,682 | -36.62 | 13.42 | -107,360,000 | 185,809,052 | |
| 2020-01-29 |
|
4 | KRP |
Kimbell Royalty Partners, LP
OpCo Units |
C - Conversion | 266,076 | 0 | -100.00 | ||||
| 2020-01-29 |
|
4 | KRP |
Kimbell Royalty Partners, LP
OpCo Units |
C - Conversion | 3,897,483 | 0 | -100.00 | ||||
| 2020-01-29 |
|
4 | KRP |
Kimbell Royalty Partners, LP
Common units representing limited partner interests |
C - Conversion | 266,076 | 266,076 | |||||
| 2020-01-29 |
|
4 | KRP |
Kimbell Royalty Partners, LP
Common units representing limited partner interests |
C - Conversion | 3,897,483 | 3,897,483 | |||||
| 2020-01-29 |
|
4 | KRP |
Kimbell Royalty Partners, LP
Common units representing limited partner interests |
S - Sale | -47,929 | 0 | -100.00 | 14.80 | -709,469 | ||
| 2020-01-29 |
|
4 | KRP |
Kimbell Royalty Partners, LP
Common units representing limited partner interests |
S - Sale | -702,071 | 0 | -100.00 | 14.80 | -10,392,406 | ||
| 2020-01-29 |
|
4 | KRP |
Kimbell Royalty Partners, LP
OpCo Units |
C - Conversion | 47,929 | 266,076 | 21.97 | ||||
| 2020-01-29 |
|
4 | KRP |
Kimbell Royalty Partners, LP
OpCo Units |
C - Conversion | 702,071 | 3,897,483 | 21.97 | ||||
| 2020-01-29 |
|
4 | KRP |
Kimbell Royalty Partners, LP
Common units representing limited partner interests |
C - Conversion | 47,929 | 47,929 | |||||
| 2020-01-29 |
|
4 | KRP |
Kimbell Royalty Partners, LP
Common units representing limited partner interests |
C - Conversion | 702,071 | 702,071 | |||||
| 2019-11-04 |
|
4 | OYST |
Oyster Point Pharma, Inc.
Series B Convertible Preferred Stock |
C - Conversion | -884,622 | 0 | -100.00 | ||||
| 2019-11-04 |
|
4 | OYST |
Oyster Point Pharma, Inc.
Common Stock, par value $0.001 per share |
P - Purchase | 155,000 | 1,039,622 | 17.52 | 16.00 | 2,480,000 | 16,633,952 | |
| 2019-11-04 |
|
4 | OYST |
Oyster Point Pharma, Inc.
Common Stock, par value $0.001 per share |
C - Conversion | 884,622 | 884,622 | |||||
| 2019-09-10 |
|
4 | PRAH |
PRA Health Sciences, Inc.
Common Stock |
J - Other | -29,300 | 0 | -100.00 | ||||
| 2019-09-10 |
|
4 | PRAH |
PRA Health Sciences, Inc.
Common Stock |
S - Sale | -6,666,684 | 29,300 | -99.56 | 97.41 | -649,401,688 | 2,854,113 | |
| 2019-08-14 |
|
4 | EYE |
National Vision Holdings, Inc.
Common Stock |
S - Sale | -9,149,908 | 0 | -100.00 | 30.52 | -279,255,192 | ||
| 2019-08-06 | 3 | FISV |
FISERV INC
Common Stock |
220,851,334 | ||||||||
| 2019-08-06 | 3 | FISV |
FISERV INC
Common Stock |
220,851,334 | ||||||||
| 2019-08-06 | 3 | FISV |
FISERV INC
Common Stock |
220,851,334 | ||||||||
| 2019-08-06 | 3 | FISV |
FISERV INC
Common Stock |
220,851,334 | ||||||||
| 2019-08-06 | 3 | FISV |
FISERV INC
Common Stock |
220,851,334 | ||||||||
| 2019-08-06 | 3 | FISV |
FISERV INC
Common Stock |
220,851,334 | ||||||||
| 2019-08-06 | 3 | FISV |
FISERV INC
Common Stock |
220,851,334 | ||||||||
| 2019-08-06 | 3 | FISV |
FISERV INC
Common Stock |
220,851,334 | ||||||||
| 2019-08-06 | 3 | FISV |
FISERV INC
Common Stock |
220,851,334 | ||||||||
| 2019-08-02 |
|
4 | KKR |
KKR & Co. Inc.
Class A Common Stock |
G - Gift | -1,000,000 | 9,000,000 | -10.00 | ||||
| 2019-07-29 |
|
4 | FDC |
FIRST DATA CORP
Units in Director Deferred Compensation Plan |
D - Sale to Issuer | -31,425 | 0 | -100.00 | ||||
| 2019-07-29 |
|
4 | FDC |
FIRST DATA CORP
Class B Common Stock |
J - Other | -364,441,146 | 0 | -100.00 | ||||
| 2019-07-03 |
|
4 | BBIO |
BridgeBio Pharma, Inc.
Series D Preferred Units |
C - Conversion | -50,446,451 | 0 | -100.00 | ||||
| 2019-07-03 |
|
4 | BBIO |
BridgeBio Pharma, Inc.
Series C Preferred Units |
C - Conversion | -36,246,893 | 0 | -100.00 | ||||
| 2019-07-03 |
|
4 | BBIO |
BridgeBio Pharma, Inc.
Series B Preferred Units |
C - Conversion | -81,022,727 | 0 | -100.00 | ||||
| 2019-07-03 |
|
4 | BBIO |
BridgeBio Pharma, Inc.
Common Stock |
P - Purchase | 2,647,100 | 36,900,661 | 7.73 | 17.00 | 45,000,700 | 627,311,237 | |
| 2019-07-03 |
|
4 | BBIO |
BridgeBio Pharma, Inc.
Common Stock |
C - Conversion | 34,253,561 | 34,253,561 | |||||
| 2019-07-02 |
|
4 | FDC |
FIRST DATA CORP
Units in Director Deferred Compensation Plan |
A - Award | 728 | 31,425 | 2.37 | 27.48 | 20,000 | 863,562 | |
| 2019-01-16 |
|
4 | EGL |
Engility Holdings, Inc.
Common Stock, par value $0.01 per share |
J - Other | -8,960,446 | 0 | -100.00 | ||||
| 2019-01-03 |
|
4 | FDC |
FIRST DATA CORP
Units in Director Deferred Compensation Plan |
A - Award | 1,174 | 30,697 | 3.98 | 17.04 | 20,000 | 523,082 | |
| 2018-11-21 |
|
4 | EYE |
National Vision Holdings, Inc.
Common Stock |
S - Sale | -10,054,259 | 9,149,908 | -52.35 | 40.20 | -404,181,212 | 367,826,302 | |
| 2018-11-19 |
|
4 | KREF |
KKR Real Estate Finance Trust Inc.
Common Stock |
S - Sale | -1,750,000 | 2,008,616 | -46.56 | 20.00 | -35,000,000 | 40,172,320 | |
| 2018-11-16 |
|
4 | KKR |
KKR & Co. Inc.
Class A Common Stock |
G - Gift | -1,000,000 | 10,000,000 | -9.09 | ||||
| 2018-11-05 |
|
4 | GDI |
GARDNER DENVER HOLDINGS, INC.
Common Stock |
J - Other | -50,274 | 70,671,135 | -0.07 | ||||
| 2018-11-05 |
|
4 | GDI |
GARDNER DENVER HOLDINGS, INC.
Common Stock |
S - Sale | -20,000,000 | 70,721,409 | -22.05 | 25.66 | -513,200,000 | 1,814,711,355 | |
| 2018-09-25 |
|
4 | KRP |
Kimbell Royalty Partners, LP
OpCo Units |
J - Other | 314,005 | 314,005 | |||||
| 2018-09-25 |
|
4 | KRP |
Kimbell Royalty Partners, LP
OpCo Units |
J - Other | 4,599,554 | 4,599,554 | |||||
| 2018-09-25 |
|
4 | KRP |
Kimbell Royalty Partners, LP
Common units representing limited partner interests |
J - Other | -314,005 | 0 | -100.00 | ||||
| 2018-09-25 |
|
4 | KRP |
Kimbell Royalty Partners, LP
Common units representing limited partner interests |
J - Other | -4,599,554 | 0 | -100.00 | ||||
| 2018-08-31 |
|
4 | RNET |
RigNet, Inc.
Common Stock |
P - Purchase | 14,132 | 5,000,254 | 0.28 | 15.93 | 225,123 | 79,654,046 | |
| 2018-08-31 |
|
4 | RNET |
RigNet, Inc.
Common Stock |
P - Purchase | 17,883 | 4,986,122 | 0.36 | 15.99 | 285,949 | 79,728,091 | |
| 2018-08-31 |
|
4 | RNET |
RigNet, Inc.
Common Stock |
P - Purchase | 10,074 | 4,968,239 | 0.20 | 15.98 | 160,983 | 79,392,459 | |
| 2018-08-29 |
|
4 | RNET |
RigNet, Inc.
Common Stock |
P - Purchase | 35,399 | 4,958,165 | 0.72 | 15.98 | 565,676 | 79,231,477 | |
| 2018-08-29 |
|
4 | RNET |
RigNet, Inc.
Common Stock |
P - Purchase | 11,806 | 4,922,766 | 0.24 | 15.99 | 188,778 | 78,715,028 | |
| 2018-08-23 |
|
4 | RNET |
RigNet, Inc.
Common Stock |
P - Purchase | 16,817 | 4,910,960 | 0.34 | 15.79 | 265,540 | 77,544,058 | |
| 2018-08-23 |
|
4 | RNET |
RigNet, Inc.
Common Stock |
P - Purchase | 41,060 | 4,894,143 | 0.85 | 15.11 | 620,417 | 73,950,501 | |
| 2018-08-20 |
|
4 | FDC |
FIRST DATA CORP
Class B Common Stock |
S - Sale | -73,600,000 | 364,441,146 | -16.80 | 23.22 | -1,708,668,160 | 8,460,719,869 | |
| 2018-08-20 |
|
4 | RNET |
RigNet, Inc.
Common Stock |
P - Purchase | 30,076 | 4,853,083 | 0.62 | 14.14 | 425,275 | 68,622,594 | |
| 2018-08-20 |
|
4 | RNET |
RigNet, Inc.
Common Stock |
P - Purchase | 8,576 | 4,823,007 | 0.18 | 13.98 | 119,892 | 67,425,638 | |
| 2018-08-20 |
|
4 | RNET |
RigNet, Inc.
Common Stock |
P - Purchase | 6,264 | 4,814,431 | 0.13 | 14.00 | 87,696 | 67,402,034 | |
| 2018-08-20 |
|
4 | GDDY |
GoDaddy Inc.
Units of Desert Newco, LLC |
C - Conversion | -38,880 | 29,374 | -56.96 | ||||
| 2018-08-20 |
|
4 | GDDY |
GoDaddy Inc.
Units of Desert Newco, LLC |
C - Conversion | -178,047 | 134,515 | -56.96 | ||||
| 2018-08-20 |
|
4 | GDDY |
GoDaddy Inc.
Units of Desert Newco, LLC |
C - Conversion | -1,617,609 | 1,222,099 | -56.96 | ||||
| 2018-08-20 |
|
4 | GDDY |
GoDaddy Inc.
Class A Common Stock |
S - Sale | -38,880 | 8,050 | -82.85 | 75.61 | -2,939,717 | 608,660 | |
| 2018-08-20 |
|
4 | GDDY |
GoDaddy Inc.
Class A Common Stock |
C - Conversion | 38,880 | 46,930 | 482.98 | ||||
| 2018-08-20 |
|
4 | GDDY |
GoDaddy Inc.
Class A Common Stock |
S - Sale | -178,047 | 36,864 | -82.85 | 75.61 | -13,462,134 | 2,787,287 | |
| 2018-08-20 |
|
4 | GDDY |
GoDaddy Inc.
Class A Common Stock |
C - Conversion | 178,047 | 214,911 | 482.98 | ||||
| 2018-08-20 |
|
4 | GDDY |
GoDaddy Inc.
Class A Common Stock |
S - Sale | -1,617,609 | 374,147 | -81.22 | 75.61 | -122,307,416 | 28,289,255 | |
| 2018-08-20 |
|
4 | GDDY |
GoDaddy Inc.
Class A Common Stock |
C - Conversion | 1,617,609 | 1,991,756 | 432.35 | ||||
| 2018-08-20 |
|
4 | GDDY |
GoDaddy Inc.
Class A Common Stock |
S - Sale | -544,323 | 457,523 | -54.33 | 75.61 | -41,156,262 | 34,593,314 | |
| 2018-08-20 |
|
4 | GDDY |
GoDaddy Inc.
Class A Common Stock |
S - Sale | -1,121,141 | 1,106,336 | -50.33 | 75.61 | -84,769,471 | 83,650,065 | |
| 2018-08-15 |
|
4 | RNET |
RigNet, Inc.
Common Stock |
P - Purchase | 25,773 | 4,808,167 | 0.54 | 13.50 | 347,936 | 64,910,254 | |
| 2018-08-15 |
|
4 | RNET |
RigNet, Inc.
Common Stock |
P - Purchase | 18,992 | 4,782,394 | 0.40 | 13.82 | 262,469 | 66,092,685 | |
| 2018-08-15 |
|
4 | RNET |
RigNet, Inc.
Common Stock |
P - Purchase | 13,402 | 4,763,402 | 0.28 | 13.48 | 180,659 | 64,210,659 | |
| 2018-08-13 |
|
4 | PRAH |
PRA Health Sciences, Inc.
Common Stock |
S - Sale | -6,500,000 | 6,695,984 | -49.26 | 101.01 | -656,565,000 | 676,361,344 | |
| 2018-08-08 |
|
4 | SONO |
Sonos Inc
Common Stock |
S - Sale | -2,030,892 | 21,845,682 | -8.51 | 14.18 | -28,787,894 | 309,662,542 | |
| 2018-08-06 |
|
4 | EYE |
National Vision Holdings, Inc.
Common Stock |
S - Sale | -1,742,007 | 19,204,167 | -8.32 | 38.26 | -66,648,143 | 734,739,907 | |
| 2018-08-02 |
|
4 | WMIH |
WMIH CORP.
Warrants |
S - Sale | -30,700,000 | 0 | -100.00 | ||||
| 2018-08-02 |
|
4 | WMIH |
WMIH CORP.
Warrants |
S - Sale | -30,700,000 | 0 | -100.00 | ||||
| 2018-08-02 |
|
4 | WMIH |
WMIH CORP.
Series B Convertible Preferred Stock |
C - Conversion | -200,000 | 0 | -100.00 | ||||
| 2018-08-02 |
|
4 | WMIH |
WMIH CORP.
Common Stock |
P - Purchase | 21,197,619 | 21,197,619 | |||||
| 2018-08-02 |
|
4 | WMIH |
WMIH CORP.
Common Stock |
C - Conversion | 148,148,148 | 156,081,323 | 1,867.45 | 1.35 | 200,000,000 | 210,709,786 | |
| 2018-08-01 | 3 | FOCS |
Focus Financial Partners Inc.
Class A Common Stock |
5,626,919 | ||||||||
| 2018-08-01 | 3 | FOCS |
Focus Financial Partners Inc.
Class A Common Stock |
9,254,454 | ||||||||
| 2018-08-01 | 3 | FOCS |
Focus Financial Partners Inc.
Class A Common Stock |
5,677,855 | ||||||||
| 2018-08-01 | 3 | FOCS |
Focus Financial Partners Inc.
Class A Common Stock |
5,626,919 | ||||||||
| 2018-08-01 | 3 | FOCS |
Focus Financial Partners Inc.
Class A Common Stock |
9,254,454 | ||||||||
| 2018-08-01 | 3 | FOCS |
Focus Financial Partners Inc.
Class A Common Stock |
5,677,855 | ||||||||
| 2018-08-01 | 3 | FOCS |
Focus Financial Partners Inc.
Class A Common Stock |
5,626,919 | ||||||||
| 2018-08-01 | 3 | FOCS |
Focus Financial Partners Inc.
Class A Common Stock |
9,254,454 | ||||||||
| 2018-08-01 | 3 | FOCS |
Focus Financial Partners Inc.
Class A Common Stock |
5,677,855 | ||||||||
| 2018-08-01 | 3 | FOCS |
Focus Financial Partners Inc.
Class A Common Stock |
5,626,919 | ||||||||
| 2018-08-01 | 3 | FOCS |
Focus Financial Partners Inc.
Class A Common Stock |
9,254,454 | ||||||||
| 2018-08-01 | 3 | FOCS |
Focus Financial Partners Inc.
Class A Common Stock |
5,677,855 | ||||||||
| 2018-08-01 | 3 | FOCS |
Focus Financial Partners Inc.
Class A Common Stock |
5,626,919 | ||||||||
| 2018-08-01 | 3 | FOCS |
Focus Financial Partners Inc.
Class A Common Stock |
9,254,454 | ||||||||
| 2018-08-01 | 3 | FOCS |
Focus Financial Partners Inc.
Class A Common Stock |
5,677,855 | ||||||||
| 2018-08-01 | 3 | FOCS |
Focus Financial Partners Inc.
Class A Common Stock |
5,626,919 | ||||||||
| 2018-08-01 | 3 | FOCS |
Focus Financial Partners Inc.
Class A Common Stock |
9,254,454 | ||||||||
| 2018-08-01 | 3 | FOCS |
Focus Financial Partners Inc.
Class A Common Stock |
5,677,855 | ||||||||
| 2018-08-01 | 3 | FOCS |
Focus Financial Partners Inc.
Class A Common Stock |
5,626,919 | ||||||||
| 2018-08-01 | 3 | FOCS |
Focus Financial Partners Inc.
Class A Common Stock |
9,254,454 | ||||||||
| 2018-08-01 | 3 | FOCS |
Focus Financial Partners Inc.
Class A Common Stock |
5,677,855 | ||||||||
| 2018-08-01 | 3 | FOCS |
Focus Financial Partners Inc.
Class A Common Stock |
5,626,919 | ||||||||
| 2018-08-01 | 3 | FOCS |
Focus Financial Partners Inc.
Class A Common Stock |
9,254,454 | ||||||||
| 2018-08-01 | 3 | FOCS |
Focus Financial Partners Inc.
Class A Common Stock |
5,677,855 | ||||||||
| 2018-08-01 | 3 | FOCS |
Focus Financial Partners Inc.
Class A Common Stock |
5,626,919 | ||||||||
| 2018-08-01 | 3 | FOCS |
Focus Financial Partners Inc.
Class A Common Stock |
9,254,454 | ||||||||
| 2018-08-01 | 3 | FOCS |
Focus Financial Partners Inc.
Class A Common Stock |
5,677,855 | ||||||||
| 2018-08-01 | 3 | FOCS |
Focus Financial Partners Inc.
Class A Common Stock |
5,626,919 | ||||||||
| 2018-08-01 | 3 | FOCS |
Focus Financial Partners Inc.
Class A Common Stock |
9,254,454 | ||||||||
| 2018-08-01 | 3 | FOCS |
Focus Financial Partners Inc.
Class A Common Stock |
5,677,855 | ||||||||
| 2018-08-01 | 3 | FOCS |
Focus Financial Partners Inc.
Class A Common Stock |
5,626,919 | ||||||||
| 2018-08-01 | 3 | FOCS |
Focus Financial Partners Inc.
Class A Common Stock |
9,254,454 | ||||||||
| 2018-08-01 | 3 | FOCS |
Focus Financial Partners Inc.
Class A Common Stock |
5,677,855 | ||||||||
| 2018-08-01 |
|
4 | EYE |
National Vision Holdings, Inc.
Common Stock |
S - Sale | -11,452,321 | 20,946,174 | -35.35 | 38.26 | -438,158,930 | 801,388,050 | |
| 2018-08-01 | 3 | SONO |
Sonos Inc
Common Stock |
47,753,148 | ||||||||
| 2018-08-01 | 3 | SONO |
Sonos Inc
Common Stock |
47,753,148 | ||||||||
| 2018-08-01 | 3 | SONO |
Sonos Inc
Common Stock |
47,753,148 | ||||||||
| 2018-08-01 | 3 | SONO |
Sonos Inc
Common Stock |
47,753,148 | ||||||||
| 2018-08-01 | 3 | SONO |
Sonos Inc
Common Stock |
47,753,148 | ||||||||
| 2018-08-01 | 3 | SONO |
Sonos Inc
Common Stock |
47,753,148 | ||||||||
| 2018-08-01 | 3 | SONO |
Sonos Inc
Common Stock |
47,753,148 | ||||||||
| 2018-08-01 | 3 | SONO |
Sonos Inc
Common Stock |
47,753,148 | ||||||||
| 2018-07-23 | 3 | KRP |
Kimbell Royalty Partners, LP
Common units representing limited partner interests |
9,513,113 | ||||||||
| 2018-07-23 | 3 | KRP |
Kimbell Royalty Partners, LP
Common units representing limited partner interests |
5,227,564 | ||||||||
| 2018-07-23 | 3 | KRP |
Kimbell Royalty Partners, LP
Common units representing limited partner interests |
9,513,113 | ||||||||
| 2018-07-23 | 3 | KRP |
Kimbell Royalty Partners, LP
Common units representing limited partner interests |
5,227,564 | ||||||||
| 2018-07-23 | 3 | KRP |
Kimbell Royalty Partners, LP
Common units representing limited partner interests |
9,513,113 | ||||||||
| 2018-07-23 | 3 | KRP |
Kimbell Royalty Partners, LP
Common units representing limited partner interests |
5,227,564 | ||||||||
| 2018-07-23 | 3 | KRP |
Kimbell Royalty Partners, LP
Common units representing limited partner interests |
9,513,113 | ||||||||
| 2018-07-23 | 3 | KRP |
Kimbell Royalty Partners, LP
Common units representing limited partner interests |
5,227,564 | ||||||||
| 2018-07-23 | 3 | KRP |
Kimbell Royalty Partners, LP
Common units representing limited partner interests |
9,513,113 | ||||||||
| 2018-07-23 | 3 | KRP |
Kimbell Royalty Partners, LP
Common units representing limited partner interests |
5,227,564 | ||||||||
| 2018-07-23 | 3 | KRP |
Kimbell Royalty Partners, LP
Common units representing limited partner interests |
9,513,113 | ||||||||
| 2018-07-23 | 3 | KRP |
Kimbell Royalty Partners, LP
Common units representing limited partner interests |
5,227,564 | ||||||||
| 2018-07-23 | 3 | KRP |
Kimbell Royalty Partners, LP
Common units representing limited partner interests |
9,513,113 | ||||||||
| 2018-07-23 | 3 | KRP |
Kimbell Royalty Partners, LP
Common units representing limited partner interests |
5,227,564 | ||||||||
| 2018-07-23 | 3 | KRP |
Kimbell Royalty Partners, LP
Common units representing limited partner interests |
9,513,113 | ||||||||
| 2018-07-23 | 3 | KRP |
Kimbell Royalty Partners, LP
Common units representing limited partner interests |
5,227,564 | ||||||||
| 2018-07-23 | 3 | KRP |
Kimbell Royalty Partners, LP
Common units representing limited partner interests |
9,513,113 | ||||||||
| 2018-07-23 | 3 | KRP |
Kimbell Royalty Partners, LP
Common units representing limited partner interests |
5,227,564 | ||||||||
| 2018-07-23 | 3 | KRP |
Kimbell Royalty Partners, LP
Common units representing limited partner interests |
9,513,113 | ||||||||
| 2018-07-23 | 3 | KRP |
Kimbell Royalty Partners, LP
Common units representing limited partner interests |
5,227,564 | ||||||||
| 2018-07-05 |
|
4 | FDC |
FIRST DATA CORP
Units in Director Deferred Compensation Plan |
A - Award | 947 | 29,524 | 3.31 | 21.12 | 20,000 | 623,538 | |
| 2018-06-28 | 3 | BV |
BrightView Holdings, Inc.
Common Stock |
116,836,492 | ||||||||
| 2018-06-28 | 3 | BV |
BrightView Holdings, Inc.
Common Stock |
116,836,492 | ||||||||
| 2018-06-28 | 3 | BV |
BrightView Holdings, Inc.
Common Stock |
116,836,492 | ||||||||
| 2018-06-28 | 3 | BV |
BrightView Holdings, Inc.
Common Stock |
116,836,492 | ||||||||
| 2018-06-28 | 3 | BV |
BrightView Holdings, Inc.
Common Stock |
116,836,492 | ||||||||
| 2018-06-28 | 3 | BV |
BrightView Holdings, Inc.
Common Stock |
116,836,492 | ||||||||
| 2018-06-28 | 3 | BV |
BrightView Holdings, Inc.
Common Stock |
116,836,492 | ||||||||
| 2018-06-28 | 3 | BV |
BrightView Holdings, Inc.
Common Stock |
116,836,492 | ||||||||
| 2018-06-28 | 3 | BV |
BrightView Holdings, Inc.
Common Stock |
116,836,492 | ||||||||
| 2018-06-28 | 3 | BV |
BrightView Holdings, Inc.
Common Stock |
116,836,492 | ||||||||
| 2018-06-06 |
|
4 | AMED |
AMEDISYS INC
Common Stock |
S - Sale | -19,120 | 22,933 | -45.47 | 73.96 | -1,414,115 | 1,696,125 | |
| 2018-06-06 |
|
4 | AMED |
AMEDISYS INC
Common Stock |
S - Sale | -2,418,304 | 2,395,371 | -50.24 | 73.96 | -178,857,764 | 177,161,639 | |
| 2018-06-05 |
|
4 | WG |
Willbros Group, Inc.\NEW\
Common Stock, $0.05 par value |
J - Other | -10,125,410 | 0 | -100.00 | 0.60 | -6,075,246 | ||
| 2018-05-25 |
|
4 | GDDY |
GoDaddy Inc.
Units of Desert Newco, LLC |
C - Conversion | -44,435 | 68,254 | -39.43 | ||||
| 2018-05-25 |
|
4 | GDDY |
GoDaddy Inc.
Units of Desert Newco, LLC |
C - Conversion | -203,482 | 312,562 | -39.43 | ||||
| 2018-05-25 |
|
4 | GDDY |
GoDaddy Inc.
Units of Desert Newco, LLC |
C - Conversion | -1,848,696 | 2,839,708 | -39.43 | ||||
| 2018-05-25 |
|
4 | GDDY |
GoDaddy Inc.
Class A Common Stock |
S - Sale | -44,435 | 8,050 | -84.66 | 70.73 | -3,142,888 | 569,376 | |
| 2018-05-25 |
|
4 | GDDY |
GoDaddy Inc.
Class A Common Stock |
C - Conversion | 44,435 | 52,485 | 551.99 | ||||
| 2018-05-25 |
|
4 | GDDY |
GoDaddy Inc.
Class A Common Stock |
S - Sale | -203,482 | 36,864 | -84.66 | 70.73 | -14,392,282 | 2,607,391 | |
| 2018-05-25 |
|
4 | GDDY |
GoDaddy Inc.
Class A Common Stock |
C - Conversion | 203,482 | 240,346 | 551.98 | ||||
| 2018-05-25 |
|
4 | GDDY |
GoDaddy Inc.
Class A Common Stock |
S - Sale | -1,848,696 | 374,147 | -83.17 | 70.73 | -130,758,268 | 26,463,417 | |
| 2018-05-25 |
|
4 | GDDY |
GoDaddy Inc.
Class A Common Stock |
C - Conversion | 1,848,696 | 2,222,843 | 494.11 | ||||
| 2018-05-25 |
|
4 | GDDY |
GoDaddy Inc.
Class A Common Stock |
S - Sale | -622,084 | 1,001,846 | -38.31 | 70.73 | -44,000,001 | 70,860,568 | |
| 2018-05-25 |
|
4 | GDDY |
GoDaddy Inc.
Class A Common Stock |
S - Sale | -1,281,303 | 2,227,477 | -36.52 | 70.73 | -90,626,561 | 157,549,448 | |
| 2018-05-18 |
|
4 | KKR |
KKR & Co. L.P.
KKR Holdings L.P. Units |
C - Conversion | -10,000,000 | 71,314,740 | -12.30 | ||||
| 2018-05-18 |
|
4 | KKR |
KKR & Co. L.P.
Common Units |
G - Gift | 10,000,000 | 11,000,000 | 1,000.00 | ||||
| 2018-05-18 |
|
4 | KKR |
KKR & Co. L.P.
Common Units |
G - Gift | -10,000,000 | 1,105,832 | -90.04 | ||||
| 2018-05-18 |
|
4 | KKR |
KKR & Co. L.P.
Common Units |
C - Conversion | 10,000,000 | 11,105,832 | 904.30 | ||||
| 2018-05-18 |
|
4 | KKR |
KKR & Co. L.P.
Common Units |
W - Other | 43,299 | 1,149,131 | 3.92 | ||||
| 2018-05-09 |
|
4 | GDI |
GARDNER DENVER HOLDINGS, INC.
Common Stock |
S - Sale | -30,436,064 | 90,721,409 | -25.12 | 29.84 | -908,136,060 | 2,706,900,041 | |
| 2018-04-25 |
|
4 | LAUR |
LAUREATE EDUCATION, INC.
Convertible Redeemable Preferred Stock, Series A |
C - Conversion | -650 | 0 | -100.00 | ||||
| 2018-04-25 |
|
4 | LAUR |
LAUREATE EDUCATION, INC.
Convertible Redeemable Preferred Stock, Series A |
C - Conversion | -59,350 | 0 | -100.00 | ||||
| 2018-04-25 |
|
4 | LAUR |
LAUREATE EDUCATION, INC.
Class A Common Stock |
C - Conversion | 58,805 | 97,496 | 151.99 | 11.72 | 689,195 | 1,142,653 | |
| 2018-04-25 |
|
4 | LAUR |
LAUREATE EDUCATION, INC.
Class A Common Stock |
C - Conversion | 5,369,375 | 8,902,112 | 151.99 | 11.72 | 62,929,075 | 104,332,753 | |
| 2018-03-28 |
|
4 | EYE |
National Vision Holdings, Inc.
Common Stock |
S - Sale | -1,444,822 | 32,398,495 | -4.27 | 31.68 | -45,771,961 | 1,026,384,322 | |
| 2018-03-21 |
|
4 | EYE |
National Vision Holdings, Inc.
Common Stock |
S - Sale | -9,632,145 | 33,843,317 | -22.16 | 31.68 | -305,146,354 | 1,072,156,283 | |
| 2018-03-07 |
|
4 | GDDY |
GoDaddy Inc.
Units of Desert Newco, LLC |
C - Conversion | -2,310,870 | 4,688,404 | -33.02 | ||||
| 2018-03-07 |
|
4 | GDDY |
GoDaddy Inc.
Units of Desert Newco, LLC |
C - Conversion | -254,353 | 516,044 | -33.02 | ||||
| 2018-03-07 |
|
4 | GDDY |
GoDaddy Inc.
Units of Desert Newco, LLC |
C - Conversion | -55,543 | 112,689 | -33.02 | ||||
| 2018-03-07 |
|
4 | GDDY |
GoDaddy Inc.
Class A Common Stock |
S - Sale | -55,543 | 8,050 | -87.34 | 59.21 | -3,288,701 | 476,640 | |
| 2018-03-07 |
|
4 | GDDY |
GoDaddy Inc.
Class A Common Stock |
C - Conversion | 55,543 | 63,593 | 689.98 | ||||
| 2018-03-07 |
|
4 | GDDY |
GoDaddy Inc.
Class A Common Stock |
S - Sale | -254,353 | 36,864 | -87.34 | 59.21 | -15,060,241 | 2,182,717 | |
| 2018-03-07 |
|
4 | GDDY |
GoDaddy Inc.
Class A Common Stock |
C - Conversion | 254,353 | 291,217 | 689.98 | ||||
| 2018-03-07 |
|
4 | GDDY |
GoDaddy Inc.
Class A Common Stock |
S - Sale | -2,310,870 | 374,147 | -86.07 | 59.21 | -136,826,613 | 22,153,244 | |
| 2018-03-07 |
|
4 | GDDY |
GoDaddy Inc.
Class A Common Stock |
C - Conversion | 2,310,870 | 2,685,017 | 617.64 | ||||
| 2018-03-07 |
|
4 | GDDY |
GoDaddy Inc.
Class A Common Stock |
S - Sale | -777,605 | 1,623,930 | -32.38 | 59.21 | -46,041,992 | 96,152,895 | |
| 2018-03-07 |
|
4 | GDDY |
GoDaddy Inc.
Class A Common Stock |
S - Sale | -1,601,629 | 3,508,780 | -31.34 | 59.21 | -94,832,453 | 207,754,864 | |
| 2018-01-09 |
|
4 | WMIH |
WMIH CORP.
Series B Convertible Preferred Stock |
J - Other | 200,000 | 200,000 | 1,000.00 | 200,000,000 | 200,000,000 | ||
| 2018-01-09 |
|
4 | WMIH |
WMIH CORP.
Series B Convertible Preferred Stock |
J - Other | -200,000 | 0 | -100.00 | 1,000.00 | -200,000,000 | ||
| 2018-01-04 |
|
4 | FDC |
FIRST DATA CORP
Units in Director Deferred Compensation Plan |
A - Award | 1,201 | 28,577 | 4.39 | 16.65 | 20,000 | 475,801 | |
| 2017-12-06 |
|
4 | USFD |
US Foods Holding Corp.
Common Stock, par value $0.01 per share |
S - Sale | -159,822 | 0 | -100.00 | 28.00 | -4,475,016 | ||
| 2017-12-06 |
|
4 | USFD |
US Foods Holding Corp.
Common Stock, par value $0.01 per share |
S - Sale | -325,860 | 0 | -100.00 | 28.00 | -9,124,080 | ||
| 2017-12-06 |
|
4 | USFD |
US Foods Holding Corp.
Common Stock, par value $0.01 per share |
S - Sale | -355,160 | 0 | -100.00 | 28.00 | -9,944,480 | ||
| 2017-12-06 |
|
4 | USFD |
US Foods Holding Corp.
Common Stock, par value $0.01 per share |
S - Sale | -1,420,641 | 0 | -100.00 | 28.00 | -39,777,948 | ||
| 2017-12-06 |
|
4 | USFD |
US Foods Holding Corp.
Common Stock, par value $0.01 per share |
S - Sale | -17,716,289 | 0 | -100.00 | 28.00 | -496,056,092 | ||
| 2017-11-22 |
|
4 | GDI |
GARDNER DENVER HOLDINGS, INC.
Common Stock |
S - Sale | -25,250,880 | 121,157,473 | -17.25 | 26.43 | -667,443,886 | 3,202,494,905 | |
| 2017-11-03 |
|
4 | KKR |
KKR & Co. L.P.
KKR Holdings L.P. Units |
J - Other | 2,500,000 | 81,314,740 | 3.17 | ||||
| 2017-10-25 | 3 | EYE |
National Vision Holdings, Inc.
Common Stock |
86,950,924 | ||||||||
| 2017-10-25 | 3 | EYE |
National Vision Holdings, Inc.
Common Stock |
86,950,924 | ||||||||
| 2017-10-25 | 3 | EYE |
National Vision Holdings, Inc.
Common Stock |
86,950,924 | ||||||||
| 2017-10-25 | 3 | EYE |
National Vision Holdings, Inc.
Common Stock |
86,950,924 | ||||||||
| 2017-10-25 | 3 | EYE |
National Vision Holdings, Inc.
Common Stock |
86,950,924 | ||||||||
| 2017-10-25 | 3 | EYE |
National Vision Holdings, Inc.
Common Stock |
86,950,924 | ||||||||
| 2017-10-25 | 3 | EYE |
National Vision Holdings, Inc.
Common Stock |
86,950,924 | ||||||||
| 2017-10-25 | 3 | EYE |
National Vision Holdings, Inc.
Common Stock |
86,950,924 | ||||||||
| 2017-10-25 | 3 | EYE |
National Vision Holdings, Inc.
Common Stock |
86,950,924 | ||||||||
| 2017-09-20 |
|
4 | USFD |
US Foods Holding Corp.
Common Stock, par value $0.01 per share |
S - Sale | -160,000 | 159,822 | -50.03 | 27.34 | -4,374,400 | 4,369,533 | |
| 2017-09-20 |
|
4 | USFD |
US Foods Holding Corp.
Common Stock, par value $0.01 per share |
S - Sale | -326,222 | 325,860 | -50.03 | 27.34 | -8,918,909 | 8,909,012 | |
| 2017-09-20 |
|
4 | USFD |
US Foods Holding Corp.
Common Stock, par value $0.01 per share |
S - Sale | -355,556 | 355,160 | -50.03 | 27.34 | -9,720,901 | 9,710,074 | |
| 2017-09-20 |
|
4 | USFD |
US Foods Holding Corp.
Common Stock, par value $0.01 per share |
S - Sale | -1,422,222 | 1,420,641 | -50.03 | 27.34 | -38,883,549 | 38,840,325 | |
| 2017-09-20 |
|
4 | USFD |
US Foods Holding Corp.
Common Stock, par value $0.01 per share |
S - Sale | -17,736,000 | 17,716,289 | -50.03 | 27.34 | -484,902,240 | 484,363,341 | |
| 2017-09-20 |
|
4 | FDC |
FIRST DATA CORP
Class B Common Stock |
S - Sale | -97,750,000 | 438,041,146 | -18.24 | 17.17 | -1,678,670,525 | 7,522,524,404 | |
| 2017-09-12 |
|
4 | GDDY |
GoDaddy Inc.
Units of Desert Newco, LLC |
C - Conversion | -2,684,894 | 6,999,274 | -27.72 | ||||
| 2017-09-12 |
|
4 | GDDY |
GoDaddy Inc.
Units of Desert Newco, LLC |
C - Conversion | -29,522 | 770,397 | -3.69 | ||||
| 2017-09-12 |
|
4 | GDDY |
GoDaddy Inc.
Units of Desert Newco, LLC |
C - Conversion | -64,533 | 168,232 | -27.72 | ||||
| 2017-09-12 |
|
4 | GDDY |
GoDaddy Inc.
Class A Common Stock |
S - Sale | -64,533 | 8,050 | -88.91 | 43.71 | -2,820,737 | 351,866 | |
| 2017-09-12 |
|
4 | GDDY |
GoDaddy Inc.
Class A Common Stock |
C - Conversion | 64,533 | 72,583 | 801.65 | ||||
| 2017-09-12 |
|
4 | GDDY |
GoDaddy Inc.
Class A Common Stock |
S - Sale | -295,522 | 36,864 | -88.91 | 43.71 | -12,917,267 | 1,611,325 | |
| 2017-09-12 |
|
4 | GDDY |
GoDaddy Inc.
Class A Common Stock |
C - Conversion | 295,522 | 332,386 | 801.65 | ||||
| 2017-09-12 |
|
4 | GDDY |
GoDaddy Inc.
Class A Common Stock |
S - Sale | -2,684,894 | 374,147 | -87.77 | 43.71 | -117,356,717 | 16,353,965 | |
| 2017-09-12 |
|
4 | GDDY |
GoDaddy Inc.
Class A Common Stock |
C - Conversion | 2,684,894 | 3,059,041 | 717.60 | ||||
| 2017-09-12 |
|
4 | GDDY |
GoDaddy Inc.
Class A Common Stock |
S - Sale | -903,463 | 2,401,535 | -27.34 | 43.71 | -39,490,368 | 104,971,095 | |
| 2017-09-12 |
|
4 | GDDY |
GoDaddy Inc.
Class A Common Stock |
S - Sale | -1,860,860 | 5,110,409 | -26.69 | 43.71 | -81,338,191 | 223,375,977 | |
| 2017-09-05 |
|
4 | NONE |
Sentio Healthcare Properties Inc
Series B Convt Preferred Units of Sentio Partnership |
J - Other | -1,586,260 | 0 | -100.00 | ||||
| 2017-09-05 |
|
4 | NONE |
Sentio Healthcare Properties Inc
3% Senior Cumulative Preferred Stock, Series C |
J - Other | -1,000 | 0 | -100.00 | ||||
| 2017-08-16 |
|
4 | PRAH |
PRA Health Sciences, Inc.
Common Stock |
S - Sale | -9,500,000 | 13,195,984 | -41.86 | 74.85 | -711,075,000 | 987,719,402 | |
| 2017-07-06 |
|
4 | FDC |
FIRST DATA CORP
Units in Director Deferred Compensation Plan |
A - Award | 1,107 | 27,375 | 4.21 | 18.07 | 20,000 | 494,674 | |
| 2017-05-19 |
|
4 | USFD |
US Foods Holding Corp.
Common Stock, par value $0.01 per share |
S - Sale | -181,244 | 319,822 | -36.17 | 27.40 | -4,966,539 | 8,763,922 | |
| 2017-05-19 |
|
4 | USFD |
US Foods Holding Corp.
Common Stock, par value $0.01 per share |
S - Sale | -369,537 | 652,082 | -36.17 | 27.40 | -10,126,238 | 17,868,677 | |
| 2017-05-19 |
|
4 | USFD |
US Foods Holding Corp.
Common Stock, par value $0.01 per share |
S - Sale | -402,765 | 710,716 | -36.17 | 27.40 | -11,036,768 | 19,475,395 | |
| 2017-05-19 |
|
4 | USFD |
US Foods Holding Corp.
Common Stock, par value $0.01 per share |
S - Sale | -1,611,062 | 2,842,863 | -36.17 | 27.40 | -44,147,126 | 77,901,553 | |
| 2017-05-19 |
|
4 | USFD |
US Foods Holding Corp.
Common Stock, par value $0.01 per share |
S - Sale | -20,090,951 | 35,452,289 | -36.17 | 27.40 | -550,542,285 | 971,481,349 | |
| 2017-05-12 |
|
4 | GDDY |
GoDaddy Inc.
Units of Desert Newco, LLC |
S - Sale | -1,877,269 | 9,684,168 | -16.24 | 37.44 | -70,287,204 | 362,586,871 | |
| 2017-05-12 |
|
4 | GDDY |
GoDaddy Inc.
Units of Desert Newco, LLC |
S - Sale | -206,627 | 1,065,919 | -16.24 | 37.44 | -7,736,363 | 39,909,286 | |
| 2017-05-12 |
|
4 | GDDY |
GoDaddy Inc.
Units of Desert Newco, LLC |
S - Sale | -45,122 | 232,765 | -16.24 | 37.44 | -1,689,422 | 8,715,001 | |
| 2017-05-12 |
|
4 | GDDY |
GoDaddy Inc.
Units of Desert Newco, LLC |
C - Conversion | -2,806,245 | 11,561,437 | -19.53 | ||||
| 2017-05-12 |
|
4 | GDDY |
GoDaddy Inc.
Units of Desert Newco, LLC |
C - Conversion | -308,879 | 1,272,546 | -19.53 | ||||
| 2017-05-12 |
|
4 | GDDY |
GoDaddy Inc.
Units of Desert Newco, LLC |
C - Conversion | -67,449 | 277,887 | -19.53 | ||||
| 2017-05-12 |
|
4 | GDDY |
GoDaddy Inc.
Class A Common Stock |
S - Sale | -67,449 | 8,050 | -89.34 | 37.44 | -2,525,371 | 301,402 | |
| 2017-05-12 |
|
4 | GDDY |
GoDaddy Inc.
Class A Common Stock |
C - Conversion | 67,449 | 75,499 | 837.88 | ||||
| 2017-05-12 |
|
4 | GDDY |
GoDaddy Inc.
Class A Common Stock |
S - Sale | -308,879 | 36,864 | -89.34 | 37.44 | -11,564,800 | 1,380,232 | |
| 2017-05-12 |
|
4 | GDDY |
GoDaddy Inc.
Class A Common Stock |
C - Conversion | 308,879 | 345,743 | 837.89 | ||||
| 2017-05-12 |
|
4 | GDDY |
GoDaddy Inc.
Class A Common Stock |
S - Sale | -2,806,245 | 374,147 | -88.24 | 37.44 | -105,069,180 | 14,008,513 | |
| 2017-05-12 |
|
4 | GDDY |
GoDaddy Inc.
Class A Common Stock |
C - Conversion | 2,806,245 | 3,180,392 | 750.04 | ||||
| 2017-05-12 |
|
4 | GDDY |
GoDaddy Inc.
Class A Common Stock |
S - Sale | -1,575,997 | 3,304,998 | -32.29 | 37.44 | -59,007,219 | 123,743,091 | |
| 2017-05-12 |
|
4 | GDDY |
GoDaddy Inc.
Class A Common Stock |
S - Sale | -3,246,075 | 6,971,269 | -31.77 | 37.44 | -121,536,943 | 261,012,677 | |
| 2017-05-11 | 3 | GDI |
GARDNER DENVER HOLDINGS, INC.
Common Stock |
292,816,706 | ||||||||
| 2017-05-11 | 3 | GDI |
GARDNER DENVER HOLDINGS, INC.
Common Stock |
292,816,706 | ||||||||
| 2017-05-11 | 3 | GDI |
GARDNER DENVER HOLDINGS, INC.
Common Stock |
292,816,706 | ||||||||
| 2017-05-11 | 3 | GDI |
GARDNER DENVER HOLDINGS, INC.
Common Stock |
292,816,706 | ||||||||
| 2017-05-11 | 3 | GDI |
GARDNER DENVER HOLDINGS, INC.
Common Stock |
292,816,706 | ||||||||
| 2017-05-11 | 3 | GDI |
GARDNER DENVER HOLDINGS, INC.
Common Stock |
292,816,706 | ||||||||
| 2017-05-11 | 3 | GDI |
GARDNER DENVER HOLDINGS, INC.
Common Stock |
292,816,706 | ||||||||
| 2017-05-11 | 3 | GDI |
GARDNER DENVER HOLDINGS, INC.
Common Stock |
292,816,706 | ||||||||
| 2017-05-11 | 3 | GDI |
GARDNER DENVER HOLDINGS, INC.
Common Stock |
292,816,706 | ||||||||
| 2017-05-04 | 3 | KREF |
KKR Real Estate Finance Trust Inc.
Common Stock |
43,758,616 | ||||||||
| 2017-05-04 | 3 | KREF |
KKR Real Estate Finance Trust Inc.
Common Stock |
27,517,232 | ||||||||
| 2017-05-04 | 3 | KREF |
KKR Real Estate Finance Trust Inc.
Common Stock |
43,758,616 | ||||||||
| 2017-05-04 | 3 | KREF |
KKR Real Estate Finance Trust Inc.
Common Stock |
27,517,232 | ||||||||
| 2017-05-04 | 3 | KREF |
KKR Real Estate Finance Trust Inc.
Common Stock |
43,758,616 | ||||||||
| 2017-05-04 | 3 | KREF |
KKR Real Estate Finance Trust Inc.
Common Stock |
27,517,232 | ||||||||
| 2017-05-04 | 3 | KREF |
KKR Real Estate Finance Trust Inc.
Common Stock |
43,758,616 | ||||||||
| 2017-05-04 | 3 | KREF |
KKR Real Estate Finance Trust Inc.
Common Stock |
27,517,232 | ||||||||
| 2017-05-04 | 3 | KREF |
KKR Real Estate Finance Trust Inc.
Common Stock |
43,758,616 | ||||||||
| 2017-05-04 | 3 | KREF |
KKR Real Estate Finance Trust Inc.
Common Stock |
27,517,232 | ||||||||
| 2017-05-04 | 3 | KREF |
KKR Real Estate Finance Trust Inc.
Common Stock |
43,758,616 | ||||||||
| 2017-05-04 | 3 | KREF |
KKR Real Estate Finance Trust Inc.
Common Stock |
27,517,232 | ||||||||
| 2017-05-04 | 3 | KREF |
KKR Real Estate Finance Trust Inc.
Common Stock |
43,758,616 | ||||||||
| 2017-05-04 | 3 | KREF |
KKR Real Estate Finance Trust Inc.
Common Stock |
27,517,232 | ||||||||
| 2017-05-04 | 3 | KREF |
KKR Real Estate Finance Trust Inc.
Common Stock |
43,758,616 | ||||||||
| 2017-05-04 | 3 | KREF |
KKR Real Estate Finance Trust Inc.
Common Stock |
27,517,232 | ||||||||
| 2017-05-04 | 3 | KREF |
KKR Real Estate Finance Trust Inc.
Common Stock |
43,758,616 | ||||||||
| 2017-05-04 | 3 | KREF |
KKR Real Estate Finance Trust Inc.
Common Stock |
27,517,232 | ||||||||
| 2017-05-04 | 3 | KREF |
KKR Real Estate Finance Trust Inc.
Common Stock |
43,758,616 | ||||||||
| 2017-05-04 | 3 | KREF |
KKR Real Estate Finance Trust Inc.
Common Stock |
27,517,232 | ||||||||
| 2017-05-04 | 3 | KREF |
KKR Real Estate Finance Trust Inc.
Common Stock |
43,758,616 | ||||||||
| 2017-05-04 | 3 | KREF |
KKR Real Estate Finance Trust Inc.
Common Stock |
27,517,232 | ||||||||
| 2017-04-21 |
|
4 | HCC |
WARRIOR MET COAL, INC.
Common Stock |
S - Sale | -2,389,274 | 4,071,745 | -36.98 | 17.81 | -42,558,943 | 72,527,958 | |
| 2017-04-13 | 3 | HCC |
WARRIOR MET COAL, INC.
Common Stock |
12,922,038 | ||||||||
| 2017-04-13 | 3 | HCC |
WARRIOR MET COAL, INC.
Common Stock |
12,922,038 | ||||||||
| 2017-04-13 | 3 | HCC |
WARRIOR MET COAL, INC.
Common Stock |
12,922,038 | ||||||||
| 2017-04-13 | 3 | HCC |
WARRIOR MET COAL, INC.
Common Stock |
12,922,038 | ||||||||
| 2017-04-13 | 3 | HCC |
WARRIOR MET COAL, INC.
Common Stock |
12,922,038 | ||||||||
| 2017-04-13 | 3 | HCC |
WARRIOR MET COAL, INC.
Common Stock |
12,922,038 | ||||||||
| 2017-04-13 | 3 | HCC |
WARRIOR MET COAL, INC.
Common Stock |
12,922,038 | ||||||||
| 2017-04-13 | 3 | HCC |
WARRIOR MET COAL, INC.
Common Stock |
12,922,038 | ||||||||
| 2017-04-13 | 3 | HCC |
WARRIOR MET COAL, INC.
Common Stock |
12,922,038 | ||||||||
| 2017-04-13 | 3 | HCC |
WARRIOR MET COAL, INC.
Common Stock |
12,922,038 | ||||||||
| 2017-04-13 | 3 | HCC |
WARRIOR MET COAL, INC.
Common Stock |
12,922,038 | ||||||||
| 2017-02-08 |
|
4 | LAUR |
LAUREATE EDUCATION, INC.
Class A Common Stock |
P - Purchase | 38,691 | 38,691 | 14.00 | 541,674 | 541,674 | ||
| 2017-02-08 |
|
4 | LAUR |
LAUREATE EDUCATION, INC.
Class A Common Stock |
P - Purchase | 3,532,737 | 3,532,737 | 14.00 | 49,458,318 | 49,458,318 | ||
| 2017-02-02 |
|
4 | USFD |
US Foods Holding Corp.
Common Stock, par value $0.01 per share |
S - Sale | -165,600 | 501,066 | -24.84 | 25.09 | -4,154,904 | 12,571,746 | |
| 2017-02-02 |
|
4 | USFD |
US Foods Holding Corp.
Common Stock, par value $0.01 per share |
S - Sale | -337,640 | 1,021,619 | -24.84 | 25.09 | -8,471,388 | 25,632,421 | |
| 2017-02-02 |
|
4 | USFD |
US Foods Holding Corp.
Common Stock, par value $0.01 per share |
S - Sale | -368,000 | 1,113,481 | -24.84 | 25.09 | -9,233,120 | 27,937,238 | |
| 2017-02-02 |
|
4 | USFD |
US Foods Holding Corp.
Common Stock, par value $0.01 per share |
S - Sale | -1,472,000 | 4,453,925 | -24.84 | 25.09 | -36,932,480 | 111,748,978 | |
| 2017-02-02 |
|
4 | USFD |
US Foods Holding Corp.
Common Stock, par value $0.01 per share |
S - Sale | -18,356,760 | 55,543,240 | -24.84 | 25.09 | -460,571,108 | 1,393,579,892 | |
| 2017-01-04 |
|
4 | FDC |
FIRST DATA CORP
Units in Director Deferred Compensation Plan |
A - Award | 1,409 | 26,269 | 5.67 | 14.19 | 20,000 | 372,752 | |
| 2016-12-16 |
|
4 | FDC |
FIRST DATA CORP
Class B Common Stock |
J - Other | 0 | 535,791,146 | 0.00 | ||||
| 2016-12-16 |
|
4 | USFD |
US Foods Holding Corp.
Common Stock, par value $0.01 per share |
J - Other | 0 | 5,925,925 | 0.00 | ||||
| 2016-11-18 |
|
4 | PRAH |
PRA Health Sciences, Inc.
Common Stock |
S - Sale | -7,500,000 | 22,695,984 | -24.84 | 55.51 | -416,325,000 | 1,259,854,072 | |
| 2016-08-08 |
|
4/A | GDDY |
GoDaddy Inc.
Units of Desert Newco, LLC |
C - Conversion | -2,274,280 | 14,367,682 | -13.67 | ||||
| 2016-08-08 |
|
4/A | GDDY |
GoDaddy Inc.
Units of Desert Newco, LLC |
C - Conversion | -250,325 | 1,581,425 | -13.67 | ||||
| 2016-08-08 |
|
4/A | GDDY |
GoDaddy Inc.
Units of Desert Newco, LLC |
C - Conversion | -54,664 | 345,336 | -13.67 | ||||
| 2016-08-08 |
|
4/A | GDDY |
GoDaddy Inc.
Class A Common Stock |
S - Sale | -54,664 | 8,050 | -87.16 | 29.27 | -1,599,846 | 235,599 | |
| 2016-08-08 |
|
4/A | GDDY |
GoDaddy Inc.
Class A Common Stock |
C - Conversion | 54,664 | 62,714 | 679.06 | ||||
| 2016-08-08 |
|
4/A | GDDY |
GoDaddy Inc.
Class A Common Stock |
S - Sale | -250,325 | 36,864 | -87.16 | 29.27 | -7,326,237 | 1,078,895 | |
| 2016-08-08 |
|
4/A | GDDY |
GoDaddy Inc.
Class A Common Stock |
C - Conversion | 250,325 | 287,189 | 679.05 | ||||
| 2016-08-08 |
|
4/A | GDDY |
GoDaddy Inc.
Class A Common Stock |
S - Sale | -2,274,280 | 374,147 | -85.87 | 29.27 | -66,561,125 | 10,950,123 | |
| 2016-08-08 |
|
4/A | GDDY |
GoDaddy Inc.
Class A Common Stock |
C - Conversion | 2,274,280 | 2,648,427 | 607.86 | ||||
| 2016-08-08 |
|
4/A | GDDY |
GoDaddy Inc.
Class A Common Stock |
S - Sale | -765,293 | 4,880,995 | -13.55 | 29.27 | -22,397,754 | 142,851,593 | |
| 2016-08-08 |
|
4/A | GDDY |
GoDaddy Inc.
Class A Common Stock |
S - Sale | -1,576,271 | 10,217,344 | -13.37 | 29.27 | -46,132,566 | 299,029,985 | |
| 2016-07-05 |
|
4 | FDC |
FIRST DATA CORP
Units in Director Deferred Compensation Plan |
A - Award | 1,807 | 24,859 | 7.84 | 11.07 | 20,000 | 275,191 | |
| 2016-05-25 | 3 | USFD |
US Foods Holding Corp.
Common Stock, par value $0.01 per share |
157,233,331 | ||||||||
| 2016-05-25 | 3 | USFD |
US Foods Holding Corp.
Common Stock, par value $0.01 per share |
89,259,256 | ||||||||
| 2016-05-25 | 3 | USFD |
US Foods Holding Corp.
Common Stock, par value $0.01 per share |
84,814,812 | ||||||||
| 2016-05-25 | 3 | USFD |
US Foods Holding Corp.
Common Stock, par value $0.01 per share |
84,692,590 | ||||||||
| 2016-05-25 | 3 | USFD |
US Foods Holding Corp.
Common Stock, par value $0.01 per share |
83,999,997 | ||||||||
| 2016-05-25 | 3 | USFD |
US Foods Holding Corp.
Common Stock, par value $0.01 per share |
157,233,331 | ||||||||
| 2016-05-25 | 3 | USFD |
US Foods Holding Corp.
Common Stock, par value $0.01 per share |
89,259,256 | ||||||||
| 2016-05-25 | 3 | USFD |
US Foods Holding Corp.
Common Stock, par value $0.01 per share |
84,814,812 | ||||||||
| 2016-05-25 | 3 | USFD |
US Foods Holding Corp.
Common Stock, par value $0.01 per share |
84,692,590 | ||||||||
| 2016-05-25 | 3 | USFD |
US Foods Holding Corp.
Common Stock, par value $0.01 per share |
83,999,997 | ||||||||
| 2016-05-12 |
|
4 | HCA |
HCA Holdings, Inc.
Common Stock, par value $0.01 per share |
S - Sale | -332,799 | 208,507 | -61.48 | 80.12 | -26,663,856 | 16,705,581 | |
| 2016-05-12 |
|
4 | HCA |
HCA Holdings, Inc.
Common Stock, par value $0.01 per share |
S - Sale | -381,309 | 238,899 | -61.48 | 80.12 | -30,550,477 | 19,140,620 | |
| 2016-05-12 |
|
4 | HCA |
HCA Holdings, Inc.
Common Stock, par value $0.01 per share |
S - Sale | -78,529 | 49,200 | -61.48 | 80.12 | -6,291,743 | 3,941,936 | |
| 2016-05-12 |
|
4 | HCA |
HCA Holdings, Inc.
Common Stock, par value $0.01 per share |
S - Sale | -127,923 | 80,148 | -61.48 | 80.12 | -10,249,191 | 6,421,426 | |
| 2016-05-12 |
|
4 | HCA |
HCA Holdings, Inc.
Common Stock, par value $0.01 per share |
S - Sale | -1,249,115 | 782,602 | -61.48 | 80.12 | -100,079,094 | 62,702,064 | |
| 2016-05-12 |
|
4 | HCA |
HCA Holdings, Inc.
Common Stock, par value $0.01 per share |
S - Sale | -3,461,161 | 2,168,506 | -61.48 | 80.12 | -277,308,219 | 173,740,717 | |
| 2016-05-12 |
|
4 | HCA |
HCA Holdings, Inc.
Common Stock, par value $0.01 per share |
S - Sale | -3,730,122 | 2,337,018 | -61.48 | 80.12 | -298,857,375 | 187,241,890 | |
| 2016-05-12 |
|
4 | HCA |
HCA Holdings, Inc.
Common Stock, par value $0.01 per share |
J - Other | -541,306 | 2,031,717 | -21.04 | 51.98 | -28,134,379 | 105,598,486 | |
| 2016-05-10 |
|
4 | PRAH |
PRA Health Sciences, Inc.
Common Stock |
S - Sale | -4,907,692 | 30,195,984 | -13.98 | 46.70 | -229,189,216 | 1,410,152,453 | |
| 2016-04-14 |
|
4 | GDDY |
GoDaddy Inc.
Units of Desert Newco, LLC |
C - Conversion | -2,274,280 | 14,367,682 | -13.67 | ||||
| 2016-04-14 |
|
4 | GDDY |
GoDaddy Inc.
Units of Desert Newco, LLC |
C - Conversion | -250,325 | 1,581,425 | -13.67 | ||||
| 2016-04-14 |
|
4 | GDDY |
GoDaddy Inc.
Units of Desert Newco, LLC |
C - Conversion | -54,664 | 345,336 | -13.67 | ||||
| 2016-04-14 |
|
4 | GDDY |
GoDaddy Inc.
Class A Common Stock |
S - Sale | -54,664 | 8,050 | -87.16 | 29.27 | -1,599,846 | 235,599 | |
| 2016-04-14 |
|
4 | GDDY |
GoDaddy Inc.
Class A Common Stock |
C - Conversion | 54,664 | 62,714 | 679.06 | ||||
| 2016-04-14 |
|
4 | GDDY |
GoDaddy Inc.
Class A Common Stock |
S - Sale | -250,325 | 36,864 | -87.16 | 29.27 | -7,326,237 | 1,078,895 | |
| 2016-04-14 |
|
4 | GDDY |
GoDaddy Inc.
Class A Common Stock |
C - Conversion | 250,325 | 287,189 | 679.05 | ||||
| 2016-04-14 |
|
4 | GDDY |
GoDaddy Inc.
Class A Common Stock |
S - Sale | -2,274,280 | 374,147 | -85.87 | 29.27 | -66,561,125 | 10,950,123 | |
| 2016-04-14 |
|
4 | GDDY |
GoDaddy Inc.
Class A Common Stock |
C - Conversion | 2,274,280 | 2,648,427 | 607.86 | ||||
| 2016-04-14 |
|
4 | GDDY |
GoDaddy Inc.
Class A Common Stock |
S - Sale | -765,293 | 4,880,995 | -13.55 | 29.27 | -22,397,754 | 142,851,593 | |
| 2016-04-14 |
|
4 | GDDY |
GoDaddy Inc.
Class A Common Stock |
S - Sale | -1,576,271 | 10,217,344 | -13.37 | 29.27 | -46,132,566 | 299,029,985 | |
| 2016-03-10 |
|
4 | PRAH |
PRA Health Sciences, Inc.
Common Stock |
S - Sale | -4,829,981 | 35,103,676 | -12.10 | 42.26 | -204,114,997 | 1,483,481,348 | |
| 2015-09-25 |
|
4 | SJM |
J M SMUCKER Co
Common Stock, without par value |
S - Sale | -8,277,495 | 0 | -100.00 | 113.31 | -937,922,958 | ||
| 2015-06-30 | 3 | ZBH |
ZIMMER BIOMET HOLDINGS, INC.
Common Stock |
15,059,280 | ||||||||
| 2015-06-30 | 3 | ZBH |
ZIMMER BIOMET HOLDINGS, INC.
Common Stock |
15,059,280 | ||||||||
| 2015-06-30 | 3 | ZBH |
ZIMMER BIOMET HOLDINGS, INC.
Common Stock |
15,059,280 | ||||||||
| 2015-06-30 | 3 | ZBH |
ZIMMER BIOMET HOLDINGS, INC.
Common Stock |
15,059,280 | ||||||||
| 2015-06-26 |
|
4 | NONE |
LVB Acquisition, Inc.
Common Stock |
J - Other | -134,008,582 | 0 | -100.00 | ||||
| 2015-05-27 |
|
4 | NONE |
Sentio Healthcare Properties Inc
Series B Convt Preferred Units of Sentio Partnership |
P - Purchase | 484,700 | 1,586,260 | 44.00 | 100.00 | 48,470,000 | 158,626,000 | |
| 2015-04-09 | 3 | WG |
Willbros Group, Inc.\NEW\
Common Stock, $0.05 par value |
20,250,820 | ||||||||
| 2015-04-09 | 3 | WG |
Willbros Group, Inc.\NEW\
Common Stock, $0.05 par value |
20,250,820 | ||||||||
| 2015-04-09 | 3 | WG |
Willbros Group, Inc.\NEW\
Common Stock, $0.05 par value |
20,250,820 | ||||||||
| 2015-04-09 | 3 | WG |
Willbros Group, Inc.\NEW\
Common Stock, $0.05 par value |
20,250,820 | ||||||||
| 2015-04-09 | 3 | WG |
Willbros Group, Inc.\NEW\
Common Stock, $0.05 par value |
20,250,820 | ||||||||
| 2015-04-09 | 3 | WG |
Willbros Group, Inc.\NEW\
Common Stock, $0.05 par value |
20,250,820 | ||||||||
| 2015-04-09 | 3 | WG |
Willbros Group, Inc.\NEW\
Common Stock, $0.05 par value |
20,250,820 | ||||||||
| 2015-04-09 | 3 | WG |
Willbros Group, Inc.\NEW\
Common Stock, $0.05 par value |
20,250,820 | ||||||||
| 2015-04-09 | 3 | WG |
Willbros Group, Inc.\NEW\
Common Stock, $0.05 par value |
20,250,820 | ||||||||
| 2015-04-09 | 3 | WG |
Willbros Group, Inc.\NEW\
Common Stock, $0.05 par value |
20,250,820 | ||||||||
| 2015-04-09 | 3 | WG |
Willbros Group, Inc.\NEW\
Common Stock, $0.05 par value |
20,250,820 | ||||||||
| 2015-04-02 | 3 | SJM |
J M SMUCKER Co
Common Stock, without par value |
16,554,990 | ||||||||
| 2015-04-02 | 3 | SJM |
J M SMUCKER Co
Common Stock, without par value |
16,554,990 | ||||||||
| 2015-04-02 | 3 | SJM |
J M SMUCKER Co
Common Stock, without par value |
16,554,990 | ||||||||
| 2015-04-02 | 3 | SJM |
J M SMUCKER Co
Common Stock, without par value |
16,554,990 | ||||||||
| 2015-04-02 | 3 | SJM |
J M SMUCKER Co
Common Stock, without par value |
16,554,990 | ||||||||
| 2015-04-02 | 3 | SJM |
J M SMUCKER Co
Common Stock, without par value |
16,554,990 | ||||||||
| 2015-04-02 | 3 | SJM |
J M SMUCKER Co
Common Stock, without par value |
16,554,990 | ||||||||
| 2015-04-02 | 3 | SJM |
J M SMUCKER Co
Common Stock, without par value |
16,554,990 | ||||||||
| 2015-04-02 | 3 | SJM |
J M SMUCKER Co
Common Stock, without par value |
16,554,990 | ||||||||
| 2015-04-01 | 3 | GDDY |
GoDaddy Inc.
Class A Common Stock |
29,652,579 | ||||||||
| 2015-04-01 | 3 | GDDY |
GoDaddy Inc.
Class A Common Stock |
23,505,252 | ||||||||
| 2015-04-01 | 3 | GDDY |
GoDaddy Inc.
Class A Common Stock |
18,233,111 | ||||||||
| 2015-04-01 | 3 | GDDY |
GoDaddy Inc.
Class A Common Stock |
17,895,828 | ||||||||
| 2015-04-01 | 3 | GDDY |
GoDaddy Inc.
Class A Common Stock |
17,867,014 | ||||||||
| 2015-04-01 | 3 | GDDY |
GoDaddy Inc.
Class A Common Stock |
29,652,579 | ||||||||
| 2015-04-01 | 3 | GDDY |
GoDaddy Inc.
Class A Common Stock |
23,505,252 | ||||||||
| 2015-04-01 | 3 | GDDY |
GoDaddy Inc.
Class A Common Stock |
18,233,111 | ||||||||
| 2015-04-01 | 3 | GDDY |
GoDaddy Inc.
Class A Common Stock |
17,895,828 | ||||||||
| 2015-04-01 | 3 | GDDY |
GoDaddy Inc.
Class A Common Stock |
17,867,014 | ||||||||
| 2015-03-09 |
|
4 | NLSN |
Nielsen N.V.
Common Stock |
S - Sale | -3,336,440 | 12,401,027 | -21.20 | 45.00 | -150,139,800 | 558,046,215 | |
| 2015-03-09 |
|
4 | NLSN |
Nielsen N.V.
Common Stock |
S - Sale | -663,560 | 2,466,349 | -21.20 | 45.00 | -29,860,200 | 110,985,705 | |
| 2015-03-05 |
|
4 | KKR |
KKR & Co. L.P.
Common Units |
G - Gift | -1,000,000 | 1,000,000 | -50.00 | ||||
| 2015-03-04 | 3 | EGL |
Engility Holdings, Inc.
Common Stock, par value $0.01 per share |
17,920,892 | ||||||||
| 2015-03-04 | 3 | EGL |
Engility Holdings, Inc.
Common Stock, par value $0.01 per share |
17,920,892 | ||||||||
| 2015-03-04 | 3 | EGL |
Engility Holdings, Inc.
Common Stock, par value $0.01 per share |
17,920,892 | ||||||||
| 2015-03-04 | 3 | EGL |
Engility Holdings, Inc.
Common Stock, par value $0.01 per share |
17,920,892 | ||||||||
| 2015-03-04 | 3 | EGL |
Engility Holdings, Inc.
Common Stock, par value $0.01 per share |
17,920,892 | ||||||||
| 2015-03-04 | 3 | EGL |
Engility Holdings, Inc.
Common Stock, par value $0.01 per share |
17,920,892 | ||||||||
| 2015-03-04 | 3 | EGL |
Engility Holdings, Inc.
Common Stock, par value $0.01 per share |
17,920,892 | ||||||||
| 2015-03-04 | 3 | EGL |
Engility Holdings, Inc.
Common Stock, par value $0.01 per share |
17,920,892 | ||||||||
| 2015-03-04 | 3 | EGL |
Engility Holdings, Inc.
Common Stock, par value $0.01 per share |
17,920,892 | ||||||||
| 2015-01-21 |
|
4 | NONE |
Sentio Healthcare Properties Inc
Series B Convt Preferred Units of Sentio Partnership |
P - Purchase | 155,000 | 1,101,560 | 16.38 | 100.00 | 15,500,000 | 110,156,000 | |
| 2015-01-07 |
|
4 | WMIH |
WMI HOLDINGS CORP.
3% Series B Convertible Preferred Stock |
P - Purchase | 200,000 | 200,000 | 1,000.00 | 200,000,000 | 200,000,000 | ||
| 2014-12-31 |
|
4 | NONE |
Sentio Healthcare Properties Inc
Series B Convt Preferred Units of Sentio Partnership |
P - Purchase | 341,400 | 946,560 | 56.41 | 100.00 | 34,140,000 | 94,656,000 | |
| 2014-12-31 | 3 | WBA |
Walgreens Boots Alliance, Inc.
Common Stock |
149,652,400 | ||||||||
| 2014-12-31 | 3 | WBA |
Walgreens Boots Alliance, Inc.
Common Stock |
148,119,747 | ||||||||
| 2014-12-31 | 3 | WBA |
Walgreens Boots Alliance, Inc.
Common Stock |
146,873,003 | ||||||||
| 2014-12-31 | 3 | WBA |
Walgreens Boots Alliance, Inc.
Common Stock |
146,093,133 | ||||||||
| 2014-12-31 | 3 | WBA |
Walgreens Boots Alliance, Inc.
Common Stock |
146,104,323 | ||||||||
| 2014-12-31 | 3 | WBA |
Walgreens Boots Alliance, Inc.
Common Stock |
146,088,878 | ||||||||
| 2014-12-31 | 3 | WBA |
Walgreens Boots Alliance, Inc.
Common Stock |
285,778,028 | ||||||||
| 2014-12-31 | 3 | WBA |
Walgreens Boots Alliance, Inc.
Common Stock |
149,652,400 | ||||||||
| 2014-12-31 | 3 | WBA |
Walgreens Boots Alliance, Inc.
Common Stock |
148,119,747 | ||||||||
| 2014-12-31 | 3 | WBA |
Walgreens Boots Alliance, Inc.
Common Stock |
146,873,003 | ||||||||
| 2014-12-31 | 3 | WBA |
Walgreens Boots Alliance, Inc.
Common Stock |
146,093,133 | ||||||||
| 2014-12-31 | 3 | WBA |
Walgreens Boots Alliance, Inc.
Common Stock |
146,104,323 | ||||||||
| 2014-12-31 | 3 | WBA |
Walgreens Boots Alliance, Inc.
Common Stock |
146,088,878 | ||||||||
| 2014-12-31 | 3 | WBA |
Walgreens Boots Alliance, Inc.
Common Stock |
285,778,028 | ||||||||
| 2014-12-17 |
|
4 | NONE |
Sentio Healthcare Properties Inc
Series B Convt Preferred Units of Sentio Partnership |
P - Purchase | 56,880 | 605,160 | 10.37 | 100.00 | 5,688,000 | 60,516,000 | |
| 2014-11-18 |
|
4 | NONE |
Sentio Healthcare Properties Inc
Series B Convt Preferred Units of Sentio Partnership |
P - Purchase | 86,710 | 548,280 | 18.79 | 100.00 | 8,671,000 | 54,828,000 | |
| 2014-11-14 |
|
4 | CHRS |
Coherus BioSciences, Inc.
Series C Preferred Stock |
C - Conversion | -2,499,499 | 0 | -100.00 | ||||
| 2014-11-14 |
|
4 | CHRS |
Coherus BioSciences, Inc.
Common Stock |
C - Conversion | 2,499,499 | 2,499,499 | |||||
| 2014-11-12 | 3 | PRAH |
PRA Health Sciences, Inc.
Common Stock |
79,867,314 | ||||||||
| 2014-11-12 | 3 | PRAH |
PRA Health Sciences, Inc.
Common Stock |
79,867,314 | ||||||||
| 2014-11-12 | 3 | PRAH |
PRA Health Sciences, Inc.
Common Stock |
79,867,314 | ||||||||
| 2014-11-12 | 3 | PRAH |
PRA Health Sciences, Inc.
Common Stock |
79,867,314 | ||||||||
| 2014-11-12 | 3 | PRAH |
PRA Health Sciences, Inc.
Common Stock |
79,867,314 | ||||||||
| 2014-11-12 | 3 | PRAH |
PRA Health Sciences, Inc.
Common Stock |
79,867,314 | ||||||||
| 2014-11-12 | 3 | PRAH |
PRA Health Sciences, Inc.
Common Stock |
79,867,314 | ||||||||
| 2014-11-12 | 3 | PRAH |
PRA Health Sciences, Inc.
Common Stock |
79,867,314 | ||||||||
| 2014-11-12 | 3 | PRAH |
PRA Health Sciences, Inc.
Common Stock |
79,867,314 | ||||||||
| 2014-11-07 |
|
4 | KKR |
KKR & Co. L.P.
KKR Holdings L.P. Units |
C - Conversion | -1,000,000 | 0 | -100.00 | ||||
| 2014-11-07 |
|
4 | KKR |
KKR & Co. L.P.
Common Units |
C - Conversion | 1,000,000 | 2,000,000 | 100.00 | ||||
| 2014-11-07 |
|
4 | KKR |
KKR & Co. L.P.
KKR Holdings L.P. Units |
G - Gift | 1,000,000 | 1,000,000 | |||||
| 2014-11-07 |
|
4 | KKR |
KKR & Co. L.P.
KKR Holdings L.P. Units |
G - Gift | -1,000,000 | 78,814,740 | -1.25 | ||||
| 2014-09-10 |
|
4 | SC |
Santander Consumer USA Holdings Inc.
Common Stock, par value $0.01 per share |
S - Sale | -5,023,977 | 0 | -100.00 | 18.65 | -93,697,162 | ||
| 2014-08-15 |
|
4 | NONE |
Sentio Healthcare Properties Inc
Series B Convt Preferred Units of Sentio Partnership |
P - Purchase | 127,310 | 461,570 | 38.09 | 100.00 | 12,731,000 | 46,157,000 | |
| 2014-06-17 |
|
4 | NONE |
Sentio Healthcare Properties Inc
Series B Convt Preferred Units of Sentio Partnership |
P - Purchase | 87,260 | 334,260 | 35.33 | 100.00 | 8,726,000 | 33,426,000 | |
| 2014-05-28 |
|
4 | HCA |
HCA Holdings, Inc.
Common Stock, par value $0.01 per share |
S - Sale | -296,434 | 620,208 | -32.34 | 51.53 | -15,275,244 | 31,959,339 | |
| 2014-05-28 |
|
4 | HCA |
HCA Holdings, Inc.
Common Stock, par value $0.01 per share |
S - Sale | -305,505 | 916,642 | -25.00 | 51.53 | -15,742,673 | 47,234,583 | |
| 2014-05-28 |
|
4 | HCA |
HCA Holdings, Inc.
Common Stock, par value $0.01 per share |
S - Sale | -61,049 | 127,729 | -32.34 | 51.53 | -3,145,855 | 6,581,896 | |
| 2014-05-28 |
|
4 | HCA |
HCA Holdings, Inc.
Common Stock, par value $0.01 per share |
S - Sale | -62,917 | 188,778 | -25.00 | 51.53 | -3,242,113 | 9,727,751 | |
| 2014-05-28 |
|
4 | HCA |
HCA Holdings, Inc.
Common Stock, par value $0.01 per share |
S - Sale | -99,449 | 208,071 | -32.34 | 51.53 | -5,124,607 | 10,721,878 | |
| 2014-05-28 |
|
4 | HCA |
HCA Holdings, Inc.
Common Stock, par value $0.01 per share |
S - Sale | -102,492 | 307,520 | -25.00 | 51.53 | -5,281,413 | 15,846,485 | |
| 2014-05-28 |
|
4 | HCA |
HCA Holdings, Inc.
Common Stock, par value $0.01 per share |
S - Sale | -1,229,797 | 2,573,023 | -32.34 | 51.53 | -63,371,439 | 132,587,870 | |
| 2014-05-28 |
|
4 | HCA |
HCA Holdings, Inc.
Common Stock, par value $0.01 per share |
S - Sale | -1,267,429 | 3,802,820 | -25.00 | 51.53 | -65,310,616 | 195,959,309 | |
| 2014-05-28 |
|
4 | HCA |
HCA Holdings, Inc.
Common Stock, par value $0.01 per share |
S - Sale | -2,690,746 | 5,629,667 | -32.34 | 51.53 | -138,654,141 | 290,096,751 | |
| 2014-05-28 |
|
4 | HCA |
HCA Holdings, Inc.
Common Stock, par value $0.01 per share |
S - Sale | -2,773,083 | 8,320,413 | -25.00 | 51.53 | -142,896,967 | 428,750,892 | |
| 2014-05-28 |
|
4 | HCA |
HCA Holdings, Inc.
Common Stock, par value $0.01 per share |
S - Sale | -2,899,839 | 6,067,140 | -32.34 | 51.53 | -149,428,704 | 312,639,729 | |
| 2014-05-28 |
|
4 | HCA |
HCA Holdings, Inc.
Common Stock, par value $0.01 per share |
S - Sale | -2,988,574 | 8,966,979 | -25.00 | 51.53 | -154,001,218 | 462,068,433 | |
| 2014-05-02 |
|
4 | KKR |
KKR & Co. L.P.
Common Units |
A - Award | 15,227 | 15,227 | |||||
| 2014-05-02 |
|
4 | KKR |
KKR & Co. L.P.
Common Units |
A - Award | 30,454 | 43,299 | 237.09 | ||||
| 2014-05-02 |
|
4 | KKR |
KKR & Co. L.P.
Common Units |
A - Award | 130,925 | 130,925 | |||||
| 2014-05-02 |
|
4 | KKR |
KKR & Co. L.P.
Common Units |
A - Award | 910,043 | 1,105,832 | 464.81 | ||||
| 2014-04-09 |
|
4 | NONE |
Sentio Healthcare Properties Inc
Series B Convt Preferred Units of Sentio Partnership |
P - Purchase | 54,000 | 247,000 | 27.98 | 100.00 | 5,400,000 | 24,700,000 | |
| 2014-04-03 |
|
4 | AMED |
AMEDISYS INC
Common Stock |
J - Other | 16,639 | 42,053 | 65.47 | 14.89 | 247,755 | 626,169 | |
| 2014-03-12 |
|
4 | NLSN |
Nielsen Holdings N.V.
Common Stock |
S - Sale | -5,170,057 | 15,737,467 | -24.73 | 46.25 | -239,115,136 | 727,857,849 | |
| 2014-03-12 |
|
4 | NLSN |
Nielsen Holdings N.V.
Common Stock |
S - Sale | -1,028,235 | 3,129,909 | -24.73 | 46.25 | -47,555,869 | 144,758,291 | |
| 2014-02-21 |
|
4 | KKR |
KKR & Co. L.P.
KKR Holdings L.P. Units |
C - Conversion | -1,000,000 | 0 | -100.00 | ||||
| 2014-02-21 |
|
4 | KKR |
KKR & Co. L.P.
Common Units |
C - Conversion | 1,000,000 | 1,000,000 | |||||
| 2014-02-12 |
|
4 | KKR |
KKR & Co. L.P.
Common Units |
G - Gift | -1,500,000 | 0 | -100.00 | ||||
| 2014-02-12 |
|
4 | KKR |
KKR & Co. L.P.
KKR Holdings L.P. Units |
G - Gift | 1,000,000 | 1,000,000 | |||||
| 2014-02-12 |
|
4 | KKR |
KKR & Co. L.P.
KKR Holdings L.P. Units |
G - Gift | -1,000,000 | 79,814,740 | -1.24 | ||||
| 2014-01-30 |
|
4 | SC |
Santander Consumer USA Holdings Inc.
Common Stock, par value $0.01 per share |
S - Sale | -24,392,927 | 5,023,977 | -82.92 | 23.04 | -562,013,038 | 115,752,419 | |
| 2014-01-22 | 3 | SC |
Santander Consumer USA Holdings Inc.
Common Stock, par value $0.01 per share |
29,416,904 | ||||||||
| 2013-12-09 |
|
4 | NONE |
Sentio Healthcare Properties Inc
Series B Convt Preferred Units of Sentio Partnership |
P - Purchase | 51,000 | 193,000 | 35.92 | 100.00 | 5,100,000 | 19,300,000 | |
| 2013-11-29 |
|
4 | NLSN |
Nielsen Holdings N.V.
Common Stock |
S - Sale | -5,170,057 | 20,907,524 | -19.83 | 39.09 | -202,097,528 | 817,275,113 | |
| 2013-11-29 |
|
4 | NLSN |
Nielsen Holdings N.V.
Common Stock |
S - Sale | -1,028,235 | 4,158,144 | -19.83 | 39.09 | -40,193,706 | 162,541,849 | |
| 2013-11-21 |
|
4 | AMED |
AMEDISYS INC
Common Stock |
P - Purchase | 80,000 | 4,836,608 | 1.68 | 14.77 | 1,181,416 | 71,425,576 | |
| 2013-11-21 |
|
4 | AMED |
AMEDISYS INC
Common Stock |
P - Purchase | 156,917 | 4,756,608 | 3.41 | 14.39 | 2,257,392 | 68,428,087 | |
| 2013-11-21 |
|
4 | AMED |
AMEDISYS INC
Common Stock |
P - Purchase | 188,598 | 4,599,691 | 4.28 | 14.43 | 2,720,715 | 66,355,142 | |
| 2013-11-14 |
|
4 | AMED |
AMEDISYS INC
Common Stock |
P - Purchase | 165,000 | 4,411,115 | 3.89 | 13.53 | 2,232,384 | 59,680,622 | |
| 2013-11-14 |
|
4 | AMED |
AMEDISYS INC
Common Stock |
P - Purchase | 300,000 | 4,246,115 | 7.60 | 13.37 | 4,010,310 | 56,760,791 | |
| 2013-11-14 |
|
4 | AMED |
AMEDISYS INC
Common Stock |
P - Purchase | 468,167 | 3,946,115 | 13.46 | 14.36 | 6,721,380 | 56,653,584 | |
| 2013-11-14 |
|
4 | AMED |
AMEDISYS INC
Common Stock |
P - Purchase | 13,333 | 3,477,948 | 0.38 | 13.98 | 186,438 | 48,632,842 | |
| 2013-11-05 |
|
4 | HCA |
HCA Holdings, Inc.
Common Stock, par value $0.01 per share |
S - Sale | -217,039 | 1,222,147 | -15.08 | 46.92 | -10,183,470 | 57,343,156 | |
| 2013-11-05 |
|
4 | HCA |
HCA Holdings, Inc.
Common Stock, par value $0.01 per share |
S - Sale | -611,009 | 1,439,186 | -29.80 | 46.92 | -28,668,542 | 67,526,626 | |
| 2013-11-05 |
|
4 | HCA |
HCA Holdings, Inc.
Common Stock, par value $0.01 per share |
S - Sale | -44,698 | 251,695 | -15.08 | 46.92 | -2,097,230 | 11,809,548 | |
| 2013-11-05 |
|
4 | HCA |
HCA Holdings, Inc.
Common Stock, par value $0.01 per share |
S - Sale | -125,834 | 296,393 | -29.80 | 46.92 | -5,904,131 | 13,906,778 | |
| 2013-11-05 |
|
4 | HCA |
HCA Holdings, Inc.
Common Stock, par value $0.01 per share |
S - Sale | -72,813 | 410,012 | -15.08 | 46.92 | -3,416,386 | 19,237,744 | |
| 2013-11-05 |
|
4 | HCA |
HCA Holdings, Inc.
Common Stock, par value $0.01 per share |
S - Sale | -204,984 | 482,825 | -29.80 | 46.92 | -9,617,849 | 22,654,130 | |
| 2013-11-05 |
|
4 | HCA |
HCA Holdings, Inc.
Common Stock, par value $0.01 per share |
S - Sale | -900,419 | 5,070,249 | -15.08 | 46.92 | -42,247,659 | 237,896,078 | |
| 2013-11-05 |
|
4 | HCA |
HCA Holdings, Inc.
Common Stock, par value $0.01 per share |
S - Sale | -2,534,859 | 5,970,668 | -29.80 | 46.92 | -118,935,584 | 280,143,738 | |
| 2013-11-05 |
|
4 | HCA |
HCA Holdings, Inc.
Common Stock, par value $0.01 per share |
S - Sale | -1,970,078 | 11,093,496 | -15.08 | 46.92 | -92,436,060 | 520,506,842 | |
| 2013-11-05 |
|
4 | HCA |
HCA Holdings, Inc.
Common Stock, par value $0.01 per share |
S - Sale | -5,546,165 | 13,063,574 | -29.80 | 46.92 | -260,226,062 | 612,942,901 | |
| 2013-11-05 |
|
4 | HCA |
HCA Holdings, Inc.
Common Stock, par value $0.01 per share |
S - Sale | -2,123,171 | 11,955,553 | -15.08 | 46.92 | -99,619,183 | 560,954,551 | |
| 2013-11-05 |
|
4 | HCA |
HCA Holdings, Inc.
Common Stock, par value $0.01 per share |
S - Sale | -5,977,149 | 14,078,724 | -29.80 | 46.92 | -280,447,831 | 660,573,735 | |
| 2013-10-31 |
|
4 | AMED |
AMEDISYS INC
Common Stock |
P - Purchase | 29,615 | 3,464,615 | 0.86 | 15.94 | 472,010 | 55,219,727 | |
| 2013-10-28 | 3 | NONE |
Sentio Healthcare Properties Inc
3% Senior Cumulative Preferred Stock, Series C |
1,000 | ||||||||
| 2013-10-23 |
|
4 | AMED |
AMEDISYS INC
Common Stock |
P - Purchase | 79,626 | 3,435,000 | 2.37 | 17.75 | 1,413,274 | 60,967,472 | |
| 2013-10-23 |
|
4 | AMED |
AMEDISYS INC
Common Stock |
P - Purchase | 106,387 | 3,355,374 | 3.27 | 17.40 | 1,851,208 | 58,385,856 | |
| 2013-10-21 |
|
4 | AMED |
AMEDISYS INC
Common Stock |
P - Purchase | 2,700 | 3,248,987 | 0.08 | 17.91 | 48,351 | 58,181,560 | |
| 2013-10-21 |
|
4 | AMED |
AMEDISYS INC
Common Stock |
P - Purchase | 9,952 | 3,246,287 | 0.31 | 17.96 | 178,702 | 58,291,628 | |
| 2013-10-21 | 3 | AMED |
AMEDISYS INC
Common Stock |
3,236,335 | ||||||||
| 2013-09-26 |
|
4 | RNET |
RigNet, Inc.
Warrants to purchase Common Stock |
X - Other | -6,712 | 0 | -100.00 | ||||
| 2013-09-26 |
|
4 | RNET |
RigNet, Inc.
Warrants to purchase Common Stock |
X - Other | -446,999 | 0 | -100.00 | ||||
| 2013-09-26 |
|
4 | RNET |
RigNet, Inc.
Warrants to purchase Common Stock |
X - Other | -246,598 | 0 | -100.00 | ||||
| 2013-09-26 |
|
4 | RNET |
RigNet, Inc.
Common Stock |
X - Other | 6,712 | 4,750,000 | 0.14 | 7.00 | 46,984 | 33,250,000 | |
| 2013-09-26 |
|
4 | RNET |
RigNet, Inc.
Common Stock |
X - Other | 446,999 | 4,743,288 | 10.40 | 7.00 | 3,128,993 | 33,203,016 | |
| 2013-09-26 |
|
4 | RNET |
RigNet, Inc.
Common Stock |
X - Other | 246,598 | 4,296,289 | 6.09 | 0.04 | 9,864 | 171,852 | |
| 2013-09-23 | 3 | RNET |
RigNet, Inc.
Common Stock |
4,049,691 | ||||||||
| 2013-05-21 |
|
4 | NLSN |
Nielsen Holdings N.V.
Common Stock |
S - Sale | -6,934,508 | 26,077,581 | -21.01 | 34.48 | -239,135,815 | 899,282,773 | |
| 2013-05-21 |
|
4 | NLSN |
Nielsen Holdings N.V.
Common Stock |
S - Sale | -1,379,153 | 5,186,379 | -21.01 | 34.48 | -47,559,953 | 178,851,761 | |
| 2013-04-05 |
|
4 | DG |
DOLLAR GENERAL CORP
Common Stock, par value $0.875 per share |
S - Sale | -251,669 | 210,339 | -54.47 | 50.14 | -12,618,684 | 10,546,397 | |
| 2013-04-05 |
|
4 | DG |
DOLLAR GENERAL CORP
Common Stock, par value $0.875 per share |
S - Sale | -1,609,088 | 1,344,837 | -54.47 | 50.14 | -80,679,672 | 67,430,127 | |
| 2013-04-05 |
|
4 | DG |
DOLLAR GENERAL CORP
Common Stock, par value $0.875 per share |
S - Sale | -376,187 | 314,407 | -54.47 | 50.14 | -18,862,016 | 15,764,367 | |
| 2013-04-05 |
|
4 | DG |
DOLLAR GENERAL CORP
Common Stock, par value $0.875 per share |
S - Sale | -2,286,982 | 1,911,404 | -54.47 | 50.14 | -114,669,277 | 95,837,797 | |
| 2013-04-05 |
|
4 | DG |
DOLLAR GENERAL CORP
Common Stock, par value $0.875 per share |
S - Sale | -10,837,228 | 9,057,495 | -54.47 | 50.14 | -543,378,612 | 454,142,799 | |
| 2013-03-20 |
|
4 | ZZ |
SEALY CORP
8% Senior Secured Third Lien Convertible Note due 2016 |
J - Other | -4,939,889 | 0 | -100.00 | ||||
| 2013-03-20 |
|
4 | ZZ |
SEALY CORP
Common Stock, par value $0.01 per share |
S - Sale | -46,625,921 | 0 | -100.00 | 2.20 | -102,577,026 | ||
| 2013-03-12 |
|
4 | JAZZ |
Jazz Pharmaceuticals plc
Common Stock |
S - Sale | -15,865 | 7,888 | -66.79 | 58.28 | -924,612 | 459,713 | |
| 2013-03-12 |
|
4 | JAZZ |
Jazz Pharmaceuticals plc
Common Stock |
S - Sale | -3,734,135 | 3,185,058 | -53.97 | 58.28 | -217,625,388 | 185,625,180 | |
| 2013-02-25 |
|
4 | NLSN |
Nielsen Holdings N.V.
Common Stock |
S - Sale | -7,031,829 | 33,012,088 | -17.56 | 31.57 | -222,019,453 | 1,042,307,160 | |
| 2013-02-25 |
|
4 | NLSN |
Nielsen Holdings N.V.
Common Stock |
S - Sale | -1,398,509 | 6,565,532 | -17.56 | 31.57 | -44,155,824 | 207,296,825 | |
| 2013-02-20 |
|
4 | HCA |
HCA Holdings, Inc.
Common Stock, par value $0.01 per share |
S - Sale | -972,920 | 2,050,195 | -32.18 | 35.87 | -34,898,640 | 73,540,509 | |
| 2013-02-20 |
|
4 | HCA |
HCA Holdings, Inc.
Common Stock, par value $0.01 per share |
S - Sale | -200,368 | 422,227 | -32.18 | 35.87 | -7,187,200 | 15,145,297 | |
| 2013-02-20 |
|
4 | HCA |
HCA Holdings, Inc.
Common Stock, par value $0.01 per share |
S - Sale | -326,400 | 687,809 | -32.18 | 35.87 | -11,707,968 | 24,671,694 | |
| 2013-02-20 |
|
4 | HCA |
HCA Holdings, Inc.
Common Stock, par value $0.01 per share |
S - Sale | -4,036,298 | 8,505,527 | -32.18 | 35.87 | -144,782,009 | 305,093,250 | |
| 2013-02-20 |
|
4 | HCA |
HCA Holdings, Inc.
Common Stock, par value $0.01 per share |
S - Sale | -8,831,251 | 18,609,739 | -32.18 | 35.87 | -316,776,973 | 667,531,345 | |
| 2013-02-20 |
|
4 | HCA |
HCA Holdings, Inc.
Common Stock, par value $0.01 per share |
S - Sale | -9,517,514 | 20,055,873 | -32.18 | 35.87 | -341,393,227 | 719,404,168 | |
| 2012-12-18 |
|
4 | HCA |
HCA Holdings, Inc.
Common Stock, par value $0.01 per share |
S - Sale | -622,669 | 3,023,115 | -17.08 | 33.00 | -20,548,077 | 99,762,808 | |
| 2012-12-18 |
|
4 | HCA |
HCA Holdings, Inc.
Common Stock, par value $0.01 per share |
S - Sale | -128,236 | 622,595 | -17.08 | 33.00 | -4,231,788 | 20,545,648 | |
| 2012-12-18 |
|
4 | HCA |
HCA Holdings, Inc.
Common Stock, par value $0.01 per share |
S - Sale | -208,896 | 1,014,209 | -17.08 | 33.00 | -6,893,568 | 33,468,884 | |
| 2012-12-18 |
|
4 | HCA |
HCA Holdings, Inc.
Common Stock, par value $0.01 per share |
S - Sale | -2,583,231 | 12,541,825 | -17.08 | 33.00 | -85,246,623 | 413,880,222 | |
| 2012-12-18 |
|
4 | HCA |
HCA Holdings, Inc.
Common Stock, par value $0.01 per share |
S - Sale | -5,652,001 | 27,440,990 | -17.08 | 33.00 | -186,516,033 | 905,552,677 | |
| 2012-12-18 |
|
4 | HCA |
HCA Holdings, Inc.
Common Stock, par value $0.01 per share |
S - Sale | -6,091,208 | 29,573,387 | -17.08 | 33.00 | -201,009,864 | 975,921,774 | |
| 2012-12-13 |
|
4 | AVGO |
Avago Technologies LTD
Ordinary Shares, no par value |
S - Sale | -390,665 | 0 | -100.00 | 34.43 | -13,450,596 | ||
| 2012-12-13 |
|
4 | AVGO |
Avago Technologies LTD
Ordinary Shares, no par value |
S - Sale | -1,506,428 | 0 | -100.00 | 34.43 | -51,866,316 | ||
| 2012-12-13 |
|
4 | AVGO |
Avago Technologies LTD
Ordinary Shares, no par value |
S - Sale | -2,950,886 | 0 | -100.00 | 34.43 | -101,599,005 | ||
| 2012-12-13 |
|
4 | AVGO |
Avago Technologies LTD
Ordinary Shares, no par value |
S - Sale | -4,339,604 | 0 | -100.00 | 34.43 | -149,412,566 | ||
| 2012-12-13 |
|
4 | AVGO |
Avago Technologies LTD
Ordinary Shares, no par value |
S - Sale | -2,209,597 | 0 | -100.00 | 34.43 | -76,076,425 | ||
| 2012-12-03 |
|
4 | DG |
DOLLAR GENERAL CORP
Common Stock, par value $0.875 per share |
S - Sale | X | -55,890 | 462,008 | -10.79 | 50.07 | -2,798,412 | 23,132,741 |
| 2012-12-03 |
|
4 | DG |
DOLLAR GENERAL CORP
Common Stock, par value $0.875 per share |
S - Sale | X | -357,341 | 2,953,925 | -10.79 | 50.07 | -17,892,064 | 147,903,025 |
| 2012-12-03 |
|
4 | DG |
DOLLAR GENERAL CORP
Common Stock, par value $0.875 per share |
S - Sale | X | -83,542 | 690,594 | -10.79 | 50.07 | -4,182,948 | 34,578,042 |
| 2012-12-03 |
|
4 | DG |
DOLLAR GENERAL CORP
Common Stock, par value $0.875 per share |
S - Sale | X | -507,885 | 4,198,386 | -10.79 | 50.07 | -25,429,802 | 210,213,187 |
| 2012-12-03 |
|
4 | DG |
DOLLAR GENERAL CORP
Common Stock, par value $0.875 per share |
S - Sale | X | -2,406,693 | 19,894,723 | -10.79 | 50.07 | -120,503,119 | 996,128,781 |
| 2012-12-03 |
|
4 | DG |
DOLLAR GENERAL CORP
Common Stock, par value $0.875 per share |
S - Sale | X | -24,323 | 517,898 | -4.49 | 49.98 | -1,215,664 | 25,884,542 |
| 2012-12-03 |
|
4 | DG |
DOLLAR GENERAL CORP
Common Stock, par value $0.875 per share |
S - Sale | X | -155,513 | 3,311,266 | -4.49 | 49.98 | -7,772,540 | 165,497,075 |
| 2012-12-03 |
|
4 | DG |
DOLLAR GENERAL CORP
Common Stock, par value $0.875 per share |
S - Sale | X | -36,357 | 774,136 | -4.49 | 49.98 | -1,817,123 | 38,691,317 |
| 2012-12-03 |
|
4 | DG |
DOLLAR GENERAL CORP
Common Stock, par value $0.875 per share |
S - Sale | X | -221,029 | 4,706,271 | -4.49 | 49.98 | -11,047,029 | 235,219,425 |
| 2012-12-03 |
|
4 | DG |
DOLLAR GENERAL CORP
Common Stock, par value $0.875 per share |
S - Sale | X | -1,047,382 | 22,301,416 | -4.49 | 49.98 | -52,348,152 | 1,114,624,772 |
| 2012-11-29 |
|
4 | DG |
DOLLAR GENERAL CORP
Common Stock, par value $0.875 per share |
S - Sale | X | -9,962 | 542,221 | -1.80 | 49.60 | -494,115 | 26,894,162 |
| 2012-11-29 |
|
4 | DG |
DOLLAR GENERAL CORP
Common Stock, par value $0.875 per share |
S - Sale | X | -63,692 | 3,446,779 | -1.81 | 49.60 | -3,159,123 | 170,960,238 |
| 2012-11-29 |
|
4 | DG |
DOLLAR GENERAL CORP
Common Stock, par value $0.875 per share |
S - Sale | X | -14,891 | 810,493 | -1.80 | 49.60 | -738,594 | 40,200,453 |
| 2012-11-29 |
|
4 | DG |
DOLLAR GENERAL CORP
Common Stock, par value $0.875 per share |
S - Sale | X | -90,525 | 4,927,300 | -1.80 | 49.60 | -4,490,040 | 244,394,080 |
| 2012-11-29 |
|
4 | DG |
DOLLAR GENERAL CORP
Common Stock, par value $0.875 per share |
S - Sale | X | -428,969 | 23,348,798 | -1.80 | 49.60 | -21,276,862 | 1,158,100,381 |
| 2012-11-29 |
|
4 | DG |
DOLLAR GENERAL CORP
Common Stock, par value $0.875 per share |
S - Sale | X | -1,908 | 552,183 | -0.34 | 50.30 | -95,972 | 27,774,805 |
| 2012-11-29 |
|
4 | DG |
DOLLAR GENERAL CORP
Common Stock, par value $0.875 per share |
S - Sale | X | -11,753 | 554,091 | -2.08 | 49.73 | -584,477 | 27,554,945 |
| 2012-11-29 |
|
4 | DG |
DOLLAR GENERAL CORP
Common Stock, par value $0.875 per share |
S - Sale | X | -12,200 | 3,530,471 | -0.34 | 50.30 | -613,660 | 177,582,691 |
| 2012-11-29 |
|
4 | DG |
DOLLAR GENERAL CORP
Common Stock, par value $0.875 per share |
S - Sale | X | -75,144 | 3,542,671 | -2.08 | 49.73 | -3,736,911 | 176,177,029 |
| 2012-11-29 |
|
4 | DG |
DOLLAR GENERAL CORP
Common Stock, par value $0.875 per share |
S - Sale | X | -2,852 | 825,384 | -0.34 | 50.30 | -143,456 | 41,516,815 |
| 2012-11-29 |
|
4 | DG |
DOLLAR GENERAL CORP
Common Stock, par value $0.875 per share |
S - Sale | X | -17,568 | 828,236 | -2.08 | 49.73 | -873,657 | 41,188,176 |
| 2012-11-29 |
|
4 | DG |
DOLLAR GENERAL CORP
Common Stock, par value $0.875 per share |
S - Sale | X | -17,340 | 5,017,825 | -0.34 | 50.30 | -872,202 | 252,396,598 |
| 2012-11-29 |
|
4 | DG |
DOLLAR GENERAL CORP
Common Stock, par value $0.875 per share |
S - Sale | X | -106,801 | 5,035,165 | -2.08 | 49.73 | -5,311,214 | 250,398,755 |
| 2012-11-29 |
|
4 | DG |
DOLLAR GENERAL CORP
Common Stock, par value $0.875 per share |
S - Sale | X | -82,170 | 23,777,767 | -0.34 | 50.30 | -4,133,151 | 1,196,021,680 |
| 2012-11-29 |
|
4 | DG |
DOLLAR GENERAL CORP
Common Stock, par value $0.875 per share |
S - Sale | X | -506,092 | 23,859,937 | -2.08 | 49.73 | -25,167,955 | 1,186,554,667 |
| 2012-11-21 |
|
4 | ROC |
Rockwood Holdings, Inc.
Common Stock, par value $0.01 per share |
S - Sale | -149,806 | 0 | -100.00 | 42.67 | -6,392,222 | ||
| 2012-11-21 |
|
4 | ROC |
Rockwood Holdings, Inc.
Common Stock, par value $0.01 per share |
S - Sale | -5,011,109 | 0 | -100.00 | 42.67 | -213,824,021 | ||
| 2012-11-21 |
|
4 | ROC |
Rockwood Holdings, Inc.
Common Stock, par value $0.01 per share |
S - Sale | -1,739,923 | 0 | -100.00 | 42.67 | -74,242,514 | ||
| 2012-11-16 |
|
4 | ROC |
Rockwood Holdings, Inc.
Warrants to purchase Common Stock |
X - Other | -973,170 | 0 | -100.00 | ||||
| 2012-11-16 |
|
4 | ROC |
Rockwood Holdings, Inc.
Common Stock, par value $0.01 per share |
J - Other | -305,351 | 1,739,923 | -14.93 | 45.85 | -14,000,954 | 79,778,949 | |
| 2012-11-16 |
|
4 | ROC |
Rockwood Holdings, Inc.
Common Stock, par value $0.01 per share |
X - Other | 973,170 | 2,045,274 | 90.77 | 14.39 | 14,000,997 | 29,425,357 | |
| 2012-11-07 |
|
4 | KKR |
KKR & Co. L.P.
KKR Holdings L.P. Units |
C - Conversion | -3,000,000 | 0 | -100.00 | ||||
| 2012-11-07 |
|
4 | KKR |
KKR & Co. L.P.
Common Units |
G - Gift | -1,500,000 | 1,500,000 | -50.00 | ||||
| 2012-11-07 |
|
4 | KKR |
KKR & Co. L.P.
Common Units |
C - Conversion | 3,000,000 | 3,000,000 | |||||
| 2012-11-07 |
|
4 | KKR |
KKR & Co. L.P.
KKR Holdings L.P. Units |
G - Gift | 3,000,000 | 3,000,000 | |||||
| 2012-11-07 |
|
4 | KKR |
KKR & Co. L.P.
KKR Holdings L.P. Units |
G - Gift | -3,000,000 | 80,814,740 | -3.58 | ||||
| 2012-11-07 |
|
4 | KKR |
KKR & Co. L.P.
Common units |
J - Other | -3,639,010 | 4,667,166 | -43.81 | ||||
| 2012-11-02 |
|
4 | NONE |
KKR Alternative Corporate Opportunities Fund
Common Stock |
P - Purchase | 2,500,000 | 2,510,000 | 25,000.00 | 10.00 | 25,000,000 | 25,100,000 | |
| 2012-10-22 | 3 | NONE |
KKR Alternative Corporate Opportunities Fund P
Common Stock |
10,000 | ||||||||
| 2012-10-22 | 3 | NONE |
KKR Alternative Corporate Opportunities Fund
Common Stock |
10,000 | ||||||||
| 2012-10-12 |
|
4 | DG |
DOLLAR GENERAL CORP
Common Stock, par value $0.875 per share |
J - Other | -42,062 | 565,844 | -6.92 | 50.72 | -2,133,174 | 28,696,778 | |
| 2012-10-12 |
|
4 | DG |
DOLLAR GENERAL CORP
Common Stock, par value $0.875 per share |
J - Other | -268,933 | 3,617,815 | -6.92 | 50.72 | -13,638,937 | 183,477,488 | |
| 2012-10-12 |
|
4 | DG |
DOLLAR GENERAL CORP
Common Stock, par value $0.875 per share |
J - Other | -62,874 | 845,804 | -6.92 | 50.72 | -3,188,655 | 42,894,950 | |
| 2012-10-12 |
|
4 | DG |
DOLLAR GENERAL CORP
Common Stock, par value $0.875 per share |
J - Other | -382,232 | 5,141,966 | -6.92 | 50.72 | -19,384,896 | 260,774,806 | |
| 2012-10-12 |
|
4 | DG |
DOLLAR GENERAL CORP
Common Stock, par value $0.875 per share |
J - Other | -1,811,269 | 24,366,029 | -6.92 | 50.72 | -91,858,507 | 1,235,723,161 | |
| 2012-10-12 |
|
4 | DG |
DOLLAR GENERAL CORP
Common Stock, par value $0.875 per share |
S - Sale | -46,156 | 607,906 | -7.06 | 50.72 | -2,340,802 | 30,829,953 | |
| 2012-10-12 |
|
4 | DG |
DOLLAR GENERAL CORP
Common Stock, par value $0.875 per share |
S - Sale | -295,105 | 3,886,748 | -7.06 | 50.72 | -14,966,250 | 197,116,425 | |
| 2012-10-12 |
|
4 | DG |
DOLLAR GENERAL CORP
Common Stock, par value $0.875 per share |
S - Sale | -68,992 | 908,678 | -7.06 | 50.72 | -3,498,929 | 46,083,605 | |
| 2012-10-12 |
|
4 | DG |
DOLLAR GENERAL CORP
Common Stock, par value $0.875 per share |
S - Sale | -419,430 | 5,524,198 | -7.06 | 50.72 | -21,271,392 | 280,159,702 | |
| 2012-10-12 |
|
4 | DG |
DOLLAR GENERAL CORP
Common Stock, par value $0.875 per share |
S - Sale | -1,987,537 | 26,177,298 | -7.06 | 50.72 | -100,797,939 | 1,327,581,668 | |
| 2012-10-05 |
|
4 | DG |
DOLLAR GENERAL CORP
Common Stock, par value $0.875 per share |
S - Sale | -303,683 | 654,062 | -31.71 | 50.72 | -15,401,283 | 33,170,754 | |
| 2012-10-05 |
|
4 | DG |
DOLLAR GENERAL CORP
Common Stock, par value $0.875 per share |
S - Sale | -1,941,651 | 4,181,853 | -31.71 | 50.72 | -98,470,830 | 212,082,675 | |
| 2012-10-05 |
|
4 | DG |
DOLLAR GENERAL CORP
Common Stock, par value $0.875 per share |
S - Sale | -453,936 | 977,670 | -31.71 | 50.72 | -23,021,364 | 49,582,534 | |
| 2012-10-05 |
|
4 | DG |
DOLLAR GENERAL CORP
Common Stock, par value $0.875 per share |
S - Sale | -2,759,650 | 5,943,628 | -31.71 | 50.72 | -139,955,650 | 301,431,094 | |
| 2012-10-05 |
|
4 | DG |
DOLLAR GENERAL CORP
Common Stock, par value $0.875 per share |
S - Sale | -13,077,044 | 28,164,835 | -31.71 | 50.72 | -663,202,286 | 1,428,379,607 | |
| 2012-08-17 |
|
4 | KKR |
KKR & Co. L.P.
KKR Holdings L.P. Units |
G - Gift | -172,500 | 1,500,000 | -10.31 | ||||
| 2012-06-13 |
|
4 | DG |
DOLLAR GENERAL CORP
Common Stock, par value $0.875 per share |
S - Sale | -290,569 | 957,745 | -23.28 | 45.23 | -13,142,639 | 43,319,477 | |
| 2012-06-13 |
|
4 | DG |
DOLLAR GENERAL CORP
Common Stock, par value $0.875 per share |
S - Sale | -1,857,793 | 6,123,504 | -23.28 | 45.23 | -84,029,278 | 276,970,372 | |
| 2012-06-13 |
|
4 | DG |
DOLLAR GENERAL CORP
Common Stock, par value $0.875 per share |
S - Sale | -434,331 | 1,431,606 | -23.28 | 45.23 | -19,645,095 | 64,752,542 | |
| 2012-06-13 |
|
4 | DG |
DOLLAR GENERAL CORP
Common Stock, par value $0.875 per share |
S - Sale | -2,640,464 | 8,703,278 | -23.28 | 45.23 | -119,430,035 | 393,655,356 | |
| 2012-06-13 |
|
4 | DG |
DOLLAR GENERAL CORP
Common Stock, par value $0.875 per share |
S - Sale | -12,512,266 | 41,241,879 | -23.28 | 45.23 | -565,938,550 | 1,865,399,056 | |
| 2012-04-04 |
|
4 | DG |
DOLLAR GENERAL CORP
Common Stock, par value $0.875 per share |
J - Other | -58,207 | 1,248,314 | -4.46 | 44.01 | -2,561,434 | 54,932,807 | |
| 2012-04-04 |
|
4 | DG |
DOLLAR GENERAL CORP
Common Stock, par value $0.875 per share |
S - Sale | -240,356 | 1,306,521 | -15.54 | 44.01 | -10,577,010 | 57,494,241 | |
| 2012-04-04 |
|
4 | DG |
DOLLAR GENERAL CORP
Common Stock, par value $0.875 per share |
J - Other | -372,157 | 7,981,297 | -4.46 | 44.01 | -16,376,992 | 351,221,763 | |
| 2012-04-04 |
|
4 | DG |
DOLLAR GENERAL CORP
Common Stock, par value $0.875 per share |
S - Sale | -1,536,752 | 8,353,454 | -15.54 | 44.01 | -67,625,694 | 367,598,755 | |
| 2012-04-04 |
|
4 | DG |
DOLLAR GENERAL CORP
Common Stock, par value $0.875 per share |
J - Other | -87,006 | 1,865,937 | -4.46 | 44.01 | -3,828,751 | 82,111,677 | |
| 2012-04-04 |
|
4 | DG |
DOLLAR GENERAL CORP
Common Stock, par value $0.875 per share |
S - Sale | -359,275 | 1,952,943 | -15.54 | 44.01 | -15,810,112 | 85,940,428 | |
| 2012-04-04 |
|
4 | DG |
DOLLAR GENERAL CORP
Common Stock, par value $0.875 per share |
J - Other | -528,942 | 11,343,742 | -4.46 | 44.01 | -23,276,410 | 499,188,173 | |
| 2012-04-04 |
|
4 | DG |
DOLLAR GENERAL CORP
Common Stock, par value $0.875 per share |
S - Sale | -2,184,171 | 11,872,684 | -15.54 | 44.01 | -96,115,755 | 522,464,583 | |
| 2012-04-04 |
|
4 | DG |
DOLLAR GENERAL CORP
Common Stock, par value $0.875 per share |
J - Other | -2,506,475 | 53,754,145 | -4.46 | 44.01 | -110,298,936 | 2,365,483,403 | |
| 2012-04-04 |
|
4 | DG |
DOLLAR GENERAL CORP
Common Stock, par value $0.875 per share |
S - Sale | -10,350,049 | 56,260,620 | -15.54 | 44.01 | -455,460,116 | 2,475,782,339 | |
| 2012-03-28 |
|
4 | NLSN |
Nielsen Holdings N.V.
Common Stock |
S - Sale | -6,615,207 | 40,043,916 | -14.18 | 29.12 | -192,605,721 | 1,165,902,641 | |
| 2012-03-28 |
|
4 | NLSN |
Nielsen Holdings N.V.
Common Stock |
S - Sale | -1,315,650 | 7,964,041 | -14.18 | 29.12 | -38,305,939 | 231,877,832 | |
| 2012-03-13 |
|
4 | JAZZ |
Jazz Pharmaceuticals plc
Common Stock |
S - Sale | -12,692 | 23,753 | -34.83 | 49.56 | -629,016 | 1,177,199 | |
| 2012-03-13 |
|
4 | JAZZ |
Jazz Pharmaceuticals plc
Common Stock |
S - Sale | -2,987,308 | 6,919,193 | -30.16 | 49.56 | -148,050,984 | 342,915,205 | |
| 2012-02-14 |
|
5 | ROC |
Rockwood Holdings, Inc.
Common Stock, par value $0.01 per share |
G - Gift | -309,055 | 825,129 | -27.25 | ||||
| 2012-02-14 |
|
5 | ROC |
Rockwood Holdings, Inc.
Common Stock, par value $0.01 per share |
G - Gift | -440,816 | 1,134,184 | -27.99 | ||||
| 2012-01-18 |
|
4 | JAZZ |
Jazz Pharmaceuticals plc
Common Stock Warrant (right to buy) |
U - Other | -597,837 | 0 | -100.00 | ||||
| 2012-01-18 |
|
4 | JAZZ |
Jazz Pharmaceuticals plc
Common Stock |
U - Other | -36,445 | 0 | -100.00 | ||||
| 2012-01-18 |
|
4 | JAZZ |
Jazz Pharmaceuticals plc
Common Stock |
U - Other | -9,906,501 | 0 | -100.00 | ||||
| 2012-01-18 | 3 | JAZZ |
Jazz Pharmaceuticals plc
Common Stock |
9,906,501 | ||||||||
| 2012-01-18 | 3 | JAZZ |
Jazz Pharmaceuticals plc
Common Stock |
36,445 | ||||||||
| 2011-01-25 | 3 | NLSN |
Nielsen Holdings N.V.
Common Stock |
9,279,691 | ||||||||
| 2011-01-25 | 3 | NLSN |
Nielsen Holdings N.V.
Common Stock |
46,659,123 | ||||||||
| 2011-01-25 | 3 | NLSN |
Nielsen Holdings N.V.
Common Stock |
174 | ||||||||
| 2010-07-14 | 3 | KKR |
KKR & Co. L.P.
Common Units |
4,667,166 | ||||||||
| 2010-07-14 | 3 | KKR |
KKR & Co. L.P.
Common Units |
208,634 | ||||||||
| 2010-04-22 |
|
4 | DG |
DOLLAR GENERAL CORP
Common Stock, par value $0.875 per share |
S - Sale | -253,320 | 2,305,671 | -9.90 | 25.92 | -6,566,054 | 59,762,992 | |
| 2010-04-22 |
|
4 | DG |
DOLLAR GENERAL CORP
Common Stock, par value $0.875 per share |
S - Sale | -1,619,639 | 14,741,679 | -9.90 | 25.92 | -41,981,043 | 382,104,320 | |
| 2010-04-22 |
|
4 | DG |
DOLLAR GENERAL CORP
Common Stock, par value $0.875 per share |
S - Sale | -378,653 | 3,446,437 | -9.90 | 25.92 | -9,814,686 | 89,331,647 | |
| 2010-04-22 |
|
4 | DG |
DOLLAR GENERAL CORP
Common Stock, par value $0.875 per share |
S - Sale | -2,301,978 | 20,952,208 | -9.90 | 25.92 | -59,667,270 | 543,081,231 | |
| 2010-04-22 |
|
4 | DG |
DOLLAR GENERAL CORP
Common Stock, par value $0.875 per share |
S - Sale | -10,908,293 | 99,285,406 | -9.90 | 25.92 | -282,742,955 | 2,573,477,724 | |
| 2009-11-12 | 3 | DG |
DOLLAR GENERAL CORP
Common Stock, par value $0.875 per share |
116,265,659 | ||||||||
| 2009-11-12 | 3 | DG |
DOLLAR GENERAL CORP
Common Stock, par value $0.875 per share |
24,535,553 | ||||||||
| 2009-11-12 | 3 | DG |
DOLLAR GENERAL CORP
Common Stock, par value $0.875 per share |
4,035,862 | ||||||||
| 2009-11-12 | 3 | DG |
DOLLAR GENERAL CORP
Common Stock, par value $0.875 per share |
17,262,869 | ||||||||
| 2009-11-12 | 3 | DG |
DOLLAR GENERAL CORP
Common Stock, par value $0.875 per share |
2,699,999 | ||||||||
| 2009-07-16 |
|
4 | ZZ |
SEALY CORP
8% Senior Secured Third Lien Convertible Notes due 2016 |
P - Purchase | 3,753,910 | 3,753,910 | 25.00 | 93,847,750 | 93,847,750 | ||
| 2008-04-29 | 3 | HCA INC. |
HCA INC/TN
Common stock, par value $0.01 per share |
9,313,725 | ||||||||
| 2008-04-29 | 3 | HCA INC. |
HCA INC/TN
Common stock, par value $0.01 per share |
8,642,157 | ||||||||
| 2008-04-29 | 3 | HCA INC. |
HCA INC/TN
Common stock, par value $0.01 per share |
4,901,961 | ||||||||
| 2008-04-29 | 3 | HCA INC. |
HCA INC/TN
Common stock, par value $0.01 per share |
319,411 | ||||||||
| 2008-04-29 | 3 | HCA INC. |
HCA INC/TN
Common stock, par value $0.01 per share |
196,078 | ||||||||
| 2006-11-29 |
|
4 | AIQ |
ALLIANCE IMAGING INC /DE/
Common Stock |
S - Sale | -1,200,000 | 25,944,570 | -4.42 | 5.40 | -6,486,000 | 140,230,401 | |
| 2006-11-29 |
|
4 | AIQ |
ALLIANCE IMAGING INC /DE/
Common Stock |
S - Sale | -8,000,000 | 27,144,570 | -22.76 | 5.40 | -43,240,000 | 146,716,401 | |
| 2006-08-16 |
|
4 | NRG |
NRG ENERGY, INC.
Common Stock, par value $0.01 per share |
S - Sale | -215,786 | 215,786 | -50.00 | 48.41 | -10,446,200 | 10,446,200 | |
| 2006-08-16 |
|
4 | NRG |
NRG ENERGY, INC.
Common Stock, par value $0.01 per share |
S - Sale | -4,099,941 | 4,099,941 | -50.00 | 48.41 | -198,478,144 | 198,478,144 | |
| 2006-08-11 | 3 | NRG |
NRG ENERGY, INC.
Common stock, par value $0.01 per share |
8,199,882 | ||||||||
| 2006-08-11 | 3 | NRG |
NRG ENERGY, INC.
Common stock, par value $0.01 per share |
431,572 | ||||||||
| 2006-04-13 |
|
4 | ZZ |
SEALY CORP
Common stock, par value $0.01 per share |
S - Sale | -3,481,868 | 46,625,921 | -6.95 | 16.00 | -55,709,888 | 746,014,736 | |
| 2006-04-10 |
|
4 | ZZ |
SEALY CORP
Common Stock, par value $0.01 per share |
P - Purchase | 146,000 | 146,000 | 16.00 | 2,336,000 | 2,336,000 | ||
| 2006-04-10 |
|
4 | ZZ |
SEALY CORP
Common stock, par value $0.01 per share |
S - Sale | -6,632,130 | 50,107,789 | -11.69 | 16.00 | -106,114,080 | 801,724,624 | |
| 2006-04-06 | 3 | ZZ |
SEALY CORP
Common stock, par value $0.01 per share |
56,739,919 | ||||||||
| 2005-10-14 |
|
4 | ACW |
ACCURIDE CORP
Common Stock |
S - Sale | -641,137 | 7,850,213 | -7.55 | 13.25 | -8,495,065 | 104,015,322 | |
| 2005-10-07 |
|
4 | ACW |
ACCURIDE CORP
Common Stock |
S - Sale | -4,274,250 | 8,491,350 | -33.48 | 13.25 | -56,633,812 | 112,510,388 | |
| 2005-08-12 | 3/A | ROC |
Rockwood Holdings, Inc.
Common Stock, par value $0.01 per share |
4,445,896 | ||||||||
| 2005-08-12 | 3/A | ROC |
Rockwood Holdings, Inc.
Common Stock, par value $0.01 per share |
19,138,916 | ||||||||
| 2005-08-12 | 3/A | ROC |
Rockwood Holdings, Inc.
Common Stock, par value $0.01 per share |
164,282 | ||||||||
| 2005-08-12 | 3/A | ROC |
Rockwood Holdings, Inc.
Common Stock, par value $0.01 per share |
398,727 | ||||||||
| 2005-08-12 | 3/A | ROC |
Rockwood Holdings, Inc.
Common Stock, par value $0.01 per share |
13,337,689 | ||||||||
| 2005-08-12 | 3/A | ROC |
Rockwood Holdings, Inc.
Series A Participating Preferred Stock, par value $0.01 p/sh |
25,000 | ||||||||
| 2005-08-12 | 3 | ROC |
Rockwood Holdings, Inc.
Common Stock, par value $0.01 per share |
4,445,896 | ||||||||
| 2005-08-12 | 3 | ROC |
Rockwood Holdings, Inc.
Common Stock, par value $0.01 per share |
19,138,916 | ||||||||
| 2005-08-12 | 3 | ROC |
Rockwood Holdings, Inc.
Common Stock, par value $0.01 per share |
164,282 | ||||||||
| 2005-08-12 | 3 | ROC |
Rockwood Holdings, Inc.
Common Stock, par value $0.01 per share |
398,727 | ||||||||
| 2005-08-12 | 3 | ROC |
Rockwood Holdings, Inc.
Common Stock, par value $0.01 per share |
13,337,689 | ||||||||
| 2005-08-12 | 3 | ROC |
Rockwood Holdings, Inc.
Series A Participating Preferred Stock, par value $0.01 p/sh |
25,000 | ||||||||
| 2005-04-27 |
|
4 | ACW |
ACCURIDE CORP
Common stock |
P - Purchase | 53,000 | 12,818,600 | 0.42 | 9.00 | 477,000 | 115,367,400 | |
| 2005-04-25 | 3 | ACW |
ACCURIDE CORP
Common Stock |
12,765,600 | ||||||||
| 2004-12-06 |
|
4 | OI |
OWENS ILLINOIS INC /DE/
Common Stock |
S - Sale | -202,475 | 28,925 | -87.50 | 22.98 | -4,652,876 | 664,696 | |
| 2004-12-06 |
|
4 | OI |
OWENS ILLINOIS INC /DE/
Common Stock |
S - Sale | -742,525 | 106,075 | -87.50 | 22.98 | -17,063,224 | 2,437,604 | |
| 2004-12-06 |
|
4 | OI |
OWENS ILLINOIS INC /DE/
Common Stock |
S - Sale | -30,555,000 | 4,365,000 | -87.50 | 22.98 | -702,153,900 | 100,307,700 | |
| 2003-11-24 | 3 | ZHNE |
ZHONE TECHNOLOGIES INC
Common Stock |
8,959,375 |
P
Compra de mercado aberto ou privada de ativo não-derivativo ou derivativo
S
Venda de mercado aberto ou privada de ativo não-derivativo ou derivativo
A
Concessão, premiação, ou outra aquisição de ativos da empresa (como uma opção)
C
Conversão de derivativo
D
Venda ou transferência de ativos de volta para a empresa
F
Pagamento do preço de exercício ou responsabilidade fiscal utilizando parte dos ativos recebidos da empresa
G
Doação de ativos pelo ou para o insider
K
Swaps de capital e transações de hedge similares
M
Exercício ou conversão de ativo derivativo recebido da empresa (como uma opção)
V
Uma transação voluntariamente reportada no Formulário 4
J
Outro (acompanhado de uma nota explicativa descrevendo a transação)