Park Ha Biological Technology Co., Ltd.
Introdução
Esta página fornece uma análise abrangente do histórico conhecido de negociações internas de Ronald L Nelson. Insiders são oficiais, diretores ou investidores significativos em uma empresa. É ilegal para insiders realizarem negociações em suas próprias empresas baseados em informações específicas, não públicas. Isso não significa que seja ilegal para eles realizarem qualquer negociação em suas próprias empresas. No entanto, eles devem reportar todas as negociações à SEC através de um Formulário 4. Apesar dessas restrições, pesquisas acadêmicas sugerem que insiders - em geral - tendem a superar o mercado em suas próprias empresas.
Rentabilidade Média de Negociação
A rentabilidade média de negociação é o retorno médio de todas as compras de mercado abertas feitas pelo insider nos últimos três anos. Para calcular isso, examinamos cada compra de mercado aberto, não planejada, feita pelo insider, excluindo todas as negociações que foram marcadas como parte de um plano de negociação 10b5-1. Em seguida, calculamos o desempenho médio dessas negociações ao longo de 3, 6 e 12 meses, fazendo a média de cada uma dessas durações para gerar uma métrica de desempenho final para cada negociação. Finalmente, fazemos a média de todas as métricas de desempenho para calcular uma métrica de desempenho para o insider. Esta lista inclui apenas insiders que fizeram pelo menos três negociações nos últimos dois anos.
Se a rentabilidade de negociação deste insider é "N/A", então o insider ou não fez quaisquer compras de mercado aberto nos últimos três anos, ou as negociações que eles fizeram são muito recentes para calcular uma métrica de desempenho confiável.
Frequência de Atualização: Diariamente
Empresas com Posições Internas Reportadas
As declarações à SEC indicam que Ronald L Nelson reportou posses ou negociações nas seguintes empresas:
| Ativo | Título | Últimas Posições Reportadas |
|---|---|---|
| US:WH / Wyndham Hotels & Resorts, Inc. | Director | 19,793 |
| US:US92556H3057 / ViacomCBS Inc | Director | 38,830 |
| US:HBI / Hanesbrands Inc. | Director | 302,291 |
| US:US9255M3Z371 / VIACOM INC. | Director | 0 |
| US:CVG / Convergys Corp. | Director | 0 |
| US:CAR / Avis Budget Group, Inc. | Executive Chairman, Director | 0 |
| US:PHH / Park Ha Biological Technology Co., Ltd. | Director | 0 |
Como Interpretar os Gráficos
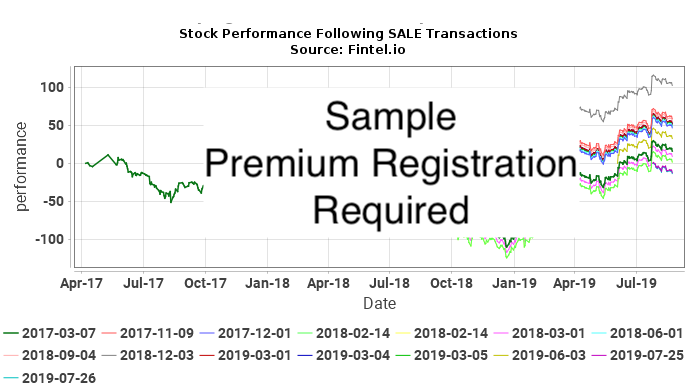
Os gráficos a seguir mostram o desempenho das ações dos a ativos ubsequentes a cada transação de mercado aberto, não planejada feita por Ronald L Nelson. Transações não planejadas são negociações que não foram feitas como parte de um plano de negociação 10b5-1. O desempenho das ações é representado como mudança percentual cumulativa no preço das ações. Por exemplo, se uma transação interna foi feita em 1 de janeiro de 2019, o gráfico mostrará a mudança percentual diária da segurança até o dia presente. Se o preço da ação passasse de $10 para $15 durante este período, a mudança percentual cumulativa no preço das ações seria de 50%. Uma mudança no preço de $10 para $20 seria de 100%, e uma mudança no preço de $10 para $5 seria de -50%.
Ultimamente, estamos tentando determinar quão estreitamente as negociações do interno correlacionam-se a retornos excessivos (positivos ou negativos) no preço da ação para ver se o interno está cronometrando suas transações para lucrar com informações internas. Considere a situação onde um interno estava fazendo isso. Nesta situação, esperaríamos (a) retornos positivos após compras, ou (b) retornos negativos após vendas. No caso de (a), o gráfico de COMPRA mostraria uma série de curvas ascendentes, indicando retornos positivos após cada transação de compra. No caso de (b), o gráfico de VENDA mostraria uma série de curvas descendentes, indicando retornos negativos após cada transação de venda.
No entanto, isso sozinho não é suficiente para tirar conclusões. Se, por exemplo, o preço da ação da empresa estivesse em uma escalada não cíclica ao longo de muitos anos, então esperaríamos que todos os gráficos pós-compra tivessem uma inclinação ascendente. Da mesma forma, declínios não cíclicos ao longo de muitos anos resultariam em gráficos pós-negociação inclinados para baixo. Nenhum desses gráficos sugeriria atividade de negociação interna.
O indicador mais forte seria uma situação em que o preço da ação fosse extremamente cíclico, e houvesse sinais positivos no gráfico de COMPRA e gráficos negativos no gráfico de VENDA. Esta situação seria altamente sugestiva de um interno que estava cronometrando transações para sua vantagem financeira.
Compras Internas BYAH / Park Ha Biological Technology Co., Ltd. - Análise de Lucro de Curto Prazo
Nesta seção, analisamos a lucratividade de cada compra interna de mercado aberto, não planejada, feita em BYAH / Park Ha Biological Technology Co., Ltd.. Esta análise ajuda a entender se o interno gera consistentemente retornos anormais, e vale a pena seguir. Esta análise é para um ano seguinte a cada transação, e os resultados são teóricos.
A tabela a seguir mostra as compras de mercado aberto mais recentes que não faziam parte de um plano de negociação automático.
| Data de Negociação | Ticker | Insider | Ações Reportadas |
Preço Reportado |
Ações Ajustadas |
Preço Ajustado |
Base de Custos | Dias para Máx |
Preço em Máx |
Lucro Máx ($) |
Retorno Máx (%) |
|---|---|---|---|---|---|---|---|
| Não há negociações abertas de mercado não planejadas conhecidas para esta combinação de insider e ativo |
O Preço Ajustado é o preço ajustado pela divisão. Ações Ajustadas são as ações ajustadas pela divisão.
Vendas Internas BYAH / Park Ha Biological Technology Co., Ltd. - Análise de Perda de Curto Prazo
Nesta seção, analisamos a evitação de perdas de curto prazo de cada venda interna de mercado aberto, não planejada feita em BYAH / Park Ha Biological Technology Co., Ltd.. Um padrão consistente de evitação de perdas pode sugerir que transações futuras de venda possam prever declínios no preço. Esta análise é para um ano seguinte a cada transação, e os resultados são teóricos.
A tabela a seguir mostra as vendas de mercado aberto mais recentes que não faziam parte de um plano de negociação automático.
| Data de Negociação | Ticker | Insider | Ações Reportadas |
Preço Reportado |
Ações Ajustadas |
Preço Ajustado |
Base de Custos | Dias para Mín |
Preço em Mín |
Máxima Perda Evitada ($) |
Máxima Perda Evitada (%) |
|---|---|---|---|---|---|---|---|
| Não há negociações abertas de mercado não planejadas conhecidas para esta combinação de insider e ativo |
O Preço Ajustado é o preço ajustado pela divisão. Ações Ajustadas são as ações ajustadas pela divisão.
Compras Internas WH / Wyndham Hotels & Resorts, Inc. - Análise de Lucro de Curto Prazo
Nesta seção, analisamos a lucratividade de cada compra interna de mercado aberto, não planejada, feita em BYAH / Park Ha Biological Technology Co., Ltd.. Esta análise ajuda a entender se o interno gera consistentemente retornos anormais, e vale a pena seguir. Esta análise é para um ano seguinte a cada transação, e os resultados são teóricos.
A tabela a seguir mostra as compras de mercado aberto mais recentes que não faziam parte de um plano de negociação automático.
O Preço Ajustado é o preço ajustado pela divisão. Ações Ajustadas são as ações ajustadas pela divisão.
Vendas Internas WH / Wyndham Hotels & Resorts, Inc. - Análise de Perda de Curto Prazo
Nesta seção, analisamos a evitação de perdas de curto prazo de cada venda interna de mercado aberto, não planejada feita em BYAH / Park Ha Biological Technology Co., Ltd.. Um padrão consistente de evitação de perdas pode sugerir que transações futuras de venda possam prever declínios no preço. Esta análise é para um ano seguinte a cada transação, e os resultados são teóricos.
A tabela a seguir mostra as vendas de mercado aberto mais recentes que não faziam parte de um plano de negociação automático.
| Data de Negociação | Ticker | Insider | Ações Reportadas |
Preço Reportado |
Ações Ajustadas |
Preço Ajustado |
Base de Custos | Dias para Mín |
Preço em Mín |
Máxima Perda Evitada ($) |
Máxima Perda Evitada (%) |
|---|---|---|---|---|---|---|---|
| Não há negociações abertas de mercado não planejadas conhecidas para esta combinação de insider e ativo |
O Preço Ajustado é o preço ajustado pela divisão. Ações Ajustadas são as ações ajustadas pela divisão.
Histórico de Negociações Insider
Esta tabela mostra a lista completa de negociações insider realizadas por Ronald L Nelson conforme divulgadas para a Comissão de Valores Mobiliários (SEC).
| Data do Arquivo | Data da Transação | Formulário | Ticker | Ativo | Código | Ações | Ações Restantes | Variação Percentual |
Preço da Ação |
Valor da Transação |
Valor Restante |
|
|---|---|---|---|---|---|---|---|---|---|---|---|---|
| 2026-05-05 |
|
4 | WH |
WYNDHAM HOTELS & RESORTS, INC.
Common Stock |
A - Award | 494 | 19,793 | 2.56 | 80.84 | 39,935 | 1,600,066 | |
| 2026-03-12 |
|
4 | WH |
WYNDHAM HOTELS & RESORTS, INC.
Common Stock |
A - Award | 326 | 19,299 | 1.72 | ||||
| 2026-03-11 |
|
4 | WH |
WYNDHAM HOTELS & RESORTS, INC.
Common Stock |
A - Award | 1,639 | 4,044 | 68.15 | ||||
| 2026-03-05 |
|
4 | WH |
WYNDHAM HOTELS & RESORTS, INC.
Common Stock |
A - Award | 300 | 18,973 | 1.61 | ||||
| 2026-03-03 |
|
4 | WH |
WYNDHAM HOTELS & RESORTS, INC.
Common Stock |
A - Award | 850 | 18,673 | 4.77 | ||||
| 2026-02-24 |
|
4 | WH |
WYNDHAM HOTELS & RESORTS, INC.
Common Stock |
A - Award | 460 | 17,823 | 2.65 | 84.27 | 38,764 | 1,501,944 | |
| 2025-10-28 |
|
4 | WH |
WYNDHAM HOTELS & RESORTS, INC.
Common Stock |
A - Award | 515 | 17,363 | 3.06 | 74.76 | 38,501 | 1,298,058 | |
| 2025-07-29 |
|
4 | WH |
WYNDHAM HOTELS & RESORTS, INC.
Common Stock |
A - Award | 416 | 16,848 | 2.53 | 92.00 | 38,272 | 1,550,016 | |
| 2025-05-06 |
|
4 | WH |
WYNDHAM HOTELS & RESORTS, INC.
Common Stock |
A - Award | 438 | 16,432 | 2.74 | 87.05 | 38,128 | 1,430,406 | |
| 2025-03-12 |
|
4 | WH |
WYNDHAM HOTELS & RESORTS, INC.
Common Stock |
A - Award | 316 | 15,994 | 2.02 | ||||
| 2025-03-05 |
|
4 | WH |
WYNDHAM HOTELS & RESORTS, INC.
Common Stock |
A - Award | 1,176 | 3,813 | 44.60 | ||||
| 2025-03-03 |
|
4 | WH |
WYNDHAM HOTELS & RESORTS, INC.
Common Stock |
A - Award | 828 | 15,678 | 5.58 | ||||
| 2025-03-03 |
|
4 | WH |
WYNDHAM HOTELS & RESORTS, INC.
Common Stock |
A - Award | 402 | 14,850 | 2.78 | ||||
| 2025-02-19 |
|
4 | WH |
WYNDHAM HOTELS & RESORTS, INC.
Common Stock |
A - Award | 338 | 14,448 | 2.40 | 109.32 | 36,950 | 1,579,455 | |
| 2024-10-29 |
|
4 | WH |
WYNDHAM HOTELS & RESORTS, INC.
Common Stock |
A - Award | 413 | 14,110 | 3.02 | ||||
| 2024-07-30 |
|
4 | WH |
WYNDHAM HOTELS & RESORTS, INC.
Common Stock |
A - Award | 480 | 13,697 | 3.63 | ||||
| 2024-04-30 |
|
4 | WH |
WYNDHAM HOTELS & RESORTS, INC.
Common Stock |
A - Award | 486 | 13,217 | 3.82 | ||||
| 2024-03-12 |
|
4 | WH |
WYNDHAM HOTELS & RESORTS, INC.
Common Stock |
A - Award | 312 | 12,731 | 2.51 | ||||
| 2024-03-05 |
|
4 | WH |
WYNDHAM HOTELS & RESORTS, INC.
Common Stock |
A - Award | 412 | 12,419 | 3.43 | ||||
| 2024-03-01 |
|
4 | WH |
WYNDHAM HOTELS & RESORTS, INC.
Common Stock |
A - Award | 1,632 | 4,539 | 56.14 | ||||
| 2024-02-29 |
|
4 | WH |
WYNDHAM HOTELS & RESORTS, INC.
Common Stock |
A - Award | 893 | 12,007 | 8.03 | ||||
| 2024-02-21 |
|
4 | WH |
WYNDHAM HOTELS & RESORTS, INC.
Common Stock |
A - Award | 452 | 11,114 | 4.24 | ||||
| 2023-10-31 |
|
4 | WH |
WYNDHAM HOTELS & RESORTS, INC.
Common Stock |
A - Award | 496 | 10,662 | 4.88 | ||||
| 2023-08-01 |
|
4 | WH |
WYNDHAM HOTELS & RESORTS, INC.
Common Stock |
A - Award | 460 | 10,166 | 4.74 | ||||
| 2023-05-02 |
|
4 | WH |
WYNDHAM HOTELS & RESORTS, INC.
Common Stock |
A - Award | 508 | 9,706 | 5.52 | ||||
| 2023-04-04 |
|
4 | PARAA,PARA |
Paramount Global
Class B common stock |
A - Award | 31 | 38,830 | 0.08 | ||||
| 2023-03-14 |
|
4 | WH |
WYNDHAM HOTELS & RESORTS, INC.
Common Stock |
A - Award | 307 | 9,198 | 3.45 | ||||
| 2023-03-03 |
|
4 | WH |
WYNDHAM HOTELS & RESORTS, INC.
Common Stock |
A - Award | 1,617 | 4,060 | 66.19 | ||||
| 2023-03-01 |
|
4 | WH |
WYNDHAM HOTELS & RESORTS, INC.
Common Stock |
A - Award | 878 | 8,891 | 10.96 | ||||
| 2023-02-22 |
|
4 | WH |
WYNDHAM HOTELS & RESORTS, INC.
Common Stock |
A - Award | 442 | 8,013 | 5.84 | ||||
| 2023-02-17 |
|
4 | PARAA,PARA |
Paramount Global
Class B common stock |
A - Award | 356 | 38,799 | 0.93 | ||||
| 2023-02-17 |
|
4 | PARAA,PARA |
Paramount Global
Class B common stock |
M - Exercise | 5,558 | 38,443 | 16.90 | ||||
| 2023-01-26 |
|
4 | HBI |
Hanesbrands Inc.
Common Stock |
D - Sale to Issuer | -9,515 | 302,291 | -3.05 | ||||
| 2023-01-25 |
|
4 | HBI |
Hanesbrands Inc.
Common Stock |
A - Award | 31,053 | 311,806 | 11.06 | ||||
| 2023-01-04 |
|
4 | PARAA,PARA |
Paramount Global
Class B common stock |
A - Award | 43 | 32,692 | 0.13 | ||||
| 2022-10-31 |
|
4 | WH |
WYNDHAM HOTELS & RESORTS, INC.
Common Stock |
A - Award | 459 | 7,571 | 6.45 | ||||
| 2022-09-06 |
|
4/A | HBI |
Hanesbrands Inc.
Common Stock |
P - Purchase | 10,000 | 280,753 | 3.69 | 8.62 | 86,200 | 2,420,091 | |
| 2022-09-06 |
|
4/A | HBI |
Hanesbrands Inc.
Common Stock |
P - Purchase | 5,000 | 270,753 | 1.88 | 8.59 | 42,950 | 2,325,768 | |
| 2022-09-06 |
|
4/A | HBI |
Hanesbrands Inc.
Common Stock |
P - Purchase | 5,000 | 265,753 | 1.92 | 8.66 | 43,300 | 2,301,421 | |
| 2022-09-06 |
|
4/A | HBI |
Hanesbrands Inc.
Common Stock |
P - Purchase | 5,000 | 260,753 | 1.96 | 8.79 | 43,950 | 2,292,019 | |
| 2022-09-06 |
|
4/A | HBI |
Hanesbrands Inc.
Common Stock |
P - Purchase | 10,000 | 255,753 | 4.07 | 8.84 | 88,400 | 2,260,857 | |
| 2022-09-01 |
|
4 | HBI |
Hanesbrands Inc.
Common Stock |
A - Award | 10,000 | 280,753 | 3.69 | 8.62 | 86,200 | 2,420,091 | |
| 2022-09-01 |
|
4 | HBI |
Hanesbrands Inc.
Common Stock |
A - Award | 5,000 | 270,753 | 1.88 | 8.59 | 42,950 | 2,325,768 | |
| 2022-09-01 |
|
4 | HBI |
Hanesbrands Inc.
Common Stock |
A - Award | 5,000 | 265,753 | 1.92 | 8.66 | 43,300 | 2,301,421 | |
| 2022-09-01 |
|
4 | HBI |
Hanesbrands Inc.
Common Stock |
A - Award | 5,000 | 260,753 | 1.96 | 8.79 | 43,950 | 2,292,019 | |
| 2022-09-01 |
|
4 | HBI |
Hanesbrands Inc.
Common Stock |
A - Award | 10,000 | 255,753 | 4.07 | 8.84 | 88,400 | 2,260,857 | |
| 2022-08-01 |
|
4 | WH |
WYNDHAM HOTELS & RESORTS, INC.
Common Stock |
A - Award | 491 | 7,112 | 7.42 | ||||
| 2022-07-06 |
|
4 | PARAA,PARA |
Paramount Global
Class B common stock |
A - Award | 27 | 32,342 | 0.08 | ||||
| 2022-05-02 |
|
4 | WH |
WYNDHAM HOTELS & RESORTS, INC.
Common Stock |
A - Award | 370 | 6,621 | 5.92 | ||||
| 2022-04-05 |
|
4 | PARAA,PARA |
Paramount Global
Class B common stock |
A - Award | 37 | 32,227 | 0.11 | ||||
| 2022-03-14 |
|
4 | WH |
WYNDHAM HOTELS & RESORTS, INC.
Common Stock |
A - Award | 1,208 | 3,294 | 57.91 | ||||
| 2022-03-01 |
|
4 | WH |
WYNDHAM HOTELS & RESORTS, INC.
Common Stock |
A - Award | 862 | 6,251 | 16.00 | ||||
| 2022-02-22 |
|
4 | WH |
WYNDHAM HOTELS & RESORTS, INC.
Common Stock |
A - Award | 381 | 5,389 | 7.61 | ||||
| 2022-02-17 |
|
4 | PARAA,PARA |
Paramount Global
Restricted Share Units |
A - Award | 5,558 | 5,558 | |||||
| 2022-02-17 |
|
4 | PARAA,PARA |
Paramount Global
Restricted Share Units |
M - Exercise | -3,430 | 0 | -100.00 | ||||
| 2022-02-17 |
|
4 | PARAA,PARA |
Paramount Global
Class B common stock |
A - Award | 92 | 32,190 | 0.29 | ||||
| 2022-02-17 |
|
4 | PARAA,PARA |
Paramount Global
Class B common stock |
M - Exercise | 3,430 | 32,098 | 11.96 | ||||
| 2022-01-28 |
|
4 | HBI |
Hanesbrands Inc.
Phantom Stock |
A - Award | 9,603 | 194,089 | 5.21 | ||||
| 2022-01-28 |
|
4 | HBI |
Hanesbrands Inc.
Common Stock |
D - Sale to Issuer | -9,603 | 245,753 | -3.76 | ||||
| 2022-01-26 |
|
4 | HBI |
Hanesbrands Inc.
Common Stock |
A - Award | 9,515 | 255,356 | 3.87 | ||||
| 2021-11-02 |
|
4 | WH |
WYNDHAM HOTELS & RESORTS, INC.
Common Stock |
A - Award | 387 | 5,008 | 8.37 | ||||
| 2021-10-05 |
|
4 | VIACA,VIAC |
ViacomCBS Inc.
Class B common stock |
A - Award | 17 | 28,488 | 0.06 | ||||
| 2021-08-03 |
|
4 | WH |
WYNDHAM HOTELS & RESORTS, INC.
Common Stock |
A - Award | 447 | 4,621 | 10.71 | ||||
| 2021-07-06 |
|
4 | VIACA,VIAC |
ViacomCBS Inc.
Class B common stock |
A - Award | 15 | 28,399 | 0.05 | ||||
| 2021-05-04 |
|
4 | WH |
WYNDHAM HOTELS & RESORTS, INC.
Common Stock |
A - Award | 441 | 4,174 | 11.81 | ||||
| 2021-04-05 |
|
4 | VIACA,VIAC |
ViacomCBS Inc.
Class B common stock |
A - Award | 30 | 28,311 | 0.11 | ||||
| 2021-03-02 |
|
4 | WH |
WYNDHAM HOTELS & RESORTS, INC.
Common Stock |
A - Award | 472 | 3,733 | 14.47 | ||||
| 2021-02-25 |
|
4 | WH |
WYNDHAM HOTELS & RESORTS, INC.
Common Stock |
A - Award | 1,533 | 3,405 | 81.89 | ||||
| 2021-02-17 |
|
4 | WH |
WYNDHAM HOTELS & RESORTS, INC.
Common Stock |
A - Award | 528 | 3,261 | 19.32 | ||||
| 2021-02-17 |
|
4 | VIACA,VIAC |
ViacomCBS Inc.
Restricted Share Units |
A - Award | 3,430 | 3,430 | |||||
| 2021-02-17 |
|
4 | VIACA,VIAC |
ViacomCBS Inc.
Restricted Share Units |
M - Exercise | -5,718 | 0 | -100.00 | ||||
| 2021-02-17 |
|
4 | VIACA,VIAC |
ViacomCBS Inc.
Class B common stock |
A - Award | 95 | 28,281 | 0.34 | ||||
| 2021-02-17 |
|
4 | VIACA,VIAC |
ViacomCBS Inc.
Class B common stock |
M - Exercise | 5,718 | 28,186 | 25.45 | ||||
| 2021-02-01 |
|
4 | HBI |
Hanesbrands Inc.
Phantom Stock |
A - Award | 10,541 | 178,621 | 6.27 | ||||
| 2021-02-01 |
|
4 | HBI |
Hanesbrands Inc.
Common Stock |
D - Sale to Issuer | -10,541 | 239,615 | -4.21 | ||||
| 2021-01-28 |
|
4 | HBI |
Hanesbrands Inc.
Common Stock |
A - Award | 9,603 | 250,156 | 3.99 | ||||
| 2020-11-13 |
|
4 | HBI |
Hanesbrands Inc.
Common Stock |
P - Purchase | 30,000 | 240,553 | 14.25 | 12.71 | 381,390 | 3,058,150 | |
| 2020-11-10 |
|
4 | HBI |
Hanesbrands Inc.
Common Stock |
P - Purchase | 50,000 | 210,553 | 31.14 | 12.73 | 636,600 | 2,680,761 | |
| 2020-11-03 |
|
4 | WH |
WYNDHAM HOTELS & RESORTS, INC.
Common Stock |
A - Award | 682 | 2,733 | 33.25 | ||||
| 2020-10-05 |
|
4 | VIACA,VIAC |
ViacomCBS Inc.
Class B common stock |
A - Award | 24 | 22,353 | 0.11 | ||||
| 2020-07-31 |
|
4 | WH |
WYNDHAM HOTELS & RESORTS, INC.
Common Stock |
A - Award | 691 | 2,051 | 50.81 | ||||
| 2020-07-06 |
|
4 | VIACA,VIAC |
ViacomCBS Inc.
Class B common stock |
A - Award | 28 | 22,135 | 0.13 | ||||
| 2020-05-07 |
|
4 | WH |
WYNDHAM HOTELS & RESORTS, INC.
Common Stock |
A - Award | 825 | 1,360 | 154.21 | ||||
| 2020-04-03 |
|
4 | VIACA,VIAC |
ViacomCBS Inc.
Class B common stock |
A - Award | 99 | 22,102 | 0.45 | ||||
| 2020-03-10 |
|
4 | WH |
WYNDHAM HOTELS & RESORTS, INC.
Common Stock |
P - Purchase | 5,000 | 30,939 | 19.28 | 49.17 | 245,850 | 1,521,273 | |
| 2020-03-05 |
|
4 | WH |
WYNDHAM HOTELS & RESORTS, INC.
Common Stock |
P - Purchase | 5,000 | 25,939 | 23.88 | 49.85 | 249,250 | 1,293,062 | |
| 2020-03-05 |
|
4 | WH |
WYNDHAM HOTELS & RESORTS, INC.
Common Stock |
P - Purchase | 5,000 | 20,939 | 31.37 | 50.00 | 250,000 | 1,046,952 | |
| 2020-02-27 |
|
4 | WH |
WYNDHAM HOTELS & RESORTS, INC.
Common Stock |
P - Purchase | 5,000 | 15,939 | 45.71 | 52.95 | 264,750 | 843,973 | |
| 2020-02-27 |
|
4 | WH |
WYNDHAM HOTELS & RESORTS, INC.
Common Stock |
A - Award | 1,872 | 1,872 | |||||
| 2020-02-19 |
|
4 | HBI |
Hanesbrands Inc.
Common Stock |
A - Award | 10,541 | 160,553 | 7.03 | ||||
| 2020-02-19 |
|
4 | WH |
WYNDHAM HOTELS & RESORTS, INC.
Common Stock |
A - Award | 535 | 535 | |||||
| 2020-02-19 |
|
4 | VIACA,VIAC |
ViacomCBS Inc.
Restricted Share Units |
M - Exercise | -447 | 0 | -100.00 | ||||
| 2020-02-19 |
|
4 | VIACA,VIAC |
ViacomCBS Inc.
Restricted Share Units |
A - Award | 5,718 | 5,718 | |||||
| 2020-02-19 |
|
4 | VIACA,VIAC |
ViacomCBS Inc.
Class B common stock |
A - Award | 4 | 21,935 | 0.02 | ||||
| 2020-02-19 |
|
4 | VIACA,VIAC |
ViacomCBS Inc.
Class B common stock |
M - Exercise | 447 | 21,931 | 2.08 | ||||
| 2020-02-04 |
|
4 | VIACA,VIAC |
ViacomCBS Inc.
Restricted Share Units |
M - Exercise | -3,546 | 0 | -100.00 | ||||
| 2020-02-04 |
|
4 | VIACA,VIAC |
ViacomCBS Inc.
Class B common stock |
A - Award | 129 | 21,484 | 0.60 | ||||
| 2020-02-04 |
|
4 | VIACA,VIAC |
ViacomCBS Inc.
Class B common stock |
M - Exercise | 3,546 | 21,355 | 19.91 | ||||
| 2019-12-13 |
|
4 | HBI |
Hanesbrands Inc.
Phantom Stock |
A - Award | 9,409 | 160,731 | 6.22 | ||||
| 2019-12-13 |
|
4 | HBI |
Hanesbrands Inc.
Common Stock |
D - Sale to Issuer | -9,409 | 150,012 | -5.90 | ||||
| 2019-12-12 |
|
4 | VIACA,VIAC |
ViacomCBS Inc.
Restricted Share Units |
A - Award | 447 | 447 | |||||
| 2019-12-06 |
|
4 | VIA, VIAB |
Viacom Inc.
Restricted Share Units |
D - Sale to Issuer | -5,948 | 0 | -100.00 | ||||
| 2019-12-06 |
|
4 | VIA, VIAB |
Viacom Inc.
Class B Common Stock |
D - Sale to Issuer | -29,835 | 0 | -100.00 | ||||
| 2019-12-06 |
|
4 | VIACA,VIAC |
ViacomCBS Inc.
Restricted Share Units |
A - Award | 3,546 | 3,546 | |||||
| 2019-12-06 |
|
4 | VIACA,VIAC |
ViacomCBS Inc.
Class B Common Stock |
A - Award | 17,789 | 17,789 | |||||
| 2019-11-01 |
|
4 | WH |
WYNDHAM HOTELS & RESORTS, INC.
Common Stock |
A - Award | 883 | 10,939 | 8.78 | 53.61 | 47,338 | 586,442 | |
| 2019-11-01 |
|
4 | WH |
WYNDHAM HOTELS & RESORTS, INC.
Common Stock |
L - Other | 56 | 10,056 | 0.56 | 51.32 | 2,877 | 516,097 | |
| 2019-10-03 |
|
4 | VIA, VIAB |
Viacom Inc.
Class B Common Stock |
A - Award | 37 | 29,835 | 0.12 | ||||
| 2019-08-16 |
|
4 | WH |
WYNDHAM HOTELS & RESORTS, INC.
Common Stock |
P - Purchase | 10,000 | 10,000 | 49.95 | 499,500 | 499,500 | ||
| 2019-08-16 | 3 | WH |
WYNDHAM HOTELS & RESORTS, INC.
Common Stock |
0 | ||||||||
| 2019-07-03 |
|
4 | VIA, VIAB |
Viacom Inc.
Class B Common Stock |
A - Award | 28 | 29,798 | 0.09 | ||||
| 2019-04-03 |
|
4 | VIA, VIAB |
Viacom Inc.
Class B Common Stock |
A - Award | 60 | 29,770 | 0.20 | ||||
| 2019-02-04 |
|
4 | VIA, VIAB |
Viacom Inc.
Restricted Share Units |
M - Exercise | -5,236 | 0 | -100.00 | ||||
| 2019-02-04 |
|
4 | VIA, VIAB |
Viacom Inc.
Restricted Share Units |
A - Award | 5,948 | 5,948 | |||||
| 2019-02-04 |
|
4 | VIA, VIAB |
Viacom Inc.
Class B Common Stock |
A - Award | 142 | 29,710 | 0.48 | ||||
| 2019-02-04 |
|
4 | VIA, VIAB |
Viacom Inc.
Class B Common Stock |
M - Exercise | 5,236 | 29,568 | 21.52 | ||||
| 2018-12-14 |
|
4 | HBI |
Hanesbrands Inc.
Common Stock |
F - Taxes | -1,671 | 159,421 | -1.04 | 14.78 | -24,697 | 2,356,242 | |
| 2018-12-13 |
|
4 | HBI |
Hanesbrands Inc.
Common Stock |
A - Award | 9,409 | 161,092 | 6.20 | ||||
| 2018-11-20 |
|
4 | HBI |
Hanesbrands Inc.
Common Stock |
P - Purchase | 20,000 | 151,683 | 15.19 | 14.83 | 296,600 | 2,249,459 | |
| 2018-11-06 |
|
4 | HBI |
Hanesbrands Inc.
Common Stock |
P - Purchase | 25,000 | 131,683 | 23.43 | 15.95 | 398,750 | 2,100,344 | |
| 2018-10-10 |
|
4 | CVG |
CONVERGYS CORP
Common Shares |
D - Sale to Issuer | -44,658 | 0 | -100.00 | ||||
| 2018-10-10 |
|
4 | CVG |
CONVERGYS CORP
Common Shares |
D - Sale to Issuer | -50,538 | 44,658 | -53.09 | ||||
| 2018-10-03 |
|
4 | VIA, VIAB |
Viacom Inc.
Class B Common Stock |
A - Award | 53 | 24,332 | 0.22 | ||||
| 2018-07-03 |
|
4 | VIA, VIAB |
Viacom Inc.
Class B Common Stock |
A - Award | 28 | 24,279 | 0.12 | ||||
| 2018-05-16 |
|
4 | CVG |
CONVERGYS CORP
Common Shares |
A - Award | 5,052 | 95,196 | 5.60 | ||||
| 2018-03-19 |
|
4 | CAR |
AVIS BUDGET GROUP, INC.
Stock Option (right to buy) |
M - Exercise | -160,000 | 0 | -100.00 | ||||
| 2018-03-19 |
|
4 | CAR |
AVIS BUDGET GROUP, INC.
Common Stock |
M - Exercise | 160,000 | 499,775 | 47.09 | 11.53 | 1,844,800 | 5,762,406 | |
| 2018-03-02 |
|
4 | CAR |
AVIS BUDGET GROUP, INC.
Restricted Stock Units |
M - Exercise | -29,061 | 0 | -100.00 | ||||
| 2018-03-02 |
|
4 | CAR |
AVIS BUDGET GROUP, INC.
Common Stock |
M - Exercise | 29,061 | 339,775 | 9.35 | ||||
| 2018-02-02 |
|
4 | VIA, VIAB |
Viacom Inc.
Restricted Share Units |
M - Exercise | -4,152 | 0 | -100.00 | ||||
| 2018-02-02 |
|
4 | VIA, VIAB |
Viacom Inc.
Restricted Share Units |
A - Award | 5,236 | 5,236 | |||||
| 2018-02-02 |
|
4 | VIA, VIAB |
Viacom Inc.
Class B Common Stock |
A - Award | 99 | 24,251 | 0.41 | ||||
| 2018-02-02 |
|
4 | VIA, VIAB |
Viacom Inc.
Class B Common Stock |
M - Exercise | 4,152 | 24,152 | 20.76 | ||||
| 2017-12-14 |
|
4 | HBI |
Hanesbrands Inc.
Phantom Stock |
A - Award | 5,652 | 140,725 | 4.18 | ||||
| 2017-12-14 |
|
4 | HBI |
Hanesbrands Inc.
Common Stock |
D - Sale to Issuer | -5,652 | 106,683 | -5.03 | ||||
| 2017-12-14 |
|
4 | HBI |
Hanesbrands Inc.
Common Stock |
A - Award | 6,683 | 112,335 | 6.33 | ||||
| 2017-12-11 |
|
4 | CAR |
AVIS BUDGET GROUP, INC.
Common Stock |
S - Sale | -50,000 | 310,714 | -13.86 | 40.77 | -2,038,500 | 12,667,810 | |
| 2017-12-11 |
|
4 | CAR |
AVIS BUDGET GROUP, INC.
Common Stock |
S - Sale | -50,000 | 360,714 | -12.17 | 41.03 | -2,051,500 | 14,800,095 | |
| 2017-12-05 |
|
4 | CAR |
AVIS BUDGET GROUP, INC.
Stock options (right to buy) |
M - Exercise | -212,500 | 0 | -100.00 | ||||
| 2017-12-05 |
|
4 | CAR |
AVIS BUDGET GROUP, INC.
Performance-Vesting Stock Options (right to buy) |
M - Exercise | -212,500 | 0 | -100.00 | ||||
| 2017-12-05 |
|
4 | CAR |
AVIS BUDGET GROUP, INC.
Common Stock |
S - Sale | -15,472 | 0 | -100.00 | 40.97 | -633,888 | ||
| 2017-12-05 |
|
4 | CAR |
AVIS BUDGET GROUP, INC.
Common Stock |
S - Sale | -275,000 | 410,714 | -40.10 | 40.22 | -11,060,500 | 16,518,917 | |
| 2017-12-05 |
|
4 | CAR |
AVIS BUDGET GROUP, INC.
Common Stock |
M - Exercise | 212,500 | 685,714 | 44.91 | 0.79 | 167,875 | 541,714 | |
| 2017-12-05 |
|
4 | CAR |
AVIS BUDGET GROUP, INC.
Common Stock |
M - Exercise | 212,500 | 685,714 | 44.91 | 0.79 | 167,875 | 541,714 | |
| 2017-10-17 |
|
4 | CAR |
AVIS BUDGET GROUP, INC.
Common Stock |
S - Sale | X | -250,000 | 260,714 | -48.95 | 41.02 | -10,255,000 | 10,694,488 |
| 2017-09-14 |
|
4 | CAR |
AVIS BUDGET GROUP, INC.
Common Stock |
S - Sale | -150,000 | 510,714 | -22.70 | 37.30 | -5,595,000 | 19,049,632 | |
| 2017-05-17 |
|
4 | CVG |
CONVERGYS CORP
Common Shares |
A - Award | 5,534 | 90,144 | 6.54 | ||||
| 2017-03-13 |
|
4 | HBI |
Hanesbrands Inc.
Common Stock |
P - Purchase | 5,000 | 5,000 | 19.92 | 99,594 | 99,594 | ||
| 2017-03-03 |
|
4 | CAR |
AVIS BUDGET GROUP, INC.
Restricted Stock Units |
A - Award | 29,061 | 29,061 | |||||
| 2017-03-03 |
|
4 | CAR |
AVIS BUDGET GROUP, INC.
Performance Based Restricted Stock Units |
M - Exercise | -23,184 | 0 | -100.00 | ||||
| 2017-03-03 |
|
4 | CAR |
AVIS BUDGET GROUP, INC.
Common Stock |
F - Taxes | -11,813 | 660,714 | -1.76 | 34.41 | -406,485 | 22,735,169 | |
| 2017-03-03 |
|
4 | CAR |
AVIS BUDGET GROUP, INC.
Common Stock |
M - Exercise | 23,184 | 672,527 | 3.57 | ||||
| 2017-02-02 |
|
4 | VIA, VIAB |
Viacom Inc.
Restricted Share Units |
A - Award | 4,152 | 4,152 | |||||
| 2017-01-31 |
|
4 | CAR |
AVIS BUDGET GROUP, INC.
Restricted Stock Units |
M - Exercise | -38,640 | 0 | -100.00 | ||||
| 2017-01-31 |
|
4 | CAR |
AVIS BUDGET GROUP, INC.
Common Stock |
F - Taxes | -17,435 | 649,343 | -2.61 | 39.25 | -684,324 | 25,486,713 | |
| 2017-01-31 |
|
4 | CAR |
AVIS BUDGET GROUP, INC.
Common Stock |
M - Exercise | 38,640 | 666,778 | 6.15 | ||||
| 2017-01-04 |
|
4 | CAR |
AVIS BUDGET GROUP, INC.
Restricted Stock Units |
M - Exercise | -43,908 | 0 | -100.00 | ||||
| 2017-01-04 |
|
4 | CAR |
AVIS BUDGET GROUP, INC.
Restricted Stock Units |
M - Exercise | -24,522 | 0 | -100.00 | ||||
| 2017-01-04 |
|
4 | CAR |
AVIS BUDGET GROUP, INC.
Common Stock |
F - Taxes | -22,372 | 628,138 | -3.44 | 36.68 | -820,605 | 23,040,102 | |
| 2017-01-04 |
|
4 | CAR |
AVIS BUDGET GROUP, INC.
Common Stock |
M - Exercise | 43,908 | 650,510 | 7.24 | ||||
| 2017-01-04 |
|
4 | CAR |
AVIS BUDGET GROUP, INC.
Common Stock |
F - Taxes | -12,494 | 606,602 | -2.02 | 36.68 | -458,280 | 22,250,161 | |
| 2017-01-04 |
|
4 | CAR |
AVIS BUDGET GROUP, INC.
Common Stock |
M - Exercise | 24,522 | 619,096 | 4.12 | ||||
| 2016-12-15 |
|
4 | HBI |
Hanesbrands Inc.
Common Stock |
A - Award | 5,652 | 105,652 | 5.65 | ||||
| 2016-12-14 |
|
4 | VIA, VIAB |
Viacom Inc.
Class B Common Stock |
P - Purchase | 20,000 | 20,000 | 34.80 | 695,970 | 695,970 | ||
| 2016-12-12 |
|
4 | HBI |
Hanesbrands Inc.
Phantom Stock |
A - Award | 4,200 | 131,383 | 3.30 | ||||
| 2016-12-12 |
|
4 | HBI |
Hanesbrands Inc.
Common Stock |
D - Sale to Issuer | -4,200 | 100,000 | -4.03 | ||||
| 2016-12-01 |
|
4 | CAR |
AVIS BUDGET GROUP, INC.
Common Stock |
S - Sale | -143,400 | 594,574 | -19.43 | 39.00 | -5,592,600 | 23,188,386 | |
| 2016-12-01 |
|
4 | CAR |
AVIS BUDGET GROUP, INC.
Common Stock |
S - Sale | -6,600 | 737,974 | -0.89 | 39.08 | -257,928 | 28,840,024 | |
| 2016-11-17 |
|
4 | CAR |
AVIS BUDGET GROUP, INC.
Common Stock |
S - Sale | X | -37,385 | 744,574 | -4.78 | 40.00 | -1,495,400 | 29,782,960 |
| 2016-11-08 |
|
4 | CAR |
AVIS BUDGET GROUP, INC.
Common Stock |
S - Sale | X | -62,615 | 781,959 | -7.41 | 40.00 | -2,504,600 | 31,278,360 |
| 2016-09-19 |
|
4 | CAR |
AVIS BUDGET GROUP, INC.
Common Stock |
S - Sale | -49,375 | 844,574 | -5.52 | 38.00 | -1,876,250 | 32,093,812 | |
| 2016-09-19 |
|
4 | CAR |
AVIS BUDGET GROUP, INC.
Common Stock |
S - Sale | -625 | 893,949 | -0.07 | 38.00 | -23,750 | 33,970,062 | |
| 2016-05-18 |
|
4 | CVG |
CONVERGYS CORP
Common Shares |
A - Award | 4,533 | 84,610 | 5.66 | ||||
| 2016-02-26 |
|
4 | CAR |
AVIS BUDGET GROUP, INC.
2015 Performance Based Restricted Stock Units |
M - Exercise | -29,181 | 56,645 | -34.00 | ||||
| 2016-02-26 |
|
4 | CAR |
AVIS BUDGET GROUP, INC.
2014 Performance Based Restricted Stock Units |
M - Exercise | -44,975 | 44,974 | -50.00 | ||||
| 2016-02-26 |
|
4 | CAR |
AVIS BUDGET GROUP, INC.
Common Stock |
F - Taxes | -14,868 | 894,574 | -1.63 | 22.04 | -327,691 | 19,716,411 | |
| 2016-02-26 |
|
4 | CAR |
AVIS BUDGET GROUP, INC.
Common Stock |
M - Exercise | 29,181 | 909,442 | 3.32 | ||||
| 2016-02-26 |
|
4 | CAR |
AVIS BUDGET GROUP, INC.
Common Stock |
F - Taxes | -22,915 | 880,261 | -2.54 | 22.04 | -505,047 | 19,400,952 | |
| 2016-02-26 |
|
4 | CAR |
AVIS BUDGET GROUP, INC.
Common Stock |
M - Exercise | 44,975 | 903,176 | 5.24 | ||||
| 2016-02-01 |
|
4 | CAR |
AVIS BUDGET GROUP, INC.
Restricted Stock Units |
A - Award | 38,640 | 38,640 | |||||
| 2016-02-01 |
|
4 | CAR |
AVIS BUDGET GROUP, INC.
Performance Based Restricted Stock Units |
A - Award | 57,960 | 57,960 | |||||
| 2016-02-01 |
|
4 | CAR |
AVIS BUDGET GROUP, INC.
2013 Performance Based Restricted Stock Units |
M - Exercise | -86,675 | 0 | -100.00 | ||||
| 2016-02-01 |
|
4 | CAR |
AVIS BUDGET GROUP, INC.
Common Stock |
F - Taxes | -44,161 | 858,201 | -4.89 | 25.88 | -1,142,887 | 22,210,242 | |
| 2016-02-01 |
|
4 | CAR |
AVIS BUDGET GROUP, INC.
Common Stock |
M - Exercise | 86,675 | 902,362 | 10.63 | ||||
| 2016-01-25 |
|
4 | CAR |
AVIS BUDGET GROUP, INC.
Restricted Stock Units |
M - Exercise | -24,764 | 0 | -100.00 | ||||
| 2016-01-25 |
|
4 | CAR |
AVIS BUDGET GROUP, INC.
Common Stock |
F - Taxes | -9,072 | 815,687 | -1.10 | 26.08 | -236,598 | 21,273,117 | |
| 2016-01-25 |
|
4 | CAR |
AVIS BUDGET GROUP, INC.
Common Stock |
M - Exercise | 24,764 | 824,759 | 3.10 | ||||
| 2016-01-05 |
|
4 | CAR |
AVIS BUDGET GROUP, INC.
Restricted Stock Units |
M - Exercise | -25,700 | 0 | -100.00 | ||||
| 2016-01-05 |
|
4 | CAR |
AVIS BUDGET GROUP, INC.
Common Stock |
F - Taxes | -13,326 | 799,995 | -1.64 | 36.29 | -483,601 | 29,031,819 | |
| 2016-01-05 |
|
4 | CAR |
AVIS BUDGET GROUP, INC.
Common Stock |
M - Exercise | 25,700 | 813,321 | 3.26 | ||||
| 2015-12-14 |
|
4 | CAR |
AVIS BUDGET GROUP, INC.
Common Stock |
S - Sale | -40,000 | 787,621 | -4.83 | 34.79 | -1,391,600 | 27,401,335 | |
| 2015-12-11 |
|
4 | HBI |
Hanesbrands Inc.
Phantom Stock |
A - Award | 4,564 | 125,054 | 3.79 | ||||
| 2015-12-11 |
|
4 | HBI |
Hanesbrands Inc.
Common Stock |
D - Sale to Issuer | -4,564 | 104,200 | -4.20 | ||||
| 2015-12-09 |
|
4 | HBI |
Hanesbrands Inc.
Common Stock |
A - Award | 4,200 | 108,764 | 4.02 | ||||
| 2015-09-17 |
|
4 | CAR |
AVIS BUDGET GROUP, INC.
Restricted Stock Units |
A - Award | 43,908 | 43,908 | |||||
| 2015-05-12 |
|
4 | CVG |
CONVERGYS CORP
Common Shares |
A - Award | 4,681 | 80,077 | 6.21 | ||||
| 2015-01-29 |
|
4 | CAR |
AVIS BUDGET GROUP, INC.
2012 Performance Based Restricted Stock Units |
M - Exercise | -121,127 | 0 | -100.00 | ||||
| 2015-01-29 |
|
4 | CAR |
AVIS BUDGET GROUP, INC.
Common Stock |
F - Taxes | -62,805 | 827,621 | -7.05 | 59.06 | -3,709,263 | 48,879,296 | |
| 2015-01-29 |
|
4 | CAR |
AVIS BUDGET GROUP, INC.
Common Stock |
M - Exercise | 121,127 | 890,426 | 15.75 | ||||
| 2015-01-28 |
|
4 | CAR |
AVIS BUDGET GROUP, INC.
Restricted Stock Units |
M - Exercise | -34,608 | 0 | -100.00 | ||||
| 2015-01-28 |
|
4 | CAR |
AVIS BUDGET GROUP, INC.
Performance Based Restricted Stock Units |
M - Exercise | -150,000 | 0 | -100.00 | ||||
| 2015-01-28 |
|
4 | CAR |
AVIS BUDGET GROUP, INC.
Common Stock |
F - Taxes | -17,945 | 769,299 | -2.28 | 60.65 | -1,088,364 | 46,657,984 | |
| 2015-01-28 |
|
4 | CAR |
AVIS BUDGET GROUP, INC.
Common Stock |
M - Exercise | 34,608 | 787,244 | 4.60 | ||||
| 2015-01-28 |
|
4 | CAR |
AVIS BUDGET GROUP, INC.
Common Stock |
F - Taxes | -77,775 | 752,636 | -9.37 | 60.65 | -4,717,054 | 45,647,373 | |
| 2015-01-28 |
|
4 | CAR |
AVIS BUDGET GROUP, INC.
Common Stock |
M - Exercise | 150,000 | 830,411 | 22.05 | ||||
| 2015-01-28 |
|
4 | CAR |
AVIS BUDGET GROUP, INC.
Restricted Stock Units |
M - Exercise | -46,663 | 0 | -100.00 | ||||
| 2015-01-28 |
|
4 | CAR |
AVIS BUDGET GROUP, INC.
Common Stock |
F - Taxes | -22,711 | 680,411 | -3.23 | 60.91 | -1,383,327 | 41,443,834 | |
| 2015-01-28 |
|
4 | CAR |
AVIS BUDGET GROUP, INC.
Common Stock |
M - Exercise | 46,663 | 703,122 | 7.11 | ||||
| 2015-01-23 |
|
4 | CAR |
AVIS BUDGET GROUP, INC.
2015 Performance Based Restricted Stock Units |
A - Award | 85,826 | 85,826 | |||||
| 2015-01-23 |
|
4 | CAR |
AVIS BUDGET GROUP, INC.
Restricted Stock Units |
A - Award | 24,522 | 24,522 | |||||
| 2014-12-12 |
|
4 | HBI |
Hanesbrands Inc.
Phantom Stock |
A - Award | 1,818 | 29,740 | 6.51 | ||||
| 2014-12-12 |
|
4 | HBI |
Hanesbrands Inc.
Common Stock |
D - Sale to Issuer | -1,818 | 26,141 | -6.50 | ||||
| 2014-12-11 |
|
4 | HBI |
Hanesbrands Inc.
Common Stock |
A - Award | 1,141 | 27,959 | 4.25 | ||||
| 2014-08-08 |
|
4 | CAR |
AVIS BUDGET GROUP, INC.
Common Stock |
S - Sale | -25,000 | 15,472 | -61.77 | 60.89 | -1,522,250 | 942,090 | |
| 2014-05-20 |
|
4 | CVG |
CONVERGYS CORP
Common Shares |
A - Award | 4,962 | 75,396 | 7.04 | ||||
| 2014-04-21 |
|
4 | CAR |
AVIS BUDGET GROUP, INC.
2014 Performance Based Restricted Stock Units |
A - Award | 89,949 | 89,949 | |||||
| 2014-04-21 |
|
4 | CAR |
AVIS BUDGET GROUP, INC.
Restricted Stock Units |
A - Award | 25,700 | 25,700 | |||||
| 2014-01-28 |
|
4 | CAR |
AVIS BUDGET GROUP, INC.
Performance Based Restricted Stock Units |
M - Exercise | -150,000 | 0 | -100.00 | ||||
| 2014-01-28 |
|
4 | CAR |
AVIS BUDGET GROUP, INC.
Common Stock |
F - Taxes | -77,775 | 656,459 | -10.59 | 38.11 | -2,964,005 | 25,017,652 | |
| 2014-01-28 |
|
4 | CAR |
AVIS BUDGET GROUP, INC.
Common Stock |
M - Exercise | 150,000 | 734,234 | 25.67 | ||||
| 2014-01-28 |
|
4 | CAR |
AVIS BUDGET GROUP, INC.
Performance Based Restricted Stock Units |
M - Exercise | -46,663 | 0 | -100.00 | ||||
| 2014-01-28 |
|
4 | CAR |
AVIS BUDGET GROUP, INC.
Common Stock |
F - Taxes | -21,889 | 584,234 | -3.61 | 38.60 | -844,915 | 22,551,432 | |
| 2014-01-28 |
|
4 | CAR |
AVIS BUDGET GROUP, INC.
Common Stock |
M - Exercise | 46,663 | 606,123 | 8.34 | ||||
| 2013-12-12 |
|
4 | HBI |
Hanesbrands Inc.
Common Stock |
A - Award | 1,818 | 26,818 | 7.27 | ||||
| 2013-12-06 |
|
4 | HBI |
Hanesbrands Inc.
Phantom Stock |
A - Award | 3,343 | 27,486 | 13.85 | ||||
| 2013-12-06 |
|
4 | HBI |
Hanesbrands Inc.
Common Stock |
D - Sale to Issuer | -3,343 | 25,000 | -11.79 | ||||
| 2013-05-07 |
|
4 | CVG |
CONVERGYS CORP
Common Shares |
A - Award | 6,548 | 70,434 | 10.25 | ||||
| 2013-04-12 |
|
4 | CAR |
AVIS BUDGET GROUP, INC.
Stock-Settled Stock Appreciation Rights |
M - Exercise | -337,079 | 0 | -100.00 | ||||
| 2013-04-12 |
|
4 | CAR |
AVIS BUDGET GROUP, INC.
Common Stock |
F - Taxes | -28,380 | 40,472 | -41.22 | 29.13 | -826,709 | 1,178,949 | |
| 2013-04-12 |
|
4 | CAR |
AVIS BUDGET GROUP, INC.
Common Stock |
D - Sale to Issuer | -282,346 | 68,852 | -80.40 | 29.13 | -8,224,739 | 2,005,659 | |
| 2013-04-12 |
|
4 | CAR |
AVIS BUDGET GROUP, INC.
Common Stock |
M - Exercise | 337,079 | 351,198 | 2,387.41 | 24.40 | 8,224,728 | 8,569,231 | |
| 2013-03-07 |
|
4 | CAR |
AVIS BUDGET GROUP, INC.
Stock options (right to buy) |
M - Exercise | -26,062 | 0 | -100.00 | ||||
| 2013-03-07 |
|
4 | CAR |
AVIS BUDGET GROUP, INC.
Stock options (right to buy) |
M - Exercise | -78,187 | 0 | -100.00 | ||||
| 2013-03-07 |
|
4 | CAR |
AVIS BUDGET GROUP, INC.
Common Stock |
S - Sale | -90,130 | 14,119 | -86.46 | 24.53 | -2,210,889 | 346,339 | |
| 2013-03-07 |
|
4 | CAR |
AVIS BUDGET GROUP, INC.
Common Stock |
M - Exercise | 26,062 | 104,249 | 33.33 | 18.82 | 490,390 | 1,961,580 | |
| 2013-03-07 |
|
4 | CAR |
AVIS BUDGET GROUP, INC.
Common Stock |
M - Exercise | 78,187 | 78,187 | 18.82 | 1,471,190 | 1,471,190 | ||
| 2013-01-29 |
|
4 | CAR |
AVIS BUDGET GROUP, INC.
Performance Based Restricted Stock Units |
M - Exercise | -150,000 | 0 | -100.00 | ||||
| 2013-01-29 |
|
4 | CAR |
AVIS BUDGET GROUP, INC.
Common Stock |
F - Taxes | -73,917 | 559,460 | -11.67 | 21.99 | -1,625,435 | 12,302,525 | |
| 2013-01-29 |
|
4 | CAR |
AVIS BUDGET GROUP, INC.
Common Stock |
M - Exercise | 150,000 | 633,377 | 31.03 | ||||
| 2013-01-25 |
|
4 | CAR |
AVIS BUDGET GROUP, INC.
2013 Performance Based Restricted Stock Units |
A - Award | 86,675 | 86,675 | |||||
| 2013-01-25 |
|
4 | CAR |
AVIS BUDGET GROUP, INC.
Restricted Stock Units |
A - Award | 24,764 | 24,764 | |||||
| 2012-12-10 |
|
4 | HBI |
Hanesbrands Inc.
Phantom Stock |
A - Award | 5,128 | 23,967 | 27.22 | 36.20 | 185,634 | 867,605 | |
| 2012-12-10 |
|
4 | HBI |
Hanesbrands Inc.
Common Stock |
D - Sale to Issuer | -5,128 | 28,343 | -15.32 | ||||
| 2012-12-06 |
|
4 | HBI |
Hanesbrands Inc.
Common Stock |
A - Award | 3,343 | 33,471 | 11.10 | ||||
| 2012-08-07 |
|
4 | CAR |
AVIS BUDGET GROUP, INC.
2012 Performance Based Restricted Stock Units |
A - Award | 121,127 | 0 | -100.00 | ||||
| 2012-08-07 |
|
4 | CAR |
AVIS BUDGET GROUP, INC.
Restricted Stock Units |
A - Award | 34,608 | 0 | -100.00 | ||||
| 2012-05-15 |
|
4 | CVG |
CONVERGYS CORP
Common Shares |
A - Award | 7,559 | 63,886 | 13.42 | ||||
| 2012-03-08 |
|
4 | CAR |
AVIS BUDGET GROUP, INC.
2008 Performance Based Restricted Stock Units |
M - Exercise | -118,017 | 0 | -100.00 | ||||
| 2012-03-08 |
|
4 | CAR |
AVIS BUDGET GROUP, INC.
Common Stock |
F - Taxes | -54,701 | 483,377 | -10.17 | 12.79 | -699,626 | 6,182,392 | |
| 2012-03-08 |
|
4 | CAR |
AVIS BUDGET GROUP, INC.
Common Stock |
M - Exercise | 118,017 | 538,078 | 28.10 | ||||
| 2012-01-30 |
|
4 | CAR |
AVIS BUDGET GROUP, INC.
Performance Based Restricted Stock Units |
M - Exercise | -150,000 | 0 | -100.00 | ||||
| 2012-01-30 |
|
4 | CAR |
AVIS BUDGET GROUP, INC.
Common Stock |
F - Taxes | -69,525 | 420,061 | -14.20 | 14.60 | -1,015,065 | 6,132,891 | |
| 2012-01-30 |
|
4 | CAR |
AVIS BUDGET GROUP, INC.
Common Stock |
M - Exercise | 150,000 | 489,586 | 44.17 | ||||
| 2012-01-30 |
|
4 | CAR |
AVIS BUDGET GROUP, INC.
Restricted Stock Units |
M - Exercise | -31,109 | 0 | -100.00 | ||||
| 2012-01-30 |
|
4 | CAR |
AVIS BUDGET GROUP, INC.
Common Stock |
F - Taxes | -14,420 | 339,586 | -4.07 | 14.19 | -204,620 | 4,818,725 | |
| 2012-01-30 |
|
4 | CAR |
AVIS BUDGET GROUP, INC.
Common Stock |
M - Exercise | 31,109 | 354,006 | 9.63 | ||||
| 2012-01-06 |
|
4/A | HBI |
Hanesbrands Inc.
Phantom Stock |
A - Award | 4,050 | 18,839 | 27.39 | 23.40 | 94,770 | 440,833 | |
| 2012-01-06 |
|
4/A | HBI |
Hanesbrands Inc.
Common Stock |
D - Sale to Issuer | -4,050 | 30,128 | -11.85 | ||||
| 2012-01-06 |
|
4/A | HBI |
Hanesbrands Inc.
Common Stock |
A - Award | 5,128 | 34,178 | 17.65 | ||||
| 2008-08-20 | 3 | CVG |
CONVERGYS CORP
Common Shares |
5,569 | ||||||||
| 2008-07-24 | 3 | HBI |
Hanesbrands Inc.
No securities owned. |
0 | ||||||||
| 2005-01-18 | 3 | PHH |
PHH CORP
Common Stock |
0 |
P
Compra de mercado aberto ou privada de ativo não-derivativo ou derivativo
S
Venda de mercado aberto ou privada de ativo não-derivativo ou derivativo
A
Concessão, premiação, ou outra aquisição de ativos da empresa (como uma opção)
C
Conversão de derivativo
D
Venda ou transferência de ativos de volta para a empresa
F
Pagamento do preço de exercício ou responsabilidade fiscal utilizando parte dos ativos recebidos da empresa
G
Doação de ativos pelo ou para o insider
K
Swaps de capital e transações de hedge similares
M
Exercício ou conversão de ativo derivativo recebido da empresa (como uma opção)
V
Uma transação voluntariamente reportada no Formulário 4
J
Outro (acompanhado de uma nota explicativa descrevendo a transação)