Battalion Oil Corporation
Introdução
Esta página fornece uma análise abrangente do histórico conhecido de negociações internas de Oaktree Capital I, L.P.. Insiders são oficiais, diretores ou investidores significativos em uma empresa. É ilegal para insiders realizarem negociações em suas próprias empresas baseados em informações específicas, não públicas. Isso não significa que seja ilegal para eles realizarem qualquer negociação em suas próprias empresas. No entanto, eles devem reportar todas as negociações à SEC através de um Formulário 4. Apesar dessas restrições, pesquisas acadêmicas sugerem que insiders - em geral - tendem a superar o mercado em suas próprias empresas.
Rentabilidade Média de Negociação
A rentabilidade média de negociação é o retorno médio de todas as compras de mercado abertas feitas pelo insider nos últimos três anos. Para calcular isso, examinamos cada compra de mercado aberto, não planejada, feita pelo insider, excluindo todas as negociações que foram marcadas como parte de um plano de negociação 10b5-1. Em seguida, calculamos o desempenho médio dessas negociações ao longo de 3, 6 e 12 meses, fazendo a média de cada uma dessas durações para gerar uma métrica de desempenho final para cada negociação. Finalmente, fazemos a média de todas as métricas de desempenho para calcular uma métrica de desempenho para o insider. Esta lista inclui apenas insiders que fizeram pelo menos três negociações nos últimos dois anos.
Se a rentabilidade de negociação deste insider é "N/A", então o insider ou não fez quaisquer compras de mercado aberto nos últimos três anos, ou as negociações que eles fizeram são muito recentes para calcular uma métrica de desempenho confiável.
Frequência de Atualização: Diariamente
Empresas com Posições Internas Reportadas
As declarações à SEC indicam que Oaktree Capital I, L.P. reportou posses ou negociações nas seguintes empresas:
Como Interpretar os Gráficos
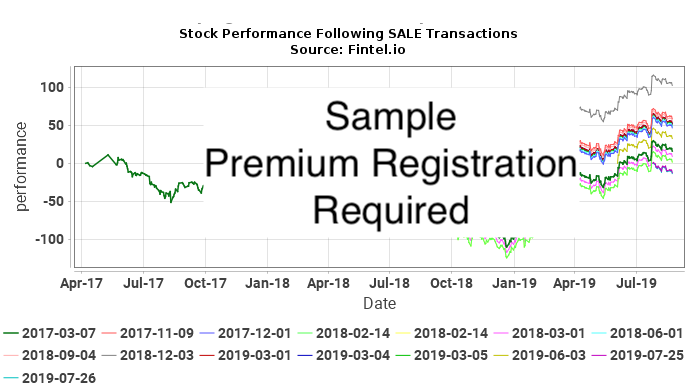
Os gráficos a seguir mostram o desempenho das ações dos a ativos ubsequentes a cada transação de mercado aberto, não planejada feita por Oaktree Capital I, L.P.. Transações não planejadas são negociações que não foram feitas como parte de um plano de negociação 10b5-1. O desempenho das ações é representado como mudança percentual cumulativa no preço das ações. Por exemplo, se uma transação interna foi feita em 1 de janeiro de 2019, o gráfico mostrará a mudança percentual diária da segurança até o dia presente. Se o preço da ação passasse de $10 para $15 durante este período, a mudança percentual cumulativa no preço das ações seria de 50%. Uma mudança no preço de $10 para $20 seria de 100%, e uma mudança no preço de $10 para $5 seria de -50%.
Ultimamente, estamos tentando determinar quão estreitamente as negociações do interno correlacionam-se a retornos excessivos (positivos ou negativos) no preço da ação para ver se o interno está cronometrando suas transações para lucrar com informações internas. Considere a situação onde um interno estava fazendo isso. Nesta situação, esperaríamos (a) retornos positivos após compras, ou (b) retornos negativos após vendas. No caso de (a), o gráfico de COMPRA mostraria uma série de curvas ascendentes, indicando retornos positivos após cada transação de compra. No caso de (b), o gráfico de VENDA mostraria uma série de curvas descendentes, indicando retornos negativos após cada transação de venda.
No entanto, isso sozinho não é suficiente para tirar conclusões. Se, por exemplo, o preço da ação da empresa estivesse em uma escalada não cíclica ao longo de muitos anos, então esperaríamos que todos os gráficos pós-compra tivessem uma inclinação ascendente. Da mesma forma, declínios não cíclicos ao longo de muitos anos resultariam em gráficos pós-negociação inclinados para baixo. Nenhum desses gráficos sugeriria atividade de negociação interna.
O indicador mais forte seria uma situação em que o preço da ação fosse extremamente cíclico, e houvesse sinais positivos no gráfico de COMPRA e gráficos negativos no gráfico de VENDA. Esta situação seria altamente sugestiva de um interno que estava cronometrando transações para sua vantagem financeira.
Compras Internas BATL / Battalion Oil Corporation - Análise de Lucro de Curto Prazo
Nesta seção, analisamos a lucratividade de cada compra interna de mercado aberto, não planejada, feita em BATL / Battalion Oil Corporation. Esta análise ajuda a entender se o interno gera consistentemente retornos anormais, e vale a pena seguir. Esta análise é para um ano seguinte a cada transação, e os resultados são teóricos.
A tabela a seguir mostra as compras de mercado aberto mais recentes que não faziam parte de um plano de negociação automático.
| Data de Negociação | Ticker | Insider | Ações Reportadas |
Preço Reportado |
Ações Ajustadas |
Preço Ajustado |
Base de Custos | Dias para Máx |
Preço em Máx |
Lucro Máx ($) |
Retorno Máx (%) |
|---|---|---|---|---|---|---|---|
| Não há negociações abertas de mercado não planejadas conhecidas para esta combinação de insider e ativo |
O Preço Ajustado é o preço ajustado pela divisão. Ações Ajustadas são as ações ajustadas pela divisão.
Vendas Internas BATL / Battalion Oil Corporation - Análise de Perda de Curto Prazo
Nesta seção, analisamos a evitação de perdas de curto prazo de cada venda interna de mercado aberto, não planejada feita em BATL / Battalion Oil Corporation. Um padrão consistente de evitação de perdas pode sugerir que transações futuras de venda possam prever declínios no preço. Esta análise é para um ano seguinte a cada transação, e os resultados são teóricos.
A tabela a seguir mostra as vendas de mercado aberto mais recentes que não faziam parte de um plano de negociação automático.
| Data de Negociação | Ticker | Insider | Ações Reportadas |
Preço Reportado |
Ações Ajustadas |
Preço Ajustado |
Base de Custos | Dias para Mín |
Preço em Mín |
Máxima Perda Evitada ($) |
Máxima Perda Evitada (%) |
|---|---|---|---|---|---|---|---|
| Não há negociações abertas de mercado não planejadas conhecidas para esta combinação de insider e ativo |
O Preço Ajustado é o preço ajustado pela divisão. Ações Ajustadas são as ações ajustadas pela divisão.
Compras Internas CBL / CBL & Associates Properties, Inc. - Análise de Lucro de Curto Prazo
Nesta seção, analisamos a lucratividade de cada compra interna de mercado aberto, não planejada, feita em BATL / Battalion Oil Corporation. Esta análise ajuda a entender se o interno gera consistentemente retornos anormais, e vale a pena seguir. Esta análise é para um ano seguinte a cada transação, e os resultados são teóricos.
A tabela a seguir mostra as compras de mercado aberto mais recentes que não faziam parte de um plano de negociação automático.
| Data de Negociação | Ticker | Insider | Ações Reportadas |
Preço Reportado |
Ações Ajustadas |
Preço Ajustado |
Base de Custos | Dias para Máx |
Preço em Máx |
Lucro Máx ($) |
Retorno Máx (%) |
|---|---|---|---|---|---|---|---|
| Não há negociações abertas de mercado não planejadas conhecidas para esta combinação de insider e ativo |
O Preço Ajustado é o preço ajustado pela divisão. Ações Ajustadas são as ações ajustadas pela divisão.
Vendas Internas CBL / CBL & Associates Properties, Inc. - Análise de Perda de Curto Prazo
Nesta seção, analisamos a evitação de perdas de curto prazo de cada venda interna de mercado aberto, não planejada feita em BATL / Battalion Oil Corporation. Um padrão consistente de evitação de perdas pode sugerir que transações futuras de venda possam prever declínios no preço. Esta análise é para um ano seguinte a cada transação, e os resultados são teóricos.
A tabela a seguir mostra as vendas de mercado aberto mais recentes que não faziam parte de um plano de negociação automático.
O Preço Ajustado é o preço ajustado pela divisão. Ações Ajustadas são as ações ajustadas pela divisão.
Compras Internas EGLE / Global X Funds - Global X S&P 500 U.S. Revenue Leaders ETF - Análise de Lucro de Curto Prazo
Nesta seção, analisamos a lucratividade de cada compra interna de mercado aberto, não planejada, feita em BATL / Battalion Oil Corporation. Esta análise ajuda a entender se o interno gera consistentemente retornos anormais, e vale a pena seguir. Esta análise é para um ano seguinte a cada transação, e os resultados são teóricos.
A tabela a seguir mostra as compras de mercado aberto mais recentes que não faziam parte de um plano de negociação automático.
| Data de Negociação | Ticker | Insider | Ações Reportadas |
Preço Reportado |
Ações Ajustadas |
Preço Ajustado |
Base de Custos | Dias para Máx |
Preço em Máx |
Lucro Máx ($) |
Retorno Máx (%) |
|---|---|---|---|---|---|---|---|
| Não há negociações abertas de mercado não planejadas conhecidas para esta combinação de insider e ativo |
O Preço Ajustado é o preço ajustado pela divisão. Ações Ajustadas são as ações ajustadas pela divisão.
Vendas Internas EGLE / Global X Funds - Global X S&P 500 U.S. Revenue Leaders ETF - Análise de Perda de Curto Prazo
Nesta seção, analisamos a evitação de perdas de curto prazo de cada venda interna de mercado aberto, não planejada feita em BATL / Battalion Oil Corporation. Um padrão consistente de evitação de perdas pode sugerir que transações futuras de venda possam prever declínios no preço. Esta análise é para um ano seguinte a cada transação, e os resultados são teóricos.
A tabela a seguir mostra as vendas de mercado aberto mais recentes que não faziam parte de um plano de negociação automático.
| Data de Negociação | Ticker | Insider | Ações Reportadas |
Preço Reportado |
Ações Ajustadas |
Preço Ajustado |
Base de Custos | Dias para Mín |
Preço em Mín |
Máxima Perda Evitada ($) |
Máxima Perda Evitada (%) |
|---|---|---|---|---|---|---|---|---|---|---|---|
| 2023-06-22 | EGLE | OCM Opps EB Holdings Ltd. | 3,781,561 | 58.0000 | 3,781,561 | 58.0000 | 219,330,538 | 292 | 0.0000 | -219,330,538 | -100.00 |
O Preço Ajustado é o preço ajustado pela divisão. Ações Ajustadas são as ações ajustadas pela divisão.
Compras Internas EXE / Expand Energy Corporation - Análise de Lucro de Curto Prazo
Nesta seção, analisamos a lucratividade de cada compra interna de mercado aberto, não planejada, feita em BATL / Battalion Oil Corporation. Esta análise ajuda a entender se o interno gera consistentemente retornos anormais, e vale a pena seguir. Esta análise é para um ano seguinte a cada transação, e os resultados são teóricos.
A tabela a seguir mostra as compras de mercado aberto mais recentes que não faziam parte de um plano de negociação automático.
| Data de Negociação | Ticker | Insider | Ações Reportadas |
Preço Reportado |
Ações Ajustadas |
Preço Ajustado |
Base de Custos | Dias para Máx |
Preço em Máx |
Lucro Máx ($) |
Retorno Máx (%) |
|---|---|---|---|---|---|---|---|
| Não há negociações abertas de mercado não planejadas conhecidas para esta combinação de insider e ativo |
O Preço Ajustado é o preço ajustado pela divisão. Ações Ajustadas são as ações ajustadas pela divisão.
Vendas Internas EXE / Expand Energy Corporation - Análise de Perda de Curto Prazo
Nesta seção, analisamos a evitação de perdas de curto prazo de cada venda interna de mercado aberto, não planejada feita em BATL / Battalion Oil Corporation. Um padrão consistente de evitação de perdas pode sugerir que transações futuras de venda possam prever declínios no preço. Esta análise é para um ano seguinte a cada transação, e os resultados são teóricos.
A tabela a seguir mostra as vendas de mercado aberto mais recentes que não faziam parte de um plano de negociação automático.
| Data de Negociação | Ticker | Insider | Ações Reportadas |
Preço Reportado |
Ações Ajustadas |
Preço Ajustado |
Base de Custos | Dias para Mín |
Preço em Mín |
Máxima Perda Evitada ($) |
Máxima Perda Evitada (%) |
|---|---|---|---|---|---|---|---|
| Não há negociações abertas de mercado não planejadas conhecidas para esta combinação de insider e ativo |
O Preço Ajustado é o preço ajustado pela divisão. Ações Ajustadas são as ações ajustadas pela divisão.
Compras Internas FBP / First BanCorp. - Análise de Lucro de Curto Prazo
Nesta seção, analisamos a lucratividade de cada compra interna de mercado aberto, não planejada, feita em BATL / Battalion Oil Corporation. Esta análise ajuda a entender se o interno gera consistentemente retornos anormais, e vale a pena seguir. Esta análise é para um ano seguinte a cada transação, e os resultados são teóricos.
A tabela a seguir mostra as compras de mercado aberto mais recentes que não faziam parte de um plano de negociação automático.
| Data de Negociação | Ticker | Insider | Ações Reportadas |
Preço Reportado |
Ações Ajustadas |
Preço Ajustado |
Base de Custos | Dias para Máx |
Preço em Máx |
Lucro Máx ($) |
Retorno Máx (%) |
|---|---|---|---|---|---|---|---|
| Não há negociações abertas de mercado não planejadas conhecidas para esta combinação de insider e ativo |
O Preço Ajustado é o preço ajustado pela divisão. Ações Ajustadas são as ações ajustadas pela divisão.
Vendas Internas FBP / First BanCorp. - Análise de Perda de Curto Prazo
Nesta seção, analisamos a evitação de perdas de curto prazo de cada venda interna de mercado aberto, não planejada feita em BATL / Battalion Oil Corporation. Um padrão consistente de evitação de perdas pode sugerir que transações futuras de venda possam prever declínios no preço. Esta análise é para um ano seguinte a cada transação, e os resultados são teóricos.
A tabela a seguir mostra as vendas de mercado aberto mais recentes que não faziam parte de um plano de negociação automático.
O Preço Ajustado é o preço ajustado pela divisão. Ações Ajustadas são as ações ajustadas pela divisão.
Compras Internas FLYYQ / Spirit Aviation Holdings, Inc. - Análise de Lucro de Curto Prazo
Nesta seção, analisamos a lucratividade de cada compra interna de mercado aberto, não planejada, feita em BATL / Battalion Oil Corporation. Esta análise ajuda a entender se o interno gera consistentemente retornos anormais, e vale a pena seguir. Esta análise é para um ano seguinte a cada transação, e os resultados são teóricos.
A tabela a seguir mostra as compras de mercado aberto mais recentes que não faziam parte de um plano de negociação automático.
| Data de Negociação | Ticker | Insider | Ações Reportadas |
Preço Reportado |
Ações Ajustadas |
Preço Ajustado |
Base de Custos | Dias para Máx |
Preço em Máx |
Lucro Máx ($) |
Retorno Máx (%) |
|---|---|---|---|---|---|---|---|
| Não há negociações abertas de mercado não planejadas conhecidas para esta combinação de insider e ativo |
O Preço Ajustado é o preço ajustado pela divisão. Ações Ajustadas são as ações ajustadas pela divisão.
Vendas Internas FLYYQ / Spirit Aviation Holdings, Inc. - Análise de Perda de Curto Prazo
Nesta seção, analisamos a evitação de perdas de curto prazo de cada venda interna de mercado aberto, não planejada feita em BATL / Battalion Oil Corporation. Um padrão consistente de evitação de perdas pode sugerir que transações futuras de venda possam prever declínios no preço. Esta análise é para um ano seguinte a cada transação, e os resultados são teóricos.
A tabela a seguir mostra as vendas de mercado aberto mais recentes que não faziam parte de um plano de negociação automático.
O Preço Ajustado é o preço ajustado pela divisão. Ações Ajustadas são as ações ajustadas pela divisão.
Compras Internas ONT / Onterris, Inc. - Análise de Lucro de Curto Prazo
Nesta seção, analisamos a lucratividade de cada compra interna de mercado aberto, não planejada, feita em BATL / Battalion Oil Corporation. Esta análise ajuda a entender se o interno gera consistentemente retornos anormais, e vale a pena seguir. Esta análise é para um ano seguinte a cada transação, e os resultados são teóricos.
A tabela a seguir mostra as compras de mercado aberto mais recentes que não faziam parte de um plano de negociação automático.
| Data de Negociação | Ticker | Insider | Ações Reportadas |
Preço Reportado |
Ações Ajustadas |
Preço Ajustado |
Base de Custos | Dias para Máx |
Preço em Máx |
Lucro Máx ($) |
Retorno Máx (%) |
|---|---|---|---|---|---|---|---|
| Não há negociações abertas de mercado não planejadas conhecidas para esta combinação de insider e ativo |
O Preço Ajustado é o preço ajustado pela divisão. Ações Ajustadas são as ações ajustadas pela divisão.
Vendas Internas ONT / Onterris, Inc. - Análise de Perda de Curto Prazo
Nesta seção, analisamos a evitação de perdas de curto prazo de cada venda interna de mercado aberto, não planejada feita em BATL / Battalion Oil Corporation. Um padrão consistente de evitação de perdas pode sugerir que transações futuras de venda possam prever declínios no preço. Esta análise é para um ano seguinte a cada transação, e os resultados são teóricos.
A tabela a seguir mostra as vendas de mercado aberto mais recentes que não faziam parte de um plano de negociação automático.
| Data de Negociação | Ticker | Insider | Ações Reportadas |
Preço Reportado |
Ações Ajustadas |
Preço Ajustado |
Base de Custos | Dias para Mín |
Preço em Mín |
Máxima Perda Evitada ($) |
Máxima Perda Evitada (%) |
|---|---|---|---|---|---|---|---|---|---|---|---|
| 2020-11-30 | MEG | Partners Ltd | 4,322,644 | 27.8100 | 4,322,644 | 27.8100 | 120,212,730 | 0 | 27.3900 | -1,815,510 | -1.51 |
O Preço Ajustado é o preço ajustado pela divisão. Ações Ajustadas são as ações ajustadas pela divisão.
Compras Internas PULS / PGIM ETF Trust - PGIM Ultra Short Bond ETF - Análise de Lucro de Curto Prazo
Nesta seção, analisamos a lucratividade de cada compra interna de mercado aberto, não planejada, feita em BATL / Battalion Oil Corporation. Esta análise ajuda a entender se o interno gera consistentemente retornos anormais, e vale a pena seguir. Esta análise é para um ano seguinte a cada transação, e os resultados são teóricos.
A tabela a seguir mostra as compras de mercado aberto mais recentes que não faziam parte de um plano de negociação automático.
| Data de Negociação | Ticker | Insider | Ações Reportadas |
Preço Reportado |
Ações Ajustadas |
Preço Ajustado |
Base de Custos | Dias para Máx |
Preço em Máx |
Lucro Máx ($) |
Retorno Máx (%) |
|---|---|---|---|---|---|---|---|
| Não há negociações abertas de mercado não planejadas conhecidas para esta combinação de insider e ativo |
O Preço Ajustado é o preço ajustado pela divisão. Ações Ajustadas são as ações ajustadas pela divisão.
Vendas Internas PULS / PGIM ETF Trust - PGIM Ultra Short Bond ETF - Análise de Perda de Curto Prazo
Nesta seção, analisamos a evitação de perdas de curto prazo de cada venda interna de mercado aberto, não planejada feita em BATL / Battalion Oil Corporation. Um padrão consistente de evitação de perdas pode sugerir que transações futuras de venda possam prever declínios no preço. Esta análise é para um ano seguinte a cada transação, e os resultados são teóricos.
A tabela a seguir mostra as vendas de mercado aberto mais recentes que não faziam parte de um plano de negociação automático.
| Data de Negociação | Ticker | Insider | Ações Reportadas |
Preço Reportado |
Ações Ajustadas |
Preço Ajustado |
Base de Custos | Dias para Mín |
Preço em Mín |
Máxima Perda Evitada ($) |
Máxima Perda Evitada (%) |
|---|---|---|---|---|---|---|---|
| Não há negociações abertas de mercado não planejadas conhecidas para esta combinação de insider e ativo |
O Preço Ajustado é o preço ajustado pela divisão. Ações Ajustadas são as ações ajustadas pela divisão.
Compras Internas RWAYI / Runway Growth Finance Corp. - Análise de Lucro de Curto Prazo
Nesta seção, analisamos a lucratividade de cada compra interna de mercado aberto, não planejada, feita em BATL / Battalion Oil Corporation. Esta análise ajuda a entender se o interno gera consistentemente retornos anormais, e vale a pena seguir. Esta análise é para um ano seguinte a cada transação, e os resultados são teóricos.
A tabela a seguir mostra as compras de mercado aberto mais recentes que não faziam parte de um plano de negociação automático.
O Preço Ajustado é o preço ajustado pela divisão. Ações Ajustadas são as ações ajustadas pela divisão.
Vendas Internas RWAYI / Runway Growth Finance Corp. - Análise de Perda de Curto Prazo
Nesta seção, analisamos a evitação de perdas de curto prazo de cada venda interna de mercado aberto, não planejada feita em BATL / Battalion Oil Corporation. Um padrão consistente de evitação de perdas pode sugerir que transações futuras de venda possam prever declínios no preço. Esta análise é para um ano seguinte a cada transação, e os resultados são teóricos.
A tabela a seguir mostra as vendas de mercado aberto mais recentes que não faziam parte de um plano de negociação automático.
| Data de Negociação | Ticker | Insider | Ações Reportadas |
Preço Reportado |
Ações Ajustadas |
Preço Ajustado |
Base de Custos | Dias para Mín |
Preço em Mín |
Máxima Perda Evitada ($) |
Máxima Perda Evitada (%) |
|---|---|---|---|---|---|---|---|
| Não há negociações abertas de mercado não planejadas conhecidas para esta combinação de insider e ativo |
O Preço Ajustado é o preço ajustado pela divisão. Ações Ajustadas são as ações ajustadas pela divisão.
Compras Internas TMHC / Taylor Morrison Home Corporation - Análise de Lucro de Curto Prazo
Nesta seção, analisamos a lucratividade de cada compra interna de mercado aberto, não planejada, feita em BATL / Battalion Oil Corporation. Esta análise ajuda a entender se o interno gera consistentemente retornos anormais, e vale a pena seguir. Esta análise é para um ano seguinte a cada transação, e os resultados são teóricos.
A tabela a seguir mostra as compras de mercado aberto mais recentes que não faziam parte de um plano de negociação automático.
| Data de Negociação | Ticker | Insider | Ações Reportadas |
Preço Reportado |
Ações Ajustadas |
Preço Ajustado |
Base de Custos | Dias para Máx |
Preço em Máx |
Lucro Máx ($) |
Retorno Máx (%) |
|---|---|---|---|---|---|---|---|
| Não há negociações abertas de mercado não planejadas conhecidas para esta combinação de insider e ativo |
O Preço Ajustado é o preço ajustado pela divisão. Ações Ajustadas são as ações ajustadas pela divisão.
Vendas Internas TMHC / Taylor Morrison Home Corporation - Análise de Perda de Curto Prazo
Nesta seção, analisamos a evitação de perdas de curto prazo de cada venda interna de mercado aberto, não planejada feita em BATL / Battalion Oil Corporation. Um padrão consistente de evitação de perdas pode sugerir que transações futuras de venda possam prever declínios no preço. Esta análise é para um ano seguinte a cada transação, e os resultados são teóricos.
A tabela a seguir mostra as vendas de mercado aberto mais recentes que não faziam parte de um plano de negociação automático.
| Data de Negociação | Ticker | Insider | Ações Reportadas |
Preço Reportado |
Ações Ajustadas |
Preço Ajustado |
Base de Custos | Dias para Mín |
Preço em Mín |
Máxima Perda Evitada ($) |
Máxima Perda Evitada (%) |
|---|---|---|---|---|---|---|---|
| Não há negociações abertas de mercado não planejadas conhecidas para esta combinação de insider e ativo |
O Preço Ajustado é o preço ajustado pela divisão. Ações Ajustadas são as ações ajustadas pela divisão.
Compras Internas TPICQ / TPI Composites, Inc. - Análise de Lucro de Curto Prazo
Nesta seção, analisamos a lucratividade de cada compra interna de mercado aberto, não planejada, feita em BATL / Battalion Oil Corporation. Esta análise ajuda a entender se o interno gera consistentemente retornos anormais, e vale a pena seguir. Esta análise é para um ano seguinte a cada transação, e os resultados são teóricos.
A tabela a seguir mostra as compras de mercado aberto mais recentes que não faziam parte de um plano de negociação automático.
| Data de Negociação | Ticker | Insider | Ações Reportadas |
Preço Reportado |
Ações Ajustadas |
Preço Ajustado |
Base de Custos | Dias para Máx |
Preço em Máx |
Lucro Máx ($) |
Retorno Máx (%) |
|---|---|---|---|---|---|---|---|
| Não há negociações abertas de mercado não planejadas conhecidas para esta combinação de insider e ativo |
O Preço Ajustado é o preço ajustado pela divisão. Ações Ajustadas são as ações ajustadas pela divisão.
Vendas Internas TPICQ / TPI Composites, Inc. - Análise de Perda de Curto Prazo
Nesta seção, analisamos a evitação de perdas de curto prazo de cada venda interna de mercado aberto, não planejada feita em BATL / Battalion Oil Corporation. Um padrão consistente de evitação de perdas pode sugerir que transações futuras de venda possam prever declínios no preço. Esta análise é para um ano seguinte a cada transação, e os resultados são teóricos.
A tabela a seguir mostra as vendas de mercado aberto mais recentes que não faziam parte de um plano de negociação automático.
O Preço Ajustado é o preço ajustado pela divisão. Ações Ajustadas são as ações ajustadas pela divisão.
Histórico de Negociações Insider
Esta tabela mostra a lista completa de negociações insider realizadas por Oaktree Capital I, L.P. conforme divulgadas para a Comissão de Valores Mobiliários (SEC).
| Data do Arquivo | Data da Transação | Formulário | Ticker | Ativo | Código | Ações | Ações Restantes | Variação Percentual |
Preço da Ação |
Valor da Transação |
Valor Restante |
|
|---|---|---|---|---|---|---|---|---|---|---|---|---|
| 2023-06-23 |
|
4 | STR |
Sitio Royalties Corp.
Class C Common Stock |
J - Other | 2,508,490 | 15,443,610 | 19.39 | ||||
| 2023-06-23 |
|
4 | EGLE |
Eagle Bulk Shipping Inc.
Common Stock, par value $0.01 per share ("Common Stock") |
S - Sale | -3,781,561 | 0 | -100.00 | 58.00 | -219,330,538 | ||
| 2023-06-14 |
|
4 | GTX,GTXAP |
Garrett Motion Inc.
Common Stock |
A - Award | 1,016,669 | 1,119,397 | 989.67 | ||||
| 2023-06-14 |
|
4 | GTX,GTXAP |
Garrett Motion Inc.
Common Stock |
A - Award | 28,082,484 | 30,913,997 | 991.78 | ||||
| 2023-06-14 |
|
4 | GTX,GTXAP |
Garrett Motion Inc.
Common Stock |
A - Award | 7,681,964 | 9,174,940 | 514.54 | ||||
| 2023-06-09 |
|
4 | GTX,GTXAP |
Garrett Motion Inc.
Common Stock |
A - Award | 102,728 | 1,023,308 | 11.16 | 8.18 | 840,007 | 8,367,590 | |
| 2023-06-09 |
|
4 | GTX,GTXAP |
Garrett Motion Inc.
Common Stock |
A - Award | 2,831,513 | 28,259,811 | 11.14 | 8.18 | 23,153,282 | 231,080,475 | |
| 2023-06-09 |
|
4 | GTX,GTXAP |
Garrett Motion Inc.
Common Stock |
A - Award | 774,354 | 8,448,888 | 10.09 | 8.18 | 6,331,893 | 69,086,557 | |
| 2023-03-30 |
|
4 | RWAY |
Runway Growth Finance Corp.
Common Stock, par value $0.01 per share |
S - Sale | -50,256 | 21,054,667 | -0.24 | 11.94 | -599,805 | 251,287,451 | |
| 2023-03-30 |
|
4 | RWAY |
Runway Growth Finance Corp.
Common Stock, par value $0.01 per share |
S - Sale | -24,744 | 21,104,923 | -0.12 | 11.96 | -295,988 | 252,457,089 | |
| 2023-01-09 | 3 | STR |
Sitio Royalties Corp.
Class A Common Stock |
10,431 | ||||||||
| 2023-01-09 | 3 | STR |
Sitio Royalties Corp.
Class C Common Stock |
12,935,120 | ||||||||
| 2023-01-03 |
|
4 | STR |
STR Sub Inc.
Class C Common Stock |
J - Other | -12,935,120 | 0 | -100.00 | ||||
| 2023-01-03 |
|
4 | STR |
STR Sub Inc.
Class A Common Stock |
J - Other | -10,431 | 0 | -100.00 | ||||
| 2022-11-10 | 3 | BRY |
Berry Corp (bry)
Common Stock |
7,797,000 | ||||||||
| 2022-11-10 |
|
4 | BRY |
Berry Corp (bry)
Common Stock |
S - Sale | -1,000,000 | 6,797,000 | -12.83 | 9.60 | -9,603,600 | 65,275,669 | |
| 2022-10-17 |
|
4 | BRY |
Berry Corp (bry)
Common Stock |
S - Sale | -2,825,000 | 7,797,000 | -26.60 | 8.50 | -24,012,500 | 66,274,500 | |
| 2022-10-11 |
|
4 | BRY |
Berry Corp (bry)
Common Stock |
S - Sale | -1,000,000 | 10,622,000 | -8.60 | 9.00 | -9,000,000 | 95,598,000 | |
| 2022-09-12 |
|
4 | TPIC |
TPI COMPOSITES, INC
Common Stock |
S - Sale | -69,360 | 12,263 | -84.98 | 18.85 | -1,307,436 | 231,158 | |
| 2022-09-12 |
|
4 | TPIC |
TPI COMPOSITES, INC
Common Stock |
S - Sale | -1,486,281 | 262,777 | -84.98 | 18.85 | -28,016,397 | 4,953,346 | |
| 2022-09-12 |
|
4 | TPIC |
TPI COMPOSITES, INC
Common Stock |
S - Sale | -2,407,775 | 425,699 | -84.98 | 18.85 | -45,386,559 | 8,024,426 | |
| 2022-09-06 |
|
4 | TPIC |
TPI COMPOSITES, INC
Common Stock |
S - Sale | -44 | 81,623 | -0.05 | 18.59 | -818 | 1,517,372 | |
| 2022-09-06 |
|
4 | TPIC |
TPI COMPOSITES, INC
Common Stock |
X - Other | 81,667 | 81,667 | 0.01 | 817 | 817 | ||
| 2022-09-06 |
|
4 | TPIC |
TPI COMPOSITES, INC
Common Stock |
S - Sale | -942 | 1,749,058 | -0.05 | 18.59 | -17,512 | 32,514,988 | |
| 2022-09-06 |
|
4 | TPIC |
TPI COMPOSITES, INC
Common Stock |
X - Other | 1,750,000 | 1,750,000 | 0.01 | 17,500 | 17,500 | ||
| 2022-09-06 |
|
4 | TPIC |
TPI COMPOSITES, INC
Common Stock |
S - Sale | -1,526 | 2,833,474 | -0.05 | 18.59 | -28,368 | 52,674,282 | |
| 2022-09-06 |
|
4 | TPIC |
TPI COMPOSITES, INC
Common Stock |
X - Other | 2,835,000 | 2,835,000 | 0.01 | 28,350 | 28,350 | ||
| 2022-08-23 |
|
4 | STR |
Sitio Royalties Corp.
Class A Common Stock |
A - Award | 10,431 | 10,431 | |||||
| 2022-06-16 | 3 | STR |
Sitio Royalties Corp.
Class C Common Stock |
12,935,120 | ||||||||
| 2022-06-03 |
|
4 | BRY |
Berry Corp (bry)
Common Stock |
S - Sale | -191,591 | 11,622,000 | -1.62 | 11.30 | -2,164,978 | 131,328,600 | |
| 2022-06-03 |
|
4 | BRY |
Berry Corp (bry)
Common Stock |
S - Sale | -435,048 | 11,813,591 | -3.55 | 11.33 | -4,929,094 | 133,847,986 | |
| 2022-05-31 |
|
4 | BRY |
Berry Corp (bry)
Common Stock |
S - Sale | -254,754 | 12,227,043 | -2.04 | 11.32 | -2,883,815 | 138,410,127 | |
| 2022-05-31 |
|
4 | BRY |
Berry Corp (bry)
Common Stock |
S - Sale | -246,005 | 12,481,797 | -1.93 | 11.34 | -2,789,697 | 141,543,578 | |
| 2022-05-31 |
|
4 | BRY |
Berry Corp (bry)
Common Stock |
S - Sale | -163,915 | 12,727,802 | -1.27 | 11.35 | -1,860,435 | 144,460,553 | |
| 2022-04-21 |
|
4 | CBL |
CBL & ASSOCIATES PROPERTIES INC
Common Stock |
S - Sale | -535,735 | 0 | -100.00 | 30.87 | -16,538,139 | ||
| 2022-04-21 |
|
4 | CBL |
CBL & ASSOCIATES PROPERTIES INC
Common Stock |
S - Sale | -50,000 | 535,735 | -8.54 | 32.40 | -1,620,000 | 17,357,814 | |
| 2022-04-14 |
|
4 | CBL |
CBL & ASSOCIATES PROPERTIES INC
Common Stock |
S - Sale | -5,925 | 0 | -100.00 | 32.13 | -190,393 | ||
| 2022-04-06 | 3 | CBL |
CBL & ASSOCIATES PROPERTIES INC
Common Stock, par value $0.001 per share |
342,315 | ||||||||
| 2022-04-06 | 3 | CBL |
CBL & ASSOCIATES PROPERTIES INC
Common Stock, par value $0.001 per share |
1,821,984 | ||||||||
| 2022-04-06 | 3 | CBL |
CBL & ASSOCIATES PROPERTIES INC
Common Stock, par value $0.001 per share |
5,925 | ||||||||
| 2022-04-06 |
|
4 | CBL |
CBL & ASSOCIATES PROPERTIES INC
7.0% Exchangeable Senior Secured Notes due 2028 |
C - Conversion | -243,420 | 0 | -100.00 | 3,324,573.00 | -809,267,559,660 | ||
| 2022-04-06 |
|
4 | CBL |
CBL & ASSOCIATES PROPERTIES INC
7.0% Exchangeable Senior Secured Notes due 2028 |
C - Conversion | -2,161,983 | 0 | -100.00 | 29,527,685.00 | -63,838,352,999,355 | ||
| 2022-04-06 |
|
4 | CBL |
CBL & ASSOCIATES PROPERTIES INC
Common Stock |
C - Conversion | 243,420 | 585,735 | 71.11 | 16.67 | 4,057,811 | 9,764,202 | |
| 2022-04-06 |
|
4 | CBL |
CBL & ASSOCIATES PROPERTIES INC
Common Stock |
C - Conversion | 2,161,983 | 3,983,967 | 118.66 | 16.67 | 36,040,257 | 66,412,730 | |
| 2022-03-29 |
|
4 | CHK |
CHESAPEAKE ENERGY CORP
Common Stock |
D - Sale to Issuer | -1,000,000 | 11,001,153 | -8.33 | 82.98 | -82,980,000 | 912,875,676 | |
| 2022-03-09 |
|
4 | NONE |
Oaktree Strategic Credit Fund
Class I Common Shares of Beneficial Interest |
P - Purchase | 1,600,000 | 4,000,000 | 66.67 | 25.00 | 40,000,000 | 100,000,000 | |
| 2022-03-01 |
|
4 | RWAY |
Runway Growth Finance Corp.
Common Stock, par value $0.01 per share |
P - Purchase | 15,359 | 20,765,158 | 0.07 | 13.35 | 205,112 | 277,308,303 | |
| 2022-02-28 |
|
4 | RWAY |
Runway Growth Finance Corp.
Common Stock, par value $0.01 per share |
P - Purchase | 11,672 | 20,749,799 | 0.06 | 12.73 | 148,621 | 264,209,266 | |
| 2022-02-28 |
|
4 | RWAY |
Runway Growth Finance Corp.
Common Stock, par value $0.01 per share |
P - Purchase | 18,335 | 20,738,127 | 0.09 | 12.94 | 237,279 | 268,378,323 | |
| 2022-02-28 |
|
4 | RWAY |
Runway Growth Finance Corp.
Common Stock, par value $0.01 per share |
P - Purchase | 16,268 | 20,719,792 | 0.08 | 12.96 | 210,824 | 268,516,072 | |
| 2022-02-23 |
|
4 | RWAY |
Runway Growth Finance Corp.
Common Stock, par value $0.01 per share |
P - Purchase | 18,372 | 20,703,524 | 0.09 | 13.22 | 242,865 | 273,686,095 | |
| 2022-02-23 |
|
4 | RWAY |
Runway Growth Finance Corp.
Common Stock, par value $0.01 per share |
P - Purchase | 18,141 | 20,685,152 | 0.09 | 13.39 | 242,928 | 276,996,939 | |
| 2022-02-23 |
|
4 | RWAY |
Runway Growth Finance Corp.
Common Stock, par value $0.01 per share |
P - Purchase | 11,461 | 20,667,011 | 0.06 | 13.61 | 155,960 | 281,234,619 | |
| 2022-02-17 |
|
4 | RWAY |
Runway Growth Finance Corp.
Common Stock, par value $0.01 per share |
P - Purchase | 18,146 | 20,655,550 | 0.09 | 13.58 | 246,339 | 280,407,353 | |
| 2022-02-17 |
|
4 | RWAY |
Runway Growth Finance Corp.
Common Stock, par value $0.01 per share |
P - Purchase | 19,438 | 20,637,404 | 0.09 | 13.37 | 259,834 | 275,866,370 | |
| 2022-02-17 |
|
4 | RWAY |
Runway Growth Finance Corp.
Common Stock, par value $0.01 per share |
P - Purchase | 19,733 | 20,617,966 | 0.10 | 13.62 | 268,842 | 280,899,169 | |
| 2022-02-14 |
|
4 | RWAY |
Runway Growth Finance Corp.
Common Stock, par value $0.01 per share |
P - Purchase | 19,400 | 20,598,233 | 0.09 | 13.55 | 262,930 | 279,169,912 | |
| 2022-02-14 |
|
4 | RWAY |
Runway Growth Finance Corp.
Common Stock, par value $0.01 per share |
P - Purchase | 19,600 | 20,578,833 | 0.10 | 13.26 | 259,990 | 272,974,104 | |
| 2022-02-14 |
|
4 | RWAY |
Runway Growth Finance Corp.
Common Stock, par value $0.01 per share |
P - Purchase | 20,100 | 20,559,233 | 0.10 | 13.07 | 262,711 | 268,713,287 | |
| 2022-02-09 |
|
4 | RWAY |
Runway Growth Finance Corp.
Common Stock, par value $0.01 per share |
P - Purchase | 17,566 | 20,539,133 | 0.09 | 129,977.00 | 2,283,175,982 | 2,669,614,889,941 | |
| 2022-02-09 |
|
4 | RWAY |
Runway Growth Finance Corp.
Common Stock, par value $0.01 per share |
P - Purchase | 20,800 | 20,521,567 | 0.10 | 13.10 | 272,542 | 268,894,092 | |
| 2022-02-09 |
|
4 | RWAY |
Runway Growth Finance Corp.
Common Stock, par value $0.01 per share |
P - Purchase | 20,400 | 20,500,767 | 0.10 | 13.61 | 277,644 | 279,015,439 | |
| 2022-02-09 |
|
4 | RWAY |
Runway Growth Finance Corp.
Common Stock, par value $0.01 per share |
P - Purchase | 14,109 | 20,481,007 | 0.07 | 133,490.00 | 1,883,410,410 | 2,734,009,624,430 | |
| 2022-02-09 |
|
4 | RWAY |
Runway Growth Finance Corp.
Common Stock, par value $0.01 per share |
P - Purchase | 18,231 | 20,460,607 | 0.09 | 13.03 | 237,574 | 266,628,308 | |
| 2022-02-09 |
|
4 | RWAY |
Runway Growth Finance Corp.
Common Stock, par value $0.01 per share |
P - Purchase | 16,973 | 20,446,498 | 0.08 | 12.89 | 218,731 | 263,494,020 | |
| 2022-02-09 |
|
4 | RWAY |
Runway Growth Finance Corp.
Common Stock, par value $0.01 per share |
P - Purchase | 19,521 | 20,428,267 | 0.10 | 12.68 | 247,501 | 259,003,869 | |
| 2022-02-09 |
|
4 | RWAY |
Runway Growth Finance Corp.
Common Stock, par value $0.01 per share |
P - Purchase | 20,365 | 20,391,773 | 0.10 | 13.01 | 264,918 | 265,266,379 | |
| 2022-02-09 |
|
4 | RWAY |
Runway Growth Finance Corp.
Common Stock, par value $0.01 per share |
P - Purchase | 19,400 | 20,371,408 | 0.10 | 12.87 | 249,705 | 262,208,541 | |
| 2022-02-09 |
|
4 | RWAY |
Runway Growth Finance Corp.
Common Stock, par value $0.01 per share |
P - Purchase | 20,000 | 20,352,008 | 0.10 | 12.72 | 254,412 | 258,889,753 | |
| 2022-02-09 |
|
4 | RWAY |
Runway Growth Finance Corp.
Common Stock, par value $0.01 per share |
P - Purchase | 19,488 | 20,332,008 | 0.10 | 12.94 | 252,151 | 263,071,785 | |
| 2022-02-09 |
|
4 | RWAY |
Runway Growth Finance Corp.
Common Stock, par value $0.01 per share |
P - Purchase | 19,840 | 20,312,520 | 0.10 | 13.13 | 260,545 | 266,750,106 | |
| 2022-02-03 | 3 | NONE |
Oaktree Strategic Credit Fund
Class I Common Shares of Beneficial Interest |
2,400,000 | ||||||||
| 2022-01-21 |
|
4 | RWAY |
Runway Growth Finance Corp.
Common Stock, par value $0.01 per share |
P - Purchase | 19,646 | 20,217,680 | 0.10 | 13.24 | 260,038 | 267,605,256 | |
| 2022-01-21 |
|
4 | RWAY |
Runway Growth Finance Corp.
Common Stock, par value $0.01 per share |
P - Purchase | 20,500 | 20,198,034 | 0.10 | 13.26 | 271,840 | 267,836,030 | |
| 2022-01-21 |
|
4 | RWAY |
Runway Growth Finance Corp.
Common Stock, par value $0.01 per share |
P - Purchase | 20,421 | 20,177,534 | 0.10 | 13.21 | 269,782 | 266,565,402 | |
| 2022-01-18 |
|
4 | RWAY |
Runway Growth Finance Corp.
Common Stock, par value $0.01 per share |
P - Purchase | 16,935 | 20,157,113 | 0.08 | 13.30 | 225,210 | 268,059,367 | |
| 2022-01-18 |
|
4 | RWAY |
Runway Growth Finance Corp.
Common Stock, par value $0.01 per share |
P - Purchase | 13,087 | 20,140,178 | 0.07 | 13.23 | 173,124 | 266,428,373 | |
| 2022-01-18 |
|
4 | RWAY |
Runway Growth Finance Corp.
Common Stock, par value $0.01 per share |
P - Purchase | 20,341 | 20,127,091 | 0.10 | 13.18 | 268,005 | 265,186,500 | |
| 2022-01-18 |
|
4/A | RWAY |
Runway Growth Finance Corp.
Common Stock, par value $0.01 per share |
P - Purchase | 20,300 | 20,106,749 | 0.10 | 13.49 | 273,810 | 271,203,852 | |
| 2022-01-12 |
|
4 | RWAY |
Runway Growth Finance Corp.
Common Stock, par value $0.01 per share |
P - Purchase | 20,300 | 20,106,749 | 0.10 | 12.49 | 253,510 | 251,097,103 | |
| 2022-01-12 |
|
4 | RWAY |
Runway Growth Finance Corp.
Common Stock, par value $0.01 per share |
P - Purchase | 21,100 | 20,086,449 | 0.11 | 13.31 | 280,816 | 267,326,532 | |
| 2022-01-12 |
|
4 | RWAY |
Runway Growth Finance Corp.
Common Stock, par value $0.01 per share |
P - Purchase | 22,000 | 20,065,349 | 0.11 | 13.20 | 290,444 | 264,902,737 | |
| 2022-01-07 |
|
4 | RWAY |
Runway Growth Finance Corp.
Common Stock, par value $0.01 per share |
P - Purchase | 19,662 | 20,042,873 | 0.10 | 12.94 | 254,456 | 259,384,841 | |
| 2022-01-07 |
|
4 | RWAY |
Runway Growth Finance Corp.
Common Stock, par value $0.01 per share |
P - Purchase | 21,800 | 20,023,211 | 0.11 | 13.13 | 286,271 | 262,938,800 | |
| 2022-01-07 |
|
4 | RWAY |
Runway Growth Finance Corp.
Common Stock, par value $0.01 per share |
P - Purchase | 22,200 | 20,001,411 | 0.11 | 13.35 | 296,417 | 267,060,840 | |
| 2022-01-05 |
|
4 | RWAY |
Runway Growth Finance Corp.
Common Stock, par value $0.01 per share |
P - Purchase | 19,976 | 19,979,211 | 0.10 | 12.90 | 257,696 | 257,737,816 | |
| 2022-01-04 |
|
4 | RWAY |
Runway Growth Finance Corp.
Common Stock, par value $0.01 per share |
P - Purchase | 17,482 | 19,979,211 | 0.09 | 12.94 | 226,243 | 258,560,959 | |
| 2022-01-04 |
|
4 | RWAY |
Runway Growth Finance Corp.
Common Stock, par value $0.01 per share |
P - Purchase | 21,900 | 19,961,729 | 0.11 | 13.13 | 287,584 | 262,131,437 | |
| 2022-01-04 |
|
4 | RWAY |
Runway Growth Finance Corp.
Common Stock, par value $0.01 per share |
P - Purchase | 20,000 | 19,939,829 | 0.10 | 13.35 | 267,042 | 266,238,591 | |
| 2021-12-29 |
|
4 | RWAY |
Runway Growth Finance Corp.
Common Stock, par value $0.01 per share |
P - Purchase | 19,500 | 19,919,829 | 0.10 | 13.28 | 258,960 | 264,535,329 | |
| 2021-12-29 |
|
4 | RWAY |
Runway Growth Finance Corp.
Common Stock, par value $0.01 per share |
P - Purchase | 20,610 | 19,900,329 | 0.10 | 13.12 | 270,432 | 261,120,177 | |
| 2021-12-29 |
|
4 | RWAY |
Runway Growth Finance Corp.
Common Stock, par value $0.01 per share |
P - Purchase | 20,959 | 19,879,719 | 0.11 | 13.35 | 279,794 | 265,386,297 | |
| 2021-12-23 |
|
4 | RWAY |
Runway Growth Finance Corp.
Common Stock, par value $0.01 per share |
P - Purchase | 20,010 | 19,858,760 | 0.10 | 13.34 | 266,911 | 264,894,014 | |
| 2021-12-23 |
|
4 | RWAY |
Runway Growth Finance Corp.
Common Stock, par value $0.01 per share |
P - Purchase | 21,570 | 19,838,660 | 0.11 | 13.36 | 288,240 | 265,104,014 | |
| 2021-12-23 |
|
4 | RWAY |
Runway Growth Finance Corp.
Common Stock, par value $0.01 per share |
P - Purchase | 21,325 | 19,817,090 | 0.11 | 13.42 | 286,171 | 265,935,439 | |
| 2021-12-20 |
|
4 | RWAY |
Runway Growth Finance Corp.
Common Stock, par value $0.01 per share |
P - Purchase | 21,010 | 19,795,765 | 0.11 | 13.34 | 280,250 | 264,053,730 | |
| 2021-12-20 |
|
4 | RWAY |
Runway Growth Finance Corp.
Common Stock, par value $0.01 per share |
P - Purchase | 19,800 | 19,774,755 | 0.10 | 13.36 | 264,587 | 264,250,051 | |
| 2021-12-20 |
|
4 | RWAY |
Runway Growth Finance Corp.
Common Stock, par value $0.01 per share |
P - Purchase | 18,639 | 19,754,955 | 0.09 | 13.42 | 250,126 | 265,101,619 | |
| 2021-12-15 |
|
4 | RWAY |
Runway Growth Finance Corp.
Common Stock, par value $0.01 per share |
P - Purchase | 22,400 | 19,736,316 | 0.11 | 13.48 | 301,885 | 265,986,331 | |
| 2021-12-15 |
|
4 | RWAY |
Runway Growth Finance Corp.
Common Stock, par value $0.01 per share |
P - Purchase | 17,119 | 19,713,916 | 0.09 | 13.52 | 231,416 | 266,494,688 | |
| 2021-12-15 |
|
4 | RWAY |
Runway Growth Finance Corp.
Common Stock, par value $0.01 per share |
P - Purchase | 19,500 | 19,696,797 | 0.10 | 13.41 | 261,462 | 264,100,563 | |
| 2021-12-10 |
|
4 | RWAY |
Runway Growth Finance Corp.
Common Stock, par value $0.01 per share |
P - Purchase | 19,943 | 19,677,297 | 0.10 | 13.21 | 263,429 | 259,919,384 | |
| 2021-12-10 |
|
4 | RWAY |
Runway Growth Finance Corp.
Common Stock, par value $0.01 per share |
P - Purchase | 21,158 | 19,657,797 | 0.11 | 13.19 | 278,989 | 259,207,711 | |
| 2021-12-10 |
|
4 | RWAY |
Runway Growth Finance Corp.
Common Stock, par value $0.01 per share |
P - Purchase | 23,050 | 19,616,696 | 0.12 | 12.80 | 295,022 | 251,078,015 | |
| 2021-12-10 |
|
4 | RWAY |
Runway Growth Finance Corp.
Common Stock, par value $0.01 per share |
P - Purchase | 29,378 | 19,593,646 | 0.15 | 13.49 | 396,206 | 264,249,707 | |
| 2021-12-10 |
|
4 | RWAY |
Runway Growth Finance Corp.
Common Stock, par value $0.01 per share |
P - Purchase | 8,566 | 19,564,268 | 0.04 | 13.61 | 116,573 | 266,246,210 | |
| 2021-07-09 |
|
4 | STKL |
SunOpta Inc.
Cash-Settled Total Return Swap |
P - Purchase | 1 | 1 | |||||
| 2021-07-09 |
|
4 | STKL |
SunOpta Inc.
Cash-Settled Total Return Swap |
P - Purchase | 1 | 1 | |||||
| 2021-07-06 |
|
4 | STKL |
SunOpta Inc.
Cash-Settled Total Return Swap |
P - Purchase | 1 | 1 | |||||
| 2021-07-06 |
|
4 | STKL |
SunOpta Inc.
Cash-Settled Total Return Swap |
P - Purchase | 1 | 1 | |||||
| 2021-07-06 |
|
4 | STKL |
SunOpta Inc.
Cash-Settled Total Return Swap |
P - Purchase | 1 | 1 | |||||
| 2021-07-06 |
|
4 | STKL |
SunOpta Inc.
Cash-Settled Total Return Swap |
P - Purchase | 1 | 1 | |||||
| 2021-07-06 |
|
4 | STKL |
SunOpta Inc.
Cash-Settled Total Return Swap |
P - Purchase | 1 | 1 | |||||
| 2021-07-06 |
|
4 | STKL |
SunOpta Inc.
Cash-Settled Total Return Swap |
P - Purchase | 1 | 1 | |||||
| 2021-06-30 |
|
4 | STKL |
SunOpta Inc.
Cash-Settled Total Return Swap |
P - Purchase | 1 | 1 | |||||
| 2021-06-30 |
|
4 | STKL |
SunOpta Inc.
Cash-Settled Total Return Swap |
P - Purchase | 1 | 1 | |||||
| 2021-06-30 |
|
4 | STKL |
SunOpta Inc.
Cash-Settled Total Return Swap |
P - Purchase | 1 | 1 | |||||
| 2021-06-30 |
|
4 | STKL |
SunOpta Inc.
Cash-Settled Total Return Swap |
P - Purchase | 1 | 1 | |||||
| 2021-06-30 |
|
4 | STKL |
SunOpta Inc.
Cash-Settled Total Return Swap |
P - Purchase | 1 | 1 | |||||
| 2021-06-30 |
|
4 | STKL |
SunOpta Inc.
Cash-Settled Total Return Swap |
P - Purchase | 1 | 1 | |||||
| 2021-05-28 |
|
4 | STKL |
SunOpta Inc.
Cash-Settled Total Return Swap |
P - Purchase | 1 | 1 | |||||
| 2021-05-28 |
|
4 | STKL |
SunOpta Inc.
Cash-Settled Total Return Swap |
P - Purchase | 1 | 1 | |||||
| 2021-05-19 |
|
4 | STKL |
SunOpta Inc.
Cash-Settled Total Return Swap |
P - Purchase | 1 | 1 | |||||
| 2021-05-19 |
|
4 | STKL |
SunOpta Inc.
Cash-Settled Total Return Swap |
P - Purchase | 1 | 1 | |||||
| 2021-05-19 |
|
4 | STKL |
SunOpta Inc.
Cash-Settled Total Return Swap |
P - Purchase | 1 | 1 | |||||
| 2021-05-19 |
|
4 | STKL |
SunOpta Inc.
Cash-Settled Total Return Swap |
P - Purchase | 1 | 1 | |||||
| 2021-05-19 |
|
4 | STKL |
SunOpta Inc.
Cash-Settled Total Return Swap |
P - Purchase | 1 | 1 | |||||
| 2021-05-19 |
|
4 | STKL |
SunOpta Inc.
Cash-Settled Total Return Swap |
P - Purchase | 1 | 1 | |||||
| 2021-05-14 | 3 | GTX |
Garrett Motion Inc.
Common Stock |
3,593,111 | ||||||||
| 2021-05-04 |
|
4 | GTX |
Garrett Motion Inc.
Common Stock |
J - Other | -3,593,111 | 0 | -100.00 | ||||
| 2021-03-25 |
|
4 | IEA |
Infrastructure & Energy Alternatives, Inc.
Common Stock, par value $0.0001 per share |
J - Other | -1,169,847 | 775,370 | -60.14 | ||||
| 2021-02-22 |
|
4 | STKL |
SunOpta Inc.
Series A Preferred Stock |
C - Conversion | -13,804 | 0 | -100.00 | ||||
| 2021-02-22 |
|
4 | STKL |
SunOpta Inc.
Common Stock |
C - Conversion | 2,051,668 | 3,410,233 | 151.02 | 7.00 | 14,361,676 | 23,871,631 | |
| 2021-02-22 |
|
4 | STKL |
SunOpta Inc.
Special Shares, Series 1 |
J - Other | -1,972,000 | 0 | -100.00 | ||||
| 2021-02-22 |
|
4 | STKL |
SunOpta Inc.
Series A Preferred Stock |
C - Conversion | -71,196 | 0 | -100.00 | ||||
| 2021-02-22 |
|
4 | STKL |
SunOpta Inc.
Common Stock |
C - Conversion | 10,581,759 | 17,315,893 | 157.14 | 7.00 | 74,072,313 | 121,211,251 | |
| 2021-02-22 |
|
4 | STKL |
SunOpta Inc.
Special Shares, Series 1 |
J - Other | -10,170,857 | 0 | -100.00 | ||||
| 2021-02-19 | 3 | CHK |
CHESAPEAKE ENERGY CORP
Common Stock |
7,646,594 | ||||||||
| 2021-02-19 | 3 | CHK |
CHESAPEAKE ENERGY CORP
Common Stock |
3,142,523 | ||||||||
| 2021-02-10 |
|
4 | IEA |
Infrastructure & Energy Alternatives, Inc.
Series B-3 Preferred Stock par value $0.0001 per share |
S - Sale | -19,124 | 0 | -100.00 | 1,071.13 | -20,484,151 | ||
| 2021-02-10 |
|
4 | IEA |
Infrastructure & Energy Alternatives, Inc.
Series B-1 Preferred Stock, par value $0.0001 per share |
S - Sale | -20,000 | 0 | -100.00 | 1,166.94 | -23,338,800 | ||
| 2021-02-10 |
|
4 | IEA |
Infrastructure & Energy Alternatives, Inc.
Series A Preferred Stock, par value $0.0001 per share |
S - Sale | -17,482 | 0 | -100.00 | 1,267.11 | -22,152,251 | ||
| 2021-02-10 |
|
4 | IEA |
Infrastructure & Energy Alternatives, Inc.
Common Stock, par value $0.0001 per share |
S - Sale | -8,853,283 | 1,945,217 | -81.99 | 16.75 | -148,292,490 | 32,582,385 | |
| 2020-12-30 |
|
4 | IEA |
Infrastructure & Energy Alternatives, Inc.
Common Stock, par value $0.0001 per share |
A - Award | 525,000 | 10,838,500 | 5.09 | ||||
| 2020-12-02 |
|
4 | MEG |
Montrose Environmental Group, Inc.
Common Stock |
S - Sale | -4,322,644 | 0 | -100.00 | 27.81 | -120,212,730 | ||
| 2020-10-30 | 3 | GTX |
Garrett Motion Inc.
Common Stock |
3,593,111 | ||||||||
| 2020-10-16 |
|
4 | NONE |
Runway Growth Credit Fund Inc.
Common Stock, par value $0.01 per share |
P - Purchase | 2,129,748 | 17,457,226 | 13.89 | 15.00 | 31,946,216 | 261,858,398 | |
| 2020-10-16 |
|
4 | NONE |
Runway Growth Credit Fund Inc.
Common Stock, par value $0.01 per share |
P - Purchase | 21,045 | 15,327,479 | 0.14 | 13.00 | 273,587 | 199,257,224 | |
| 2020-08-24 |
|
4 | NONE |
Runway Growth Credit Fund Inc.
Common Stock, par value $0.01 per share |
P - Purchase | 81,129 | 14,933,310 | 0.55 | 13.00 | 1,054,674 | 194,133,029 | |
| 2020-08-24 |
|
4 | NONE |
Runway Growth Credit Fund Inc.
Common Stock, par value $0.01 per share |
P - Purchase | 16,663 | 14,852,181 | 0.11 | 13.00 | 216,614 | 193,078,356 | |
| 2020-08-20 |
|
4 | STKL |
SunOpta Inc.
Cash-Settled Total Return Swap |
P - Purchase | 1 | 1 | |||||
| 2020-08-20 |
|
4 | STKL |
SunOpta Inc.
Cash-Settled Total Return Swap |
P - Purchase | 1 | 1 | |||||
| 2020-08-06 | 3 | MEG |
Montrose Environmental Group, Inc.
Common Stock |
4,324,310 | ||||||||
| 2020-08-06 | 3 | MEG |
Montrose Environmental Group, Inc.
Common Stock |
6,643,623 | ||||||||
| 2020-08-06 | 3 | MEG |
Montrose Environmental Group, Inc.
Common Stock |
6,322,643 | ||||||||
| 2020-08-06 | 3 | MEG |
Montrose Environmental Group, Inc.
Common Stock |
4,324,310 | ||||||||
| 2020-08-06 | 3 | MEG |
Montrose Environmental Group, Inc.
Common Stock |
6,643,623 | ||||||||
| 2020-08-06 | 3 | MEG |
Montrose Environmental Group, Inc.
Common Stock |
6,322,643 | ||||||||
| 2020-08-06 | 3 | MEG |
Montrose Environmental Group, Inc.
Common Stock |
4,324,310 | ||||||||
| 2020-08-06 | 3 | MEG |
Montrose Environmental Group, Inc.
Common Stock |
6,643,623 | ||||||||
| 2020-08-06 | 3 | MEG |
Montrose Environmental Group, Inc.
Common Stock |
6,322,643 | ||||||||
| 2020-08-06 | 3 | MEG |
Montrose Environmental Group, Inc.
Common Stock |
4,324,310 | ||||||||
| 2020-08-06 | 3 | MEG |
Montrose Environmental Group, Inc.
Common Stock |
6,643,623 | ||||||||
| 2020-08-06 | 3 | MEG |
Montrose Environmental Group, Inc.
Common Stock |
6,322,643 | ||||||||
| 2020-08-06 | 3 | MEG |
Montrose Environmental Group, Inc.
Common Stock |
4,324,310 | ||||||||
| 2020-08-06 | 3 | MEG |
Montrose Environmental Group, Inc.
Common Stock |
6,643,623 | ||||||||
| 2020-08-06 | 3 | MEG |
Montrose Environmental Group, Inc.
Common Stock |
6,322,643 | ||||||||
| 2020-08-06 | 3 | MEG |
Montrose Environmental Group, Inc.
Common Stock |
4,324,310 | ||||||||
| 2020-08-06 | 3 | MEG |
Montrose Environmental Group, Inc.
Common Stock |
6,643,623 | ||||||||
| 2020-08-06 | 3 | MEG |
Montrose Environmental Group, Inc.
Common Stock |
6,322,643 | ||||||||
| 2020-08-06 | 3 | MEG |
Montrose Environmental Group, Inc.
Common Stock |
4,324,310 | ||||||||
| 2020-08-06 | 3 | MEG |
Montrose Environmental Group, Inc.
Common Stock |
6,643,623 | ||||||||
| 2020-08-06 | 3 | MEG |
Montrose Environmental Group, Inc.
Common Stock |
6,322,643 | ||||||||
| 2020-08-06 | 3 | MEG |
Montrose Environmental Group, Inc.
Common Stock |
4,324,310 | ||||||||
| 2020-08-06 | 3 | MEG |
Montrose Environmental Group, Inc.
Common Stock |
6,643,623 | ||||||||
| 2020-08-06 | 3 | MEG |
Montrose Environmental Group, Inc.
Common Stock |
6,322,643 | ||||||||
| 2020-08-06 | 3 | MEG |
Montrose Environmental Group, Inc.
Common Stock |
4,324,310 | ||||||||
| 2020-08-06 | 3 | MEG |
Montrose Environmental Group, Inc.
Common Stock |
6,643,623 | ||||||||
| 2020-08-06 | 3 | MEG |
Montrose Environmental Group, Inc.
Common Stock |
6,322,643 | ||||||||
| 2020-08-06 | 3 | MEG |
Montrose Environmental Group, Inc.
Common Stock |
4,324,310 | ||||||||
| 2020-08-06 | 3 | MEG |
Montrose Environmental Group, Inc.
Common Stock |
6,643,623 | ||||||||
| 2020-08-06 | 3 | MEG |
Montrose Environmental Group, Inc.
Common Stock |
6,322,643 | ||||||||
| 2020-08-06 | 3 | MEG |
Montrose Environmental Group, Inc.
Common Stock |
4,324,310 | ||||||||
| 2020-08-06 | 3 | MEG |
Montrose Environmental Group, Inc.
Common Stock |
6,643,623 | ||||||||
| 2020-08-06 | 3 | MEG |
Montrose Environmental Group, Inc.
Common Stock |
6,322,643 | ||||||||
| 2020-08-06 | 3 | MEG |
Montrose Environmental Group, Inc.
Common Stock |
4,324,310 | ||||||||
| 2020-08-06 | 3 | MEG |
Montrose Environmental Group, Inc.
Common Stock |
6,643,623 | ||||||||
| 2020-08-06 | 3 | MEG |
Montrose Environmental Group, Inc.
Common Stock |
6,322,643 | ||||||||
| 2020-04-28 |
|
4 | STKL |
SunOpta Inc.
Series B-1 Preferred Stock |
P - Purchase | 12,539 | 12,539 | 1,000.00 | 12,538,520 | 12,538,520 | ||
| 2020-04-28 |
|
4 | STKL |
SunOpta Inc.
Special Shares, Series 2 |
J - Other | 0 | 0 | |||||
| 2020-04-28 |
|
4 | STKL |
SunOpta Inc.
Series B-1 Preferred Stock |
P - Purchase | 2,461 | 2,461 | 1,000.00 | 2,461,480 | 2,461,480 | ||
| 2020-04-28 |
|
4 | STKL |
SunOpta Inc.
Special Shares, Series 2 |
J - Other | 0 | 0 | |||||
| 2020-03-23 |
|
4 | INFN |
INFINERA Corp
Common Stock |
P - Purchase | 1,000,000 | 25,175,384 | 4.14 | 4.94 | 4,940,000 | 124,366,397 | |
| 2020-03-18 |
|
4 | INFN |
INFINERA Corp
Common Stock |
P - Purchase | 1,410,886 | 24,175,384 | 6.20 | 4.31 | 6,080,919 | 104,195,905 | |
| 2020-03-18 |
|
4 | INFN |
INFINERA Corp
Common Stock |
P - Purchase | 589,114 | 22,764,498 | 2.66 | 4.19 | 2,468,388 | 95,383,247 | |
| 2020-03-18 |
|
4 | INFN |
INFINERA Corp
Common Stock |
P - Purchase | 1,200,000 | 22,175,384 | 5.72 | 3.95 | 4,740,000 | 87,592,767 | |
| 2019-12-20 |
|
4 | NONE |
Runway Growth Credit Fund Inc.
Common Stock, par value $0.01 per share |
P - Purchase | 2,157,011 | 13,743,841 | 18.62 | 15.00 | 32,355,172 | 206,157,610 | |
| 2019-11-18 |
|
4 | IEA |
Infrastructure & Energy Alternatives, Inc.
Warrants |
A - Award | 657,383 | 657,383 | |||||
| 2019-11-18 |
|
4 | IEA |
Infrastructure & Energy Alternatives, Inc.
Series B-3 Preferred Stock |
A - Award | 19,124 | 19,124 | |||||
| 2019-11-18 |
|
4 | IEA |
Infrastructure & Energy Alternatives, Inc.
Series A Preferred Stock |
D - Sale to Issuer | -17,482 | 17,482 | -50.00 | ||||
| 2019-10-29 |
|
4 | STON |
STONEMOR PARTNERS LP
Common units representing partnership interests |
S - Sale | -56,715 | 3,950,660 | -1.42 | 1.08 | -61,252 | 4,266,713 | |
| 2019-10-29 |
|
4 | STON |
STONEMOR PARTNERS LP
Common units representing partnership interests |
S - Sale | -470,482 | 4,007,375 | -10.51 | 1.07 | -503,416 | 4,287,891 | |
| 2019-10-22 | 3 | HK |
HALCON RESOURCES CORP
Common Stock |
7,976,176 | ||||||||
| 2019-10-22 | 3 | HK |
HALCON RESOURCES CORP
Common Stock |
7,976,176 | ||||||||
| 2019-10-22 | 3 | HK |
HALCON RESOURCES CORP
Common Stock |
7,976,176 | ||||||||
| 2019-10-22 | 3 | HK |
HALCON RESOURCES CORP
Common Stock |
7,976,176 | ||||||||
| 2019-10-22 | 3 | HK |
HALCON RESOURCES CORP
Common Stock |
7,976,176 | ||||||||
| 2019-10-22 | 3 | HK |
HALCON RESOURCES CORP
Common Stock |
7,976,176 | ||||||||
| 2019-10-22 | 3 | HK |
HALCON RESOURCES CORP
Common Stock |
7,976,176 | ||||||||
| 2019-10-22 | 3 | HK |
HALCON RESOURCES CORP
Common Stock |
7,976,176 | ||||||||
| 2019-10-22 | 3 | HK |
HALCON RESOURCES CORP
Common Stock |
7,976,176 | ||||||||
| 2019-10-03 |
|
4 | NONE |
Runway Growth Credit Fund Inc.
Common Stock, par value $0.01 per share |
P - Purchase | 1,086,494 | 11,586,829 | 10.35 | 15.00 | 16,297,404 | 173,802,436 | |
| 2019-06-24 | 3 | BRY |
Berry Petroleum Corp
Common Stock |
25,783,434 | ||||||||
| 2019-06-24 | 3 | BRY |
Berry Petroleum Corp
Common Stock |
25,783,434 | ||||||||
| 2019-06-24 | 3 | BRY |
Berry Petroleum Corp
Common Stock |
25,783,434 | ||||||||
| 2019-06-24 | 3 | BRY |
Berry Petroleum Corp
Common Stock |
25,783,434 | ||||||||
| 2019-06-24 | 3 | BRY |
Berry Petroleum Corp
Common Stock |
25,783,434 | ||||||||
| 2019-06-24 | 3 | BRY |
Berry Petroleum Corp
Common Stock |
25,783,434 | ||||||||
| 2019-06-24 | 3 | BRY |
Berry Petroleum Corp
Common Stock |
25,783,434 | ||||||||
| 2019-06-24 | 3 | BRY |
Berry Petroleum Corp
Common Stock |
25,783,434 | ||||||||
| 2019-05-22 | 3 | IEA |
Infrastructure & Energy Alternatives, Inc.
Series B Preferred Stock, par value $0.0001 |
40,000 | ||||||||
| 2019-05-22 | 3 | IEA |
Infrastructure & Energy Alternatives, Inc.
Series B Preferred Stock, par value $0.0001 |
40,000 | ||||||||
| 2019-05-22 | 3 | IEA |
Infrastructure & Energy Alternatives, Inc.
Series B Preferred Stock, par value $0.0001 |
40,000 | ||||||||
| 2019-05-22 | 3 | IEA |
Infrastructure & Energy Alternatives, Inc.
Series B Preferred Stock, par value $0.0001 |
40,000 | ||||||||
| 2019-05-22 | 3 | IEA |
Infrastructure & Energy Alternatives, Inc.
Series B Preferred Stock, par value $0.0001 |
40,000 | ||||||||
| 2019-05-22 | 3 | IEA |
Infrastructure & Energy Alternatives, Inc.
Series B Preferred Stock, par value $0.0001 |
40,000 | ||||||||
| 2019-05-22 | 3 | IEA |
Infrastructure & Energy Alternatives, Inc.
Series B Preferred Stock, par value $0.0001 |
40,000 | ||||||||
| 2019-05-22 | 3 | IEA |
Infrastructure & Energy Alternatives, Inc.
Series B Preferred Stock, par value $0.0001 |
40,000 | ||||||||
| 2019-05-22 | 3 | IEA |
Infrastructure & Energy Alternatives, Inc.
Series B Preferred Stock, par value $0.0001 |
40,000 | ||||||||
| 2019-05-22 | 3 | IEA |
Infrastructure & Energy Alternatives, Inc.
Series B Preferred Stock, par value $0.0001 |
40,000 | ||||||||
| 2019-05-22 | 3 | IEA |
Infrastructure & Energy Alternatives, Inc.
Series B Preferred Stock, par value $0.0001 |
40,000 | ||||||||
| 2019-05-22 | 3 | IEA |
Infrastructure & Energy Alternatives, Inc.
Series B Preferred Stock, par value $0.0001 |
40,000 | ||||||||
| 2019-05-22 |
|
4 | IEA |
Infrastructure & Energy Alternatives, Inc.
Warrants |
A - Award | 1,018,374 | 1,018,374 | |||||
| 2019-05-22 |
|
4 | IEA |
Infrastructure & Energy Alternatives, Inc.
Series B Preferred Stock, par value $0.0001 |
A - Award | 20,000 | 20,000 | |||||
| 2019-05-14 |
|
4 | NONE |
Runway Growth Credit Fund Inc.
Common Stock, par value $0.01 per share |
P - Purchase | 1,628,366 | 9,650,423 | 20.30 | 15.16 | 24,686,033 | 146,300,419 | |
| 2019-01-04 |
|
4 | NONE |
Runway Growth Credit Fund Inc.
Common Stock, par value $0.01 per share |
P - Purchase | 2,192,658 | 7,815,569 | 39.00 | 15.19 | 33,306,476 | 118,718,496 | |
| 2018-10-11 | 3 | INFN |
INFINERA Corp
Common Stock, par value $0.001 per share |
41,950,768 | ||||||||
| 2018-10-11 | 3 | INFN |
INFINERA Corp
Common Stock, par value $0.001 per share |
41,950,768 | ||||||||
| 2018-10-11 | 3 | INFN |
INFINERA Corp
Common Stock, par value $0.001 per share |
41,950,768 | ||||||||
| 2018-10-11 | 3 | INFN |
INFINERA Corp
Common Stock, par value $0.001 per share |
41,950,768 | ||||||||
| 2018-10-11 | 3 | INFN |
INFINERA Corp
Common Stock, par value $0.001 per share |
41,950,768 | ||||||||
| 2018-10-11 | 3 | INFN |
INFINERA Corp
Common Stock, par value $0.001 per share |
41,950,768 | ||||||||
| 2018-10-11 | 3 | INFN |
INFINERA Corp
Common Stock, par value $0.001 per share |
41,950,768 | ||||||||
| 2018-10-11 | 3 | INFN |
INFINERA Corp
Common Stock, par value $0.001 per share |
41,950,768 | ||||||||
| 2018-10-11 | 3 | INFN |
INFINERA Corp
Common Stock, par value $0.001 per share |
41,950,768 | ||||||||
| 2018-10-11 | 3 | INFN |
INFINERA Corp
Common Stock, par value $0.001 per share |
41,950,768 | ||||||||
| 2018-09-18 |
|
4 | NONE |
Runway Growth Credit Fund Inc.
Common Stock, par value $0.01 per share |
P - Purchase | 1,006,899 | 5,495,268 | 22.43 | 15.02 | 15,123,619 | 82,538,920 | |
| 2018-08-01 |
|
4 | BRY |
Berry Petroleum Corp
Common Stock |
D - Sale to Issuer | -410,229 | 7,678,671 | -5.07 | 13.16 | -5,398,614 | 101,051,310 | |
| 2018-08-01 |
|
4 | BRY |
Berry Petroleum Corp
Series A Convertible Preferred Stock |
C - Conversion | 5,155,976 | 0 | -100.00 | ||||
| 2018-08-01 |
|
4 | BRY |
Berry Petroleum Corp
Common Stock |
C - Conversion | 5,413,772 | 8,088,900 | 202.37 | ||||
| 2018-07-25 | 3 | BRY |
Berry Petroleum Corp
Common Stock |
16,177,800 | ||||||||
| 2018-07-25 | 3 | BRY |
Berry Petroleum Corp
Common Stock |
16,177,800 | ||||||||
| 2018-07-25 | 3 | BRY |
Berry Petroleum Corp
Common Stock |
16,177,800 | ||||||||
| 2018-07-25 | 3 | BRY |
Berry Petroleum Corp
Common Stock |
16,177,800 | ||||||||
| 2018-07-25 | 3 | BRY |
Berry Petroleum Corp
Common Stock |
16,177,800 | ||||||||
| 2018-07-25 | 3 | BRY |
Berry Petroleum Corp
Common Stock |
16,177,800 | ||||||||
| 2018-07-25 | 3 | BRY |
Berry Petroleum Corp
Common Stock |
16,177,800 | ||||||||
| 2018-07-25 | 3 | BRY |
Berry Petroleum Corp
Common Stock |
16,177,800 | ||||||||
| 2018-06-12 |
|
4 | GNRT |
Euronav MI II Inc.
Common Stock |
D - Sale to Issuer | -11,923,244 | 0 | -100.00 | ||||
| 2018-06-07 |
|
4 | IEA |
Infrastructure & Energy Alternatives, Inc.
Common Stock, par value $0.0001 |
J - Other | -115,000 | 10,327,000 | -1.10 | ||||
| 2018-05-16 |
|
4 | STON |
STONEMOR PARTNERS LP
Common units representing partnership interests |
P - Purchase | 5,634 | 4,477,857 | 0.13 | 6.09 | 34,311 | 27,270,149 | |
| 2018-05-16 |
|
4 | STON |
STONEMOR PARTNERS LP
Common units representing partnership interests |
P - Purchase | 12,956 | 4,472,223 | 0.29 | 6.05 | 78,384 | 27,056,949 | |
| 2018-05-16 |
|
4 | STON |
STONEMOR PARTNERS LP
Common units representing partnership interests |
P - Purchase | 1,866 | 4,459,267 | 0.04 | 6.00 | 11,196 | 26,755,602 | |
| 2018-05-11 |
|
4 | STON |
STONEMOR PARTNERS LP
Common units representing partnership interests |
P - Purchase | 10,000 | 4,457,401 | 0.22 | 6.00 | 60,000 | 26,744,406 | |
| 2018-05-03 |
|
4 | STON |
STONEMOR PARTNERS LP
Common units representing partnership interests |
P - Purchase | 3,831 | 4,447,401 | 0.09 | 6.03 | 23,101 | 26,817,828 | |
| 2018-05-03 |
|
4 | STON |
STONEMOR PARTNERS LP
Common units representing partnership interests |
P - Purchase | 20,428 | 4,443,570 | 0.46 | 6.08 | 124,202 | 27,016,906 | |
| 2018-05-03 |
|
4 | STON |
STONEMOR PARTNERS LP
Common units representing partnership interests |
P - Purchase | 5,600 | 4,423,142 | 0.13 | 5.93 | 33,208 | 26,229,232 | |
| 2018-04-05 |
|
4 | STON |
STONEMOR PARTNERS LP
Common units representing partnership interests |
P - Purchase | 72,908 | 4,417,542 | 1.68 | 6.04 | 440,364 | 26,681,954 | |
| 2018-04-05 | 3 | IEA |
Infrastructure & Energy Alternatives, Inc.
Common Stock |
20,891,965 | ||||||||
| 2018-04-05 | 3 | IEA |
Infrastructure & Energy Alternatives, Inc.
Series A Preferred Stock |
10,498,430 | ||||||||
| 2018-04-05 | 3 | IEA |
Infrastructure & Energy Alternatives, Inc.
Common Stock |
20,891,965 | ||||||||
| 2018-04-05 | 3 | IEA |
Infrastructure & Energy Alternatives, Inc.
Series A Preferred Stock |
10,498,430 | ||||||||
| 2018-04-05 | 3 | IEA |
Infrastructure & Energy Alternatives, Inc.
Common Stock |
20,891,965 | ||||||||
| 2018-04-05 | 3 | IEA |
Infrastructure & Energy Alternatives, Inc.
Series A Preferred Stock |
10,498,430 | ||||||||
| 2018-04-05 | 3 | IEA |
Infrastructure & Energy Alternatives, Inc.
Common Stock |
20,891,965 | ||||||||
| 2018-04-05 | 3 | IEA |
Infrastructure & Energy Alternatives, Inc.
Series A Preferred Stock |
10,498,430 | ||||||||
| 2018-04-05 | 3 | IEA |
Infrastructure & Energy Alternatives, Inc.
Common Stock |
20,891,965 | ||||||||
| 2018-04-05 | 3 | IEA |
Infrastructure & Energy Alternatives, Inc.
Series A Preferred Stock |
10,498,430 | ||||||||
| 2018-04-05 | 3 | IEA |
Infrastructure & Energy Alternatives, Inc.
Common Stock |
20,891,965 | ||||||||
| 2018-04-05 | 3 | IEA |
Infrastructure & Energy Alternatives, Inc.
Series A Preferred Stock |
10,498,430 | ||||||||
| 2018-04-05 | 3 | IEA |
Infrastructure & Energy Alternatives, Inc.
Common Stock |
20,891,965 | ||||||||
| 2018-04-05 | 3 | IEA |
Infrastructure & Energy Alternatives, Inc.
Series A Preferred Stock |
10,498,430 | ||||||||
| 2018-04-05 | 3 | IEA |
Infrastructure & Energy Alternatives, Inc.
Common Stock |
20,891,965 | ||||||||
| 2018-04-05 | 3 | IEA |
Infrastructure & Energy Alternatives, Inc.
Series A Preferred Stock |
10,498,430 | ||||||||
| 2018-04-05 | 3 | IEA |
Infrastructure & Energy Alternatives, Inc.
Common Stock |
20,891,965 | ||||||||
| 2018-04-05 | 3 | IEA |
Infrastructure & Energy Alternatives, Inc.
Series A Preferred Stock |
10,498,430 | ||||||||
| 2018-04-05 | 3 | IEA |
Infrastructure & Energy Alternatives, Inc.
Common Stock |
20,891,965 | ||||||||
| 2018-04-05 | 3 | IEA |
Infrastructure & Energy Alternatives, Inc.
Series A Preferred Stock |
10,498,430 | ||||||||
| 2018-04-05 | 3 | IEA |
Infrastructure & Energy Alternatives, Inc.
Common Stock |
20,891,965 | ||||||||
| 2018-04-05 | 3 | IEA |
Infrastructure & Energy Alternatives, Inc.
Series A Preferred Stock |
10,498,430 | ||||||||
| 2018-04-02 |
|
4 | STON |
STONEMOR PARTNERS LP
Common units representing partnership interests |
P - Purchase | 99,961 | 4,344,634 | 2.35 | 6.15 | 614,760 | 26,719,499 | |
| 2018-03-16 |
|
4/A | STON |
STONEMOR PARTNERS LP
Common units representing partnership interests |
P - Purchase | 35,000 | 4,221,000 | 0.84 | 5.87 | 205,450 | 24,777,270 | |
| 2018-03-06 |
|
4 | STON |
STONEMOR PARTNERS LP
Common units representing partnership interests |
P - Purchase | 12,373 | 4,244,673 | 0.29 | 6.00 | 74,238 | 25,468,038 | |
| 2018-02-16 |
|
4 | STON |
STONEMOR PARTNERS LP
Common units representing partnership interests |
P - Purchase | 11,300 | 4,231,700 | 0.27 | 6.03 | 68,139 | 25,517,151 | |
| 2018-02-16 |
|
4 | STON |
STONEMOR PARTNERS LP
Common units representing partnership interests |
P - Purchase | 34,400 | 4,220,400 | 0.82 | 5.87 | 201,928 | 24,773,748 | |
| 2018-02-16 |
|
4 | STON |
STONEMOR PARTNERS LP
Common units representing partnership interests |
P - Purchase | 76,000 | 4,186,000 | 1.85 | 5.96 | 452,960 | 24,948,560 | |
| 2018-02-13 |
|
4 | STON |
STONEMOR PARTNERS LP
Common units representing partnership interests |
P - Purchase | 40,000 | 4,110,000 | 0.98 | 5.81 | 232,400 | 23,879,100 | |
| 2018-02-13 |
|
4 | STON |
STONEMOR PARTNERS LP
Common units representing partnership interests |
P - Purchase | 60,000 | 4,070,000 | 1.50 | 5.12 | 307,200 | 20,838,400 | |
| 2018-02-07 |
|
4 | STON |
STONEMOR PARTNERS LP
Common units representing partnership interests |
P - Purchase | 20,000 | 4,010,000 | 0.50 | 5.30 | 105,942 | 21,241,371 | |
| 2018-02-07 |
|
4 | STON |
STONEMOR PARTNERS LP
Common units representing partnership interests |
P - Purchase | 84,054 | 3,990,000 | 2.15 | 5.22 | 438,737 | 20,826,603 | |
| 2018-02-07 | 3 | STON |
STONEMOR PARTNERS LP
Common units representing partnership interests |
7,811,892 | ||||||||
| 2018-02-07 | 3 | STON |
STONEMOR PARTNERS LP
Common units representing partnership interests |
7,811,892 | ||||||||
| 2018-02-07 | 3 | STON |
STONEMOR PARTNERS LP
Common units representing partnership interests |
7,811,892 | ||||||||
| 2018-02-07 | 3 | STON |
STONEMOR PARTNERS LP
Common units representing partnership interests |
7,811,892 | ||||||||
| 2018-02-07 | 3 | STON |
STONEMOR PARTNERS LP
Common units representing partnership interests |
7,811,892 | ||||||||
| 2018-02-07 | 3 | STON |
STONEMOR PARTNERS LP
Common units representing partnership interests |
7,811,892 | ||||||||
| 2018-02-07 | 3 | STON |
STONEMOR PARTNERS LP
Common units representing partnership interests |
7,811,892 | ||||||||
| 2018-02-07 | 3 | STON |
STONEMOR PARTNERS LP
Common units representing partnership interests |
7,811,892 | ||||||||
| 2018-02-07 | 3 | STON |
STONEMOR PARTNERS LP
Common units representing partnership interests |
7,811,892 | ||||||||
| 2017-12-18 |
|
4 | STKL |
SunOpta Inc.
Common Stock |
P - Purchase | 3,055,460 | 6,734,134 | 83.06 | 7.50 | 22,915,950 | 50,506,005 | |
| 2017-12-18 |
|
4 | STKL |
SunOpta Inc.
Common Stock |
P - Purchase | 644,540 | 1,358,565 | 90.27 | 7.50 | 4,834,050 | 10,189,238 | |
| 2017-12-12 |
|
4 | NONE |
Runway Growth Credit Fund Inc.
Common Stock |
P - Purchase | 1,413,922 | 4,370,158 | 47.83 | 15.00 | 21,208,823 | 65,552,372 | |
| 2017-09-07 |
|
4 | NONE |
Runway Growth Credit Fund Inc.
Common Stock |
P - Purchase | 1,294,014 | 2,956,237 | 77.85 | 15.00 | 19,410,208 | 44,343,549 | |
| 2017-08-09 |
|
4 | FBP |
FIRST BANCORP /PR/
Common Stock, par value $0.10 per share |
S - Sale | -10,000,000 | 10,051,733 | -49.87 | 5.66 | -56,550,000 | 56,842,550 | |
| 2017-06-14 |
|
4 | NONE |
Runway Growth Credit Fund Inc.
Common Stock |
P - Purchase | 909,443 | 1,662,223 | 120.81 | 15.00 | 13,641,641 | 24,933,341 | |
| 2017-06-08 |
|
4 | APFH |
AdvancePierre Foods Holdings, Inc.
Common Stock, par value $0.01 per share |
U - Other | -31,732,120 | 0 | -100.00 | 40.25 | -1,277,217,830 | ||
| 2017-05-16 |
|
4 | STKL |
SunOpta Inc.
Common Stock |
P - Purchase | 1,168,753 | 3,678,674 | 46.57 | 8.00 | 9,350,024 | 29,429,392 | |
| 2017-05-16 |
|
4 | STKL |
SunOpta Inc.
Common Stock |
P - Purchase | 223,946 | 714,025 | 45.70 | 8.00 | 1,791,568 | 5,712,200 | |
| 2017-04-21 |
|
4 | NONE |
GSV Growth Credit Fund Inc.
Common Stock |
P - Purchase | 554,274 | 752,780 | 279.22 | 15.00 | 8,314,103 | 11,291,700 | |
| 2017-03-07 |
|
4 | STKL |
SunOpta Inc.
Common Stock |
P - Purchase | 945,404 | 2,509,921 | 60.43 | 6.95 | 6,570,558 | 17,443,951 | |
| 2017-03-07 |
|
4 | STKL |
SunOpta Inc.
Common Stock |
P - Purchase | 1,564,517 | 1,564,517 | 6.87 | 10,748,232 | 10,748,232 | ||
| 2017-03-07 |
|
4 | STKL |
SunOpta Inc.
Common Stock |
P - Purchase | 184,596 | 490,079 | 60.43 | 6.95 | 1,282,942 | 3,406,049 | |
| 2017-03-07 |
|
4 | STKL |
SunOpta Inc.
Common Stock |
P - Purchase | 305,483 | 305,483 | 6.87 | 2,098,668 | 2,098,668 | ||
| 2017-03-03 |
|
4 | EXXI |
Energy XXI Gulf Coast, Inc.
Common Stock |
P - Purchase | 423,275 | 3,910,549 | 12.14 | 31.00 | 13,121,525 | 121,227,019 | |
| 2017-03-03 |
|
4 | EXXI |
Energy XXI Gulf Coast, Inc.
Common Stock |
P - Purchase | 200,000 | 3,487,274 | 6.08 | 30.85 | 6,170,000 | 107,582,403 | |
| 2017-03-03 | 3 | EXXI |
Energy XXI Gulf Coast, Inc.
Common Stock |
6,574,548 | ||||||||
| 2017-03-03 | 3 | EXXI |
Energy XXI Gulf Coast, Inc.
Common Stock |
6,574,548 | ||||||||
| 2017-03-03 | 3 | EXXI |
Energy XXI Gulf Coast, Inc.
Common Stock |
6,574,548 | ||||||||
| 2017-03-03 | 3 | EXXI |
Energy XXI Gulf Coast, Inc.
Common Stock |
6,574,548 | ||||||||
| 2017-03-03 | 3 | EXXI |
Energy XXI Gulf Coast, Inc.
Common Stock |
6,574,548 | ||||||||
| 2017-03-03 | 3 | EXXI |
Energy XXI Gulf Coast, Inc.
Common Stock |
6,574,548 | ||||||||
| 2017-03-03 | 3 | EXXI |
Energy XXI Gulf Coast, Inc.
Common Stock |
6,574,548 | ||||||||
| 2017-03-03 | 3 | EXXI |
Energy XXI Gulf Coast, Inc.
Common Stock |
6,574,548 | ||||||||
| 2017-02-09 |
|
4 | FBP |
FIRST BANCORP /PR/
Common Stock, par value $0.10 per share |
S - Sale | -11,500,000 | 20,051,733 | -36.45 | 6.36 | -73,140,000 | 127,529,022 | |
| 2017-01-26 |
|
4 | APFH |
AdvancePierre Foods Holdings, Inc.
Common Stock, par value $0.01 per share |
S - Sale | -11,536,418 | 31,732,120 | -26.66 | 27.00 | -311,483,286 | 856,767,240 | |
| 2016-12-28 | 3 | NONE |
GSV Growth Credit Fund Inc.
Common Stock |
397,013 | ||||||||
| 2016-12-28 | 3 | NONE |
GSV Growth Credit Fund Inc.
Common Stock |
397,013 | ||||||||
| 2016-12-28 | 3 | NONE |
GSV Growth Credit Fund Inc.
Common Stock |
397,013 | ||||||||
| 2016-12-28 | 3 | NONE |
GSV Growth Credit Fund Inc.
Common Stock |
397,013 | ||||||||
| 2016-12-28 | 3 | NONE |
GSV Growth Credit Fund Inc.
Common Stock |
397,013 | ||||||||
| 2016-12-28 | 3 | NONE |
GSV Growth Credit Fund Inc.
Common Stock |
397,013 | ||||||||
| 2016-12-28 | 3 | NONE |
GSV Growth Credit Fund Inc.
Common Stock |
397,013 | ||||||||
| 2016-12-28 | 3 | NONE |
GSV Growth Credit Fund Inc.
Common Stock |
397,013 | ||||||||
| 2016-12-28 | 3 | NONE |
GSV Growth Credit Fund Inc.
Common Stock |
397,013 | ||||||||
| 2016-12-07 |
|
4 | FBP |
FIRST BANCORP /PR/
Common Stock, par value $0.10 per share |
S - Sale | -10,350,000 | 31,551,733 | -24.70 | 5.36 | -55,496,700 | 169,180,392 | |
| 2016-11-22 |
|
4 | XCO |
EXCO RESOURCES INC
Common Stock |
S - Sale | -6,073,877 | 30,778,682 | -16.48 | 1.13 | -6,863,481 | 34,779,911 | |
| 2016-11-22 |
|
4 | XCO |
EXCO RESOURCES INC
Common Stock |
S - Sale | -16,670 | 36,852,559 | -0.05 | 1.13 | -18,837 | 41,643,392 | |
| 2016-11-22 |
|
4 | XCO |
EXCO RESOURCES INC
Common Stock |
S - Sale | -909,453 | 36,869,229 | -2.41 | 1.13 | -1,027,682 | 41,662,229 | |
| 2016-10-17 | 3 | STKL |
SunOpta Inc.
Special Shares, Series 1 |
3,681,066 | ||||||||
| 2016-10-17 | 3 | STKL |
SunOpta Inc.
Special Shares, Series 1 |
3,681,066 | ||||||||
| 2016-10-17 | 3 | STKL |
SunOpta Inc.
Special Shares, Series 1 |
3,681,066 | ||||||||
| 2016-10-17 | 3 | STKL |
SunOpta Inc.
Special Shares, Series 1 |
3,681,066 | ||||||||
| 2016-10-17 | 3 | STKL |
SunOpta Inc.
Special Shares, Series 1 |
3,681,066 | ||||||||
| 2016-10-17 | 3 | STKL |
SunOpta Inc.
Special Shares, Series 1 |
3,681,066 | ||||||||
| 2016-10-17 | 3 | STKL |
SunOpta Inc.
Special Shares, Series 1 |
3,681,066 | ||||||||
| 2016-10-17 | 3 | STKL |
SunOpta Inc.
Special Shares, Series 1 |
3,681,066 | ||||||||
| 2016-10-17 | 3 | STKL |
SunOpta Inc.
Special Shares, Series 1 |
3,681,066 | ||||||||
| 2016-10-17 | 3 | STKL |
SunOpta Inc.
Special Shares, Series 1 |
3,681,066 | ||||||||
| 2016-10-17 | 3 | STKL |
SunOpta Inc.
Special Shares, Series 1 |
18,985,600 | ||||||||
| 2016-10-17 | 3 | STKL |
SunOpta Inc.
Special Shares, Series 1 |
18,985,600 | ||||||||
| 2016-10-17 | 3 | STKL |
SunOpta Inc.
Special Shares, Series 1 |
18,985,600 | ||||||||
| 2016-10-17 | 3 | STKL |
SunOpta Inc.
Special Shares, Series 1 |
18,985,600 | ||||||||
| 2016-10-17 | 3 | STKL |
SunOpta Inc.
Special Shares, Series 1 |
18,985,600 | ||||||||
| 2016-10-17 | 3 | STKL |
SunOpta Inc.
Special Shares, Series 1 |
18,985,600 | ||||||||
| 2016-10-17 | 3 | STKL |
SunOpta Inc.
Special Shares, Series 1 |
18,985,600 | ||||||||
| 2016-10-17 | 3 | STKL |
SunOpta Inc.
Special Shares, Series 1 |
18,985,600 | ||||||||
| 2016-10-17 | 3 | STKL |
SunOpta Inc.
Special Shares, Series 1 |
18,985,600 | ||||||||
| 2016-08-17 |
|
4/A | GNRT |
Gener8 Maritime, Inc.
Common Stock |
P - Purchase | 183,244 | 11,923,244 | 1.56 | 13.44 | 2,462,799 | 160,248,399 | |
| 2016-08-17 |
|
4/A | GNRT |
Gener8 Maritime, Inc.
Common Stock |
P - Purchase | 98,139 | 11,740,000 | 0.84 | 13.05 | 1,280,714 | 153,207,000 | |
| 2016-08-17 |
|
4/A | GNRT |
Gener8 Maritime, Inc.
Common Stock |
P - Purchase | 104,985 | 11,641,861 | 0.91 | 13.12 | 1,377,403 | 152,741,216 | |
| 2016-08-17 |
|
4/A | GNRT |
Gener8 Maritime, Inc.
Common Stock |
J - Other | 52,269 | 11,536,876 | 0.46 | 12.48 | 652,317 | 143,980,212 | |
| 2016-08-17 |
|
4/A | GNRT |
Gener8 Maritime, Inc.
Common Stock |
J - Other | 1,684,047 | 11,484,607 | 17.18 | ||||
| 2016-08-17 |
|
4/A | GNRT |
Gener8 Maritime, Inc.
Class B Common Stock |
J - Other | -1,684,047 | 0 | -100.00 | ||||
| 2016-08-17 |
|
4/A | GNRT |
Gener8 Maritime, Inc.
Common Stock |
J - Other | 9,800,560 | 9,800,560 | |||||
| 2016-08-17 |
|
4/A | GNRT |
Gener8 Maritime, Inc.
Class A Common Stock |
J - Other | -9,800,560 | 0 | -100.00 | ||||
| 2016-08-12 |
|
4 | XCO |
EXCO RESOURCES INC
Common Stock |
S - Sale | -2,082,472 | 37,778,682 | -5.22 | 1.25 | -2,603,090 | 47,223,352 | |
| 2016-08-12 |
|
4 | XCO |
EXCO RESOURCES INC
Common Stock |
S - Sale | -5,716 | 39,861,154 | -0.01 | 1.25 | -7,145 | 49,826,442 | |
| 2016-08-12 |
|
4 | XCO |
EXCO RESOURCES INC
Common Stock |
S - Sale | -311,812 | 39,866,870 | -0.78 | 1.25 | -389,765 | 49,833,588 | |
| 2016-08-12 |
|
4 | XCO |
EXCO RESOURCES INC
Common Stock |
S - Sale | -4,338,483 | 40,178,682 | -9.75 | 1.25 | -5,423,104 | 50,223,352 | |
| 2016-08-12 |
|
4 | XCO |
EXCO RESOURCES INC
Common Stock |
S - Sale | -11,907 | 44,517,165 | -0.03 | 1.25 | -14,884 | 55,646,456 | |
| 2016-08-12 |
|
4 | XCO |
EXCO RESOURCES INC
Common Stock |
S - Sale | -649,610 | 44,529,072 | -1.44 | 1.25 | -812,012 | 55,661,340 | |
| 2016-07-20 |
|
4 | APFH |
AdvancePierre Foods Holdings, Inc.
Common Stock, par value $0.01 per share |
S - Sale | -8,630,190 | 43,268,538 | -16.63 | 21.00 | -181,233,990 | 908,639,298 | |
| 2016-07-14 | 3 | APFH |
AdvancePierre Foods Holdings, Inc.
Common Stock |
103,797,456 | ||||||||
| 2016-07-14 | 3 | APFH |
AdvancePierre Foods Holdings, Inc.
Common Stock |
103,797,456 | ||||||||
| 2016-07-14 | 3 | APFH |
AdvancePierre Foods Holdings, Inc.
Common Stock |
103,797,456 | ||||||||
| 2016-07-14 | 3 | APFH |
AdvancePierre Foods Holdings, Inc.
Common Stock |
103,797,456 | ||||||||
| 2016-07-14 | 3 | APFH |
AdvancePierre Foods Holdings, Inc.
Common Stock |
103,797,456 | ||||||||
| 2016-07-14 | 3 | APFH |
AdvancePierre Foods Holdings, Inc.
Common Stock |
103,797,456 | ||||||||
| 2016-07-14 | 3 | APFH |
AdvancePierre Foods Holdings, Inc.
Common Stock |
103,797,456 | ||||||||
| 2016-07-14 | 3 | APFH |
AdvancePierre Foods Holdings, Inc.
Common Stock |
103,797,456 | ||||||||
| 2016-07-14 | 3 | APFH |
AdvancePierre Foods Holdings, Inc.
Common Stock |
103,797,456 | ||||||||
| 2016-07-14 | 3 | APFH |
AdvancePierre Foods Holdings, Inc.
Common Stock |
103,797,456 | ||||||||
| 2016-07-14 | 3 | APFH |
AdvancePierre Foods Holdings, Inc.
Common Stock |
103,797,456 | ||||||||
| 2015-12-14 |
|
4 | XCO |
EXCO RESOURCES INC
Common Stock |
A - Award | 124,260 | 45,307,942 | 0.28 | ||||
| 2015-10-29 |
|
4 | XCO |
EXCO RESOURCES INC
Common Stock |
A - Award | 5,000 | 45,183,682 | 0.01 | ||||
| 2015-06-29 |
|
4 | GNRT |
Gener8 Maritime, Inc.
Common Stock |
P - Purchase | 183,244 | 11,923,244 | 1.56 | 13.44 | 2,462,799 | 160,248,399 | |
| 2015-06-29 |
|
4 | GNRT |
Gener8 Maritime, Inc.
Common Stock |
P - Purchase | 98,139 | 11,740,000 | 0.84 | 13.05 | 1,280,714 | 153,207,000 | |
| 2015-06-29 |
|
4 | GNRT |
Gener8 Maritime, Inc.
Common Stock |
P - Purchase | 104,985 | 11,641,861 | 0.91 | 13.12 | 1,377,403 | 152,741,216 | |
| 2015-06-24 | 3 | GNRT |
Gener8 Maritime, Inc.
Common Stock |
23,073,752 | ||||||||
| 2015-06-24 | 3 | GNRT |
Gener8 Maritime, Inc.
Common Stock |
23,073,752 | ||||||||
| 2015-06-24 | 3 | GNRT |
Gener8 Maritime, Inc.
Common Stock |
23,073,752 | ||||||||
| 2015-06-24 | 3 | GNRT |
Gener8 Maritime, Inc.
Common Stock |
23,073,752 | ||||||||
| 2015-06-24 | 3 | GNRT |
Gener8 Maritime, Inc.
Common Stock |
23,073,752 | ||||||||
| 2015-06-24 | 3 | GNRT |
Gener8 Maritime, Inc.
Common Stock |
23,073,752 | ||||||||
| 2015-06-24 | 3 | GNRT |
Gener8 Maritime, Inc.
Common Stock |
23,073,752 | ||||||||
| 2015-06-24 | 3 | GNRT |
Gener8 Maritime, Inc.
Common Stock |
23,073,752 | ||||||||
| 2015-06-24 | 3 | GNRT |
Gener8 Maritime, Inc.
Common Stock |
23,073,752 | ||||||||
| 2015-06-24 | 3 | GNRT |
Gener8 Maritime, Inc.
Common Stock |
23,073,752 | ||||||||
| 2015-01-09 |
|
4 | NONE |
NewPage Holdings Inc.
Common Stock |
J - Other | -1,367,192 | 0 | -100.00 | ||||
| 2014-12-11 |
|
4 | DOOR |
MASONITE INTERNATIONAL CORP
Common Stock |
S - Sale | -30,000 | 2,436,585 | -1.22 | 57.69 | -1,730,685 | 140,565,370 | |
| 2014-12-11 |
|
4 | DOOR |
MASONITE INTERNATIONAL CORP
Common Stock |
S - Sale | -3,338 | 2,466,585 | -0.14 | 59.08 | -197,223 | 145,736,201 | |
| 2014-12-11 |
|
4 | DOOR |
MASONITE INTERNATIONAL CORP
Common Stock |
S - Sale | -140,000 | 2,469,923 | -5.36 | 58.27 | -8,157,996 | 143,925,871 | |
| 2014-12-11 |
|
4 | DOOR |
MASONITE INTERNATIONAL CORP
Common Stock |
S - Sale | -36,633 | 2,609,923 | -1.38 | 59.03 | -2,162,450 | 154,064,016 | |
| 2014-12-08 |
|
4 | DOOR |
MASONITE INTERNATIONAL CORP
Common Stock |
S - Sale | -63,200 | 2,646,556 | -2.33 | 59.38 | -3,753,006 | 157,160,435 | |
| 2014-12-08 |
|
4 | DOOR |
MASONITE INTERNATIONAL CORP
Common Stock |
S - Sale | -32,829 | 2,709,756 | -1.20 | 59.30 | -1,946,914 | 160,701,267 | |
| 2014-12-08 |
|
4 | DOOR |
MASONITE INTERNATIONAL CORP
Common Stock |
S - Sale | -24,000 | 2,742,585 | -0.87 | 59.40 | -1,425,528 | 162,901,321 | |
| 2014-12-01 |
|
4 | DOOR |
MASONITE INTERNATIONAL CORP
Common Stock |
S - Sale | -100,000 | 2,766,585 | -3.49 | 59.00 | -5,900,000 | 163,228,515 | |
| 2014-12-01 |
|
4 | DOOR |
MASONITE INTERNATIONAL CORP
Common Stock |
S - Sale | -100,000 | 2,866,585 | -3.37 | 58.45 | -5,845,000 | 167,551,893 | |
| 2014-10-31 |
|
4 | XCO |
EXCO RESOURCES INC
Common Stock |
A - Award | 5,000 | 45,178,682 | 0.01 | ||||
| 2014-09-18 |
|
4 | DOOR |
MASONITE INTERNATIONAL CORP
Common Stock |
S - Sale | -150,000 | 2,966,585 | -4.81 | 57.00 | -8,550,000 | 169,095,345 | |
| 2014-08-29 |
|
4 | DOOR |
MASONITE INTERNATIONAL CORP
Common Stock |
S - Sale | -504,778 | 3,116,585 | -13.94 | 57.53 | -29,039,878 | 179,297,135 | |
| 2014-07-02 |
|
4 | DOOR |
MASONITE INTERNATIONAL CORP
Common Stock |
S - Sale | -515,914 | 3,621,363 | -12.47 | 56.26 | -29,025,322 | 203,737,882 | |
| 2014-07-02 |
|
4 | DOOR |
MASONITE INTERNATIONAL CORP
Warrants to purchase Common Stock |
X - Other | -727,537 | 0 | -100.00 | ||||
| 2014-07-02 |
|
4 | DOOR |
MASONITE INTERNATIONAL CORP
Common Stock |
X - Other | 50,905 | 4,137,277 | 1.25 | ||||
| 2014-06-17 |
|
4 | PULS |
PULSE ELECTRONICS CORP
Common Stock |
A - Award | 21,053 | 21,053 | |||||
| 2014-04-28 |
|
4 | FBP |
FIRST BANCORP /PR/
Common Stock, par value $0.10 per share |
A - Award | 30,120 | 41,884,889 | 0.07 | 4.98 | 149,998 | 208,586,747 | |
| 2014-03-07 |
|
4/A | PULS |
PULSE ELECTRONICS CORP
Common Stock |
C - Conversion | 8,154,927 | 11,999,585 | 212.11 | ||||
| 2014-02-25 |
|
4 | PULS |
PULSE ELECTRONICS CORP
Common Stock |
C - Conversion | 8,154,927 | 11,999,586 | 212.11 | ||||
| 2014-02-20 |
|
4 | DMND |
Diamond Foods Inc
Common Stock Purchase Warrant (right to buy) |
X - Other | -4,420,859 | 0 | -100.00 | ||||
| 2014-02-20 |
|
4 | DMND |
Diamond Foods Inc
Common Stock |
X - Other | 4,420,859 | 4,420,859 | 10.00 | 44,208,590 | 44,208,590 | ||
| 2014-01-13 |
|
4 | XCO |
EXCO RESOURCES INC
Subscription Rights (right to buy) |
M - Exercise | -33,578,946 | 3,200,000 | -91.30 | ||||
| 2014-01-13 |
|
4 | XCO |
EXCO RESOURCES INC
Common Stock |
M - Exercise | 8,394,736 | 45,173,682 | 22.82 | 5.00 | 41,973,680 | 225,868,410 | |
| 2014-01-09 |
|
4 | DOOR |
MASONITE INTERNATIONAL CORP
Common Stock |
S - Sale | -391,465 | 4,086,372 | -8.74 | 59.00 | -23,096,435 | 241,095,948 | |
| 2013-12-19 |
|
4 | DOOR |
MASONITE INTERNATIONAL CORP
Common Stock |
S - Sale | -300,497 | 4,477,837 | -6.29 | 52.20 | -15,685,943 | 233,743,091 | |
| 2013-11-05 |
|
4 | XCO |
EXCO RESOURCES INC
Stock Options |
A - Award | 5,000 | 5,000 | |||||
| 2013-10-31 |
|
4 | CXPO |
CRIMSON EXPLORATION INC.
Common Stock |
D - Sale to Issuer | -15,537,344 | 0 | -100.00 | ||||
| 2013-10-29 |
|
4 | NONE |
NewPage Holdings Inc.
Common Stock |
P - Purchase | 250,000 | 1,367,192 | 22.38 | 91.00 | 22,750,000 | 124,414,472 | |
| 2013-10-24 |
|
4 | NONE |
NewPage Holdings Inc.
Common Stock |
P - Purchase | 66,380 | 1,117,192 | 6.32 | 91.50 | 6,073,770 | 102,223,068 | |
| 2013-09-17 |
|
4 | FBP |
FIRST BANCORP /PR/
Common Stock, par value $0.10 per share |
S - Sale | -840,904 | 41,854,769 | -1.97 | 6.67 | -5,605,130 | 278,987,148 | |
| 2013-09-11 |
|
4 | NONE |
NewPage Holdings Inc.
Common Stock |
P - Purchase | 70,000 | 1,050,812 | 7.14 | 87.56 | 6,129,410 | 92,012,251 | |
| 2013-09-06 | 3 | MASWF |
MASONITE INTERNATIONAL CORP
Common Stock |
4,778,334 | ||||||||
| 2013-09-05 |
|
4 | NONE |
NewPage Holdings Inc.
Common Stock |
P - Purchase | 10,512 | 980,812 | 1.08 | 87.00 | 914,544 | 85,330,644 | |
| 2013-08-26 |
|
4 | FBP |
FIRST BANCORP /PR/
Common Stock, par value $0.10 per share |
A - Award | 3,703 | 42,695,673 | 0.01 | 6.75 | 24,995 | 288,195,793 | |
| 2013-08-22 | 3 | NONE |
NewPage Holdings Inc.
Common Stock |
970,300 | ||||||||
| 2013-08-20 |
|
4 | FBP |
FIRST BANCORP /PR/
Common Stock, par value $0.10 per share |
S - Sale | -8,000,000 | 42,691,970 | -15.78 | 6.67 | -53,324,800 | 284,567,595 | |
| 2013-05-03 |
|
4 | CHTR |
CHARTER COMMUNICATIONS, INC. /MO/
Common Stock Warrants (CUSIP 16117M123) |
S - Sale | -136,202 | 225,882 | -37.62 | 44.22 | -6,022,852 | 9,988,502 | |
| 2013-05-03 |
|
4 | CHTR |
CHARTER COMMUNICATIONS, INC. /MO/
Common Stock Warrants (CUSIP 16117M131) |
S - Sale | -66,460 | 0 | -100.00 | 48.64 | -3,232,614 | ||
| 2013-05-03 |
|
4 | CHTR |
CHARTER COMMUNICATIONS, INC. /MO/
CLASS A COMMON STOCK |
S - Sale | -7,064,036 | 2,000,000 | -77.93 | 95.50 | -674,615,438 | 191,000,000 | |
| 2013-04-15 |
|
4 | TMHC |
Taylor Morrison Home Corp
Put/Call Option (right/obligation to sell) |
X - Other | -11,286,361 | 43,595,623 | -20.56 | ||||
| 2013-04-15 |
|
4 | TMHC |
Taylor Morrison Home Corp
Common Partnership Units and Class B Common Stock |
X - Other | -11,286,361 | 43,595,623 | -20.56 | 20.68 | -233,401,945 | 901,557,484 | |
| 2013-04-15 |
|
4 | TMHC |
Taylor Morrison Home Corp
Put/Call Option (right/obligation to sell) |
S - Sale | -2,142,900 | 11,286,361 | -15.96 | ||||
| 2013-03-13 |
|
4 | CHTR |
CHARTER COMMUNICATIONS, INC. /MO/
CLASS A COMMON STOCK |
S - Sale | -3,083,333 | 9,064,036 | -25.38 | 89.47 | -275,859,637 | 810,941,173 | |
| 2013-03-11 | 3 | DIAL |
DIAL GLOBAL, INC. /DE/
Series A Preferred Stock, par value $0.01 per share |
9,691 | ||||||||
| 2013-03-11 | 3 | DIAL |
DIAL GLOBAL, INC. /DE/
Class A Common Stock, par value $0.01 per share |
71,428 | ||||||||
| 2013-03-11 | 3 | DIAL |
DIAL GLOBAL, INC. /DE/
Class B Common Stock, par value $0.01 per share |
34,237,638 | ||||||||
| 2012-12-10 |
|
4 | CHTR |
CHARTER COMMUNICATIONS, INC. /MO/
CLASS A COMMON STOCK |
S - Sale | -110,500 | 12,147,369 | -0.90 | 70.35 | -7,773,675 | 854,567,409 | |
| 2012-12-10 |
|
4 | CHTR |
CHARTER COMMUNICATIONS, INC. /MO/
CLASS A COMMON STOCK |
S - Sale | -400,000 | 12,257,869 | -3.16 | 70.00 | -28,000,000 | 858,050,830 | |
| 2012-12-10 |
|
4 | CHTR |
CHARTER COMMUNICATIONS, INC. /MO/
CLASS A COMMON STOCK |
S - Sale | -5,581 | 12,657,869 | -0.04 | 70.00 | -390,670 | 886,050,830 | |
| 2012-12-05 |
|
4 | CHTR |
CHARTER COMMUNICATIONS, INC. /MO/
CLASS A COMMON STOCK |
S - Sale | -173,619 | 12,663,450 | -1.35 | 70.23 | -12,193,262 | 889,354,094 | |
| 2012-12-05 |
|
4 | CHTR |
CHARTER COMMUNICATIONS, INC. /MO/
CLASS A COMMON STOCK |
S - Sale | -370,592 | 12,837,069 | -2.81 | 70.29 | -26,048,912 | 902,317,580 | |
| 2012-12-05 |
|
4 | CHTR |
CHARTER COMMUNICATIONS, INC. /MO/
CLASS A COMMON STOCK |
S - Sale | -139,708 | 13,207,661 | -1.05 | 70.58 | -9,860,591 | 932,196,713 | |
| 2012-11-30 |
|
4 | CHTR |
CHARTER COMMUNICATIONS, INC. /MO/
CLASS A COMMON STOCK |
S - Sale | -526,707 | 13,347,369 | -3.80 | 70.97 | -37,380,396 | 947,262,778 | |
| 2012-11-30 |
|
4 | CHTR |
CHARTER COMMUNICATIONS, INC. /MO/
CLASS A COMMON STOCK |
S - Sale | -567,339 | 13,874,076 | -3.93 | 71.30 | -40,451,271 | 989,221,619 | |
| 2012-11-30 |
|
4 | CHTR |
CHARTER COMMUNICATIONS, INC. /MO/
CLASS A COMMON STOCK |
S - Sale | -205,954 | 14,441,415 | -1.41 | 70.34 | -14,486,804 | 1,015,809,131 | |
| 2012-11-21 | 3 | PULS |
PULSE ELECTRONICS CORP
Common Stock |
38,446,588 | ||||||||
| 2012-11-05 |
|
4 | XCO |
EXCO RESOURCES INC
Stock Options |
A - Award | 5,000 | 5,000 | |||||
| 2012-08-15 |
|
4 | CHTR |
CHARTER COMMUNICATIONS, INC. /MO/
CLASS A COMMON STOCK |
S - Sale | -1,666,667 | 14,647,369 | -10.22 | 73.00 | -121,666,691 | 1,069,257,937 | |
| 2012-08-09 |
|
4 | CHTR |
CHARTER COMMUNICATIONS, INC. /MO/
CLASS A COMMON STOCK |
S - Sale | -166,000 | 16,314,036 | -1.01 | 75.37 | -12,511,420 | 1,229,588,893 | |
| 2012-08-07 |
|
4 | FBP |
FIRST BANCORP /PR/
Common Stock, par value $0.10 per share |
A - Award | 7,485 | 50,691,970 | 0.01 | 3.34 | 25,000 | 169,311,180 | |
| 2012-08-02 |
|
4 | SAVE |
Spirit Airlines, Inc.
Common Stock, par value of $0.0001 per share |
S - Sale | -9,394,927 | 0 | -100.00 | 20.30 | -190,717,018 | ||
| 2012-05-23 |
|
4 | CHTR |
CHARTER COMMUNICATIONS, INC. /MO/
CLASS A COMMON STOCK |
S - Sale | -99,666 | 16,480,036 | -0.60 | 63.58 | -6,336,266 | 1,047,718,289 | |
| 2012-05-23 |
|
4 | CHTR |
CHARTER COMMUNICATIONS, INC. /MO/
CLASS A COMMON STOCK |
S - Sale | -154,117 | 16,579,702 | -0.92 | 64.60 | -9,955,958 | 1,071,048,749 | |
| 2012-05-09 |
|
4 | SAVE |
Spirit Airlines, Inc.
Common Stock, par value of $0.0001 per share |
S - Sale | -3,622,334 | 9,394,927 | -27.83 | 22.51 | -81,538,738 | 211,479,807 | |
| 2012-01-27 |
|
4 | SAVE |
Spirit Airlines, Inc.
Common Stock, par value of $0.0001 per share |
S - Sale | -9,437,966 | 13,017,261 | -42.03 | 13.96 | -131,719,085 | 181,672,800 | |
| 2012-01-03 |
|
4 | SAVE |
Spirit Airlines, Inc.
Common Stock, par value of $0.0001 per share |
J - Other | 21,420,051 | 22,455,227 | 2,069.22 | ||||
| 2012-01-03 |
|
4 | SAVE |
Spirit Airlines, Inc.
Common Stock, par value of $0.0001 per share |
J - Other | -28,111,155 | 0 | -100.00 | ||||
| 2012-01-03 |
|
4 | CHTR |
CHARTER COMMUNICATIONS, INC. /MO/
CLASS A COMMON STOCK |
J - Other | -550,000 | 16,733,819 | -3.18 | 54.35 | -29,892,500 | 909,483,063 | |
| 2012-01-03 |
|
4 | CHTR |
CHARTER COMMUNICATIONS, INC. /MO/
CLASS A COMMON STOCK |
J - Other | -2,441,286 | 17,283,819 | -12.38 | 54.35 | -132,683,894 | 939,375,563 | |
| 2011-12-20 |
|
4 | FBP |
FIRST BANCORP /PR/
Rights to Purchase Common Stock |
J - Other | 544,999 | 544,999 | |||||
| 2011-12-16 |
|
4 | XCO |
EXCO RESOURCES INC
Common Stock |
P - Purchase | 600,000 | 36,856,446 | 1.65 | 9.96 | 5,975,040 | 367,031,232 | |
| 2011-12-16 |
|
4 | XCO |
EXCO RESOURCES INC
Common Stock |
P - Purchase | 1,400,000 | 36,856,446 | 3.95 | 9.87 | 13,815,060 | 363,695,723 | |
| 2011-11-08 |
|
4 | XCO |
EXCO RESOURCES INC
Stock Options |
A - Award | 5,000 | 5,000 | |||||
| 2011-11-08 |
|
4 | XCO |
EXCO RESOURCES INC
Stock Options |
A - Award | 5,000 | 5,000 | |||||
| 2011-10-28 |
|
4 | FBP |
FIRST BANCORP /PR/
Common Stock, par value $.10 per share |
A - Award | 937,493 | 50,684,485 | 1.88 | 3.50 | 3,281,226 | 177,395,698 | |
| 2011-10-17 | 3 | FBP |
FIRST BANCORP /PR/
Common Stock, par value $.10 per share |
49,746,992 | ||||||||
| 2011-07-01 |
|
4 | SAVE |
Spirit Airlines, Inc.
Common Stock, par value of $0.0001 per share |
S - Sale | -256,513 | 29,146,335 | -0.87 | 11.28 | -2,893,467 | 328,770,659 | |
| 2011-06-03 |
|
4 | SAVE |
Spirit Airlines, Inc.
Common Stock, par value of $0.0001 per share |
J - Other | -20,322,406 | 29,402,848 | -40.87 | 12.00 | -243,868,872 | 352,834,176 | |
| 2011-05-24 | 3 | SAVE |
Spirit Airlines, Inc.
Common Stock, par value of $0.0001 per share |
9,080,442 | ||||||||
| 2010-11-03 |
|
4 | AIQ |
Alliance HealthCare Services, Inc
Common Stock |
P - Purchase | 2,531 | 175,949 | 1.46 | 3.96 | 10,010 | 695,878 | |
| 2010-11-03 |
|
4 | AIQ |
Alliance HealthCare Services, Inc
Common Stock |
P - Purchase | 5,061 | 351,899 | 1.46 | 3.96 | 20,016 | 1,391,761 | |
| 2010-11-03 |
|
4 | AIQ |
Alliance HealthCare Services, Inc
Common Stock |
P - Purchase | 25,307 | 1,759,258 | 1.46 | 3.96 | 100,089 | 6,957,865 | |
| 2010-11-03 |
|
4 | AIQ |
Alliance HealthCare Services, Inc
Common Stock |
P - Purchase | 342,101 | 23,782,451 | 1.46 | 3.96 | 1,353,009 | 94,059,594 | |
| 2010-11-01 |
|
4 | AIQ |
Alliance HealthCare Services, Inc
Common Stock |
P - Purchase | 4,049 | 173,418 | 2.39 | 3.77 | 15,253 | 653,266 | |
| 2010-11-01 |
|
4 | AIQ |
Alliance HealthCare Services, Inc
Common Stock |
P - Purchase | 8,098 | 346,838 | 2.39 | 3.77 | 30,505 | 1,306,539 | |
| 2010-11-01 |
|
4 | AIQ |
Alliance HealthCare Services, Inc
Common Stock |
P - Purchase | 40,491 | 1,733,951 | 2.39 | 3.77 | 152,530 | 6,531,793 | |
| 2010-11-01 |
|
4 | AIQ |
Alliance HealthCare Services, Inc
Common Stock |
P - Purchase | 547,362 | 23,440,350 | 2.39 | 3.77 | 2,061,913 | 88,299,798 | |
| 2010-09-14 | 3 | CHTR |
CHARTER COMMUNICATIONS, INC. /MO/
Class A Common Stock |
19,725,105 | ||||||||
| 2010-09-14 | 3 | CHTR |
CHARTER COMMUNICATIONS, INC. /MO/
Class A Common Stock |
2,536 | ||||||||
| 2010-09-01 |
|
4 | AIQ |
Alliance HealthCare Services, Inc
Common Stock |
P - Purchase | 7,193 | 169,369 | 4.44 | 3.88 | 27,909 | 657,152 | |
| 2010-09-01 |
|
4 | AIQ |
Alliance HealthCare Services, Inc
Common Stock |
P - Purchase | 14,387 | 338,740 | 4.44 | 3.88 | 55,822 | 1,314,311 | |
| 2010-09-01 |
|
4 | AIQ |
Alliance HealthCare Services, Inc
Common Stock |
S - Sale | -21,580 | 1,693,460 | -1.26 | 3.88 | -83,730 | 6,570,625 | |
| 2010-08-17 |
|
4 | AIQ |
Alliance HealthCare Services, Inc
Common Stock |
P - Purchase | 337 | 162,176 | 0.21 | 4.50 | 1,515 | 728,981 | |
| 2010-08-17 |
|
4 | AIQ |
Alliance HealthCare Services, Inc
Common Stock |
P - Purchase | 675 | 324,353 | 0.21 | 4.50 | 3,034 | 1,457,967 | |
| 2010-08-17 |
|
4 | AIQ |
Alliance HealthCare Services, Inc
Common Stock |
P - Purchase | 3,375 | 1,715,040 | 0.20 | 4.50 | 15,171 | 7,709,105 | |
| 2010-08-17 |
|
4 | AIQ |
Alliance HealthCare Services, Inc
Common Stock |
P - Purchase | 45,613 | 22,892,988 | 0.20 | 4.50 | 205,030 | 102,903,981 | |
| 2010-08-17 |
|
4 | AIQ |
Alliance HealthCare Services, Inc
Common Stock |
P - Purchase | 1,839 | 161,839 | 1.15 | 4.50 | 8,276 | 728,276 | |
| 2010-08-17 |
|
4 | AIQ |
Alliance HealthCare Services, Inc
Common Stock |
P - Purchase | 3,678 | 323,678 | 1.15 | 4.50 | 16,551 | 1,456,551 | |
| 2010-08-17 |
|
4 | AIQ |
Alliance HealthCare Services, Inc
Common Stock |
P - Purchase | 3,256 | 1,711,665 | 0.19 | 4.50 | 14,652 | 7,702,492 | |
| 2010-08-17 |
|
4 | AIQ |
Alliance HealthCare Services, Inc
Common Stock |
P - Purchase | 91,227 | 22,847,375 | 0.40 | 4.50 | 410,522 | 102,813,188 | |
| 2010-08-05 |
|
4 | AIQ |
Alliance HealthCare Services, Inc
Common Stock |
P - Purchase | 4,278 | 1,708,409 | 0.25 | 4.25 | 18,182 | 7,260,738 | |
| 2010-08-05 |
|
4 | AIQ |
Alliance HealthCare Services, Inc
Common Stock |
P - Purchase | 44,484 | 22,756,148 | 0.20 | 4.25 | 189,057 | 96,713,629 | |
| 2010-08-03 |
|
4 | AIQ |
Alliance HealthCare Services, Inc
Common Stock |
P - Purchase | 9,163 | 1,704,131 | 0.54 | 4.25 | 38,943 | 7,242,557 | |
| 2010-08-03 |
|
4 | AIQ |
Alliance HealthCare Services, Inc
Common Stock |
P - Purchase | 95,287 | 22,711,664 | 0.42 | 4.25 | 404,970 | 96,524,572 | |
| 2010-08-03 |
|
4 | AIQ |
Alliance HealthCare Services, Inc
Common Stock |
P - Purchase | 94,968 | 1,694,968 | 5.94 | 3.92 | 372,275 | 6,644,275 | |
| 2010-08-03 |
|
4 | AIQ |
Alliance HealthCare Services, Inc
Common Stock |
P - Purchase | 987,532 | 22,616,377 | 4.57 | 3.92 | 3,871,125 | 88,656,198 | |
| 2009-12-21 |
|
4 | CXPO |
CRIMSON EXPLORATION INC.
Series G Convertible Preferred Stock |
A - Award | 76,710 | 76,710 | |||||
| 2009-12-03 |
|
4 | XCO |
EXCO RESOURCES INC
Stock Options |
A - Award | 15,000 | 15,000 | |||||
| 2008-07-23 | 3 | SOLR |
GT Solar International, Inc.
Common Stock |
141,738,336 | ||||||||
| 2008-07-22 |
|
4 | XCO |
EXCO RESOURCES INC
Series A-1 Hybrid Stock |
C - Conversion | -24,150 | 0 | -100.00 | 10,000.00 | -241,500,000 | ||
| 2008-07-22 |
|
4 | XCO |
EXCO RESOURCES INC
Series A-1 Hybrid Stock |
C - Conversion | -24,150 | 0 | -100.00 | 10,000.00 | -241,500,000 | ||
| 2008-07-22 |
|
4 | XCO |
EXCO RESOURCES INC
Series B 7.0% Cumulative Conv. Perpetual Preferred Stock |
C - Conversion | -5,850 | 0 | -100.00 | 10,000.00 | -58,500,000 | ||
| 2008-07-22 |
|
4 | XCO |
EXCO RESOURCES INC
Series B 7.0% Cumulative Conv. Perpetual Preferred Stock |
C - Conversion | -5,850 | 0 | -100.00 | 10,000.00 | -58,500,000 | ||
| 2008-07-22 |
|
4 | XCO |
EXCO RESOURCES INC
Common Stock |
C - Conversion | 15,789,473 | 34,816,446 | 82.98 | ||||
| 2008-07-22 |
|
4 | XCO |
EXCO RESOURCES INC
Common Stock |
C - Conversion | 15,789,473 | 34,816,446 | 82.98 | ||||
| 2007-12-05 |
|
4 | XCO |
EXCO RESOURCES INC
Nonqualified Stock Options |
A - Award | 50,000 | 112,500 | 80.00 | ||||
| 2007-11-01 |
|
4 | XCO |
EXCO RESOURCES INC
Nonqualified Stock Options |
J - Other | -37,500 | 12,500 | -75.00 | ||||
| 2007-08-31 |
|
4 | XCO |
EXCO RESOURCES INC
Series A-1 Hybrid Stock |
A - Award | 24,150 | 24,150 | 10,000.00 | 241,500,000 | 241,500,000 | ||
| 2007-08-31 |
|
4 | XCO |
EXCO RESOURCES INC
Series A-1 Hybrid Stock |
A - Award | 24,150 | 24,150 | 10,000.00 | 241,500,000 | 241,500,000 | ||
| 2007-08-31 |
|
4 | XCO |
EXCO RESOURCES INC
Nonqualified Stock Options |
A - Award | 50,000 | 100,000 | 100.00 | ||||
| 2007-08-31 |
|
4 | XCO |
EXCO RESOURCES INC
Series B 7.0% Cumulative Conv. Perpetual Preferred Stock |
J - Other | 5,850 | 5,850 | 10,000.00 | 58,500,000 | 58,500,000 | ||
| 2007-08-17 |
|
4 | CXPO.OB |
CRIMSON EXPLORATION INC.
Common Stock |
P - Purchase | 750,000 | 1,988,486 | 60.56 | 6.97 | 5,227,500 | 13,859,747 | |
| 2007-07-26 |
|
4 | CXPO.OB |
CRIMSON EXPLORATION INC.
Common Stock |
P - Purchase | 1,219,819 | 1,238,486 | 6,534.63 | 6.97 | 8,502,138 | 8,632,247 |
P
Compra de mercado aberto ou privada de ativo não-derivativo ou derivativo
S
Venda de mercado aberto ou privada de ativo não-derivativo ou derivativo
A
Concessão, premiação, ou outra aquisição de ativos da empresa (como uma opção)
C
Conversão de derivativo
D
Venda ou transferência de ativos de volta para a empresa
F
Pagamento do preço de exercício ou responsabilidade fiscal utilizando parte dos ativos recebidos da empresa
G
Doação de ativos pelo ou para o insider
K
Swaps de capital e transações de hedge similares
M
Exercício ou conversão de ativo derivativo recebido da empresa (como uma opção)
V
Uma transação voluntariamente reportada no Formulário 4
J
Outro (acompanhado de uma nota explicativa descrevendo a transação)