| Ações em Circulação | 41,287,437 shares |
| Ações de Insider | 55,574,254 shares |
| Total de Insiders | 72 |
Pontuação de Sentimento de Insider
A Pontuação de Sentimento de Insider encontra as empresas que estão sendo compradas por insiders corporativos.
É o resultado de um modelo quantitativo sofisticado e multifatorial que identifica empresas com os mais altos níveis de acumulação por insiders. O modelo de pontuação usa uma combinação do número líquido de insiders comprando nos últimos 90 dias, o total de ações compradas como um percentual do float, e o total de ações possuídas por insiders. A escala varia de 0 a 100, com números mais altos indicando um maior nível de acumulação em relação aos seus pares, e 50 sendo a média.
Frequência de Atualização: Diariamente
Pontuação de Sentimento dos Oficiais
A Pontuação de Sentimento de Officer encontra empresas que estão sendo compradas por Oficiais Corporativos.
Por definição, Oficiais Corporativos são Insiders Corporativos, mas, ao contrário de alguns outros Insiders (Acionistas de 10% e Membros do Conselho), os Oficiais trabalham para a empresa diariamente, e eles usam seu próprio dinheiro ao negociar. (Acionistas de 10% e Membros do Conselho muitas vezes são gestores de fundos que gerenciam o dinheiro de outras pessoas.) Como tal, as negociações de insiders feitas por Oficiais são muito mais significativas e devem ser tratadas apropriadamente.
Como a Pontuação de Sentimento dos Insiders, a Pontuação de Sentimento de Officer é o resultado de um modelo quantitativo sofisticado e multifatorial que identifica empresas com os mais altos níveis de acumulação por parte dos oficiais.
Frequência de Atualização: Diariamente
Principais Métricas de Insider
Este cartão mostra como a empresa se classifica em várias métricas internas. O percentil mostra como esta empresa se compara a outras empresas nos mercados dos EUA. Classificações mais altas são indicativas de situações melhores.
Por exemplo, geralmente aceita-se que a compra interna é um indicador positivo, portanto, empresas com mais compras internas teriam classificações mais altas do que empresas com menos compras internas (ou até mesmo venda interna).
Percentual do Float Comprado por Insiders (Classificação)
10702 out of 10786
Percentual do Float Comprado por Insiders é o número total de ações compradas por insiders menos o número total de ações vendidas por insiders nos últimos 90 dias, dividido pelo total flutuante e multiplicado por 100.
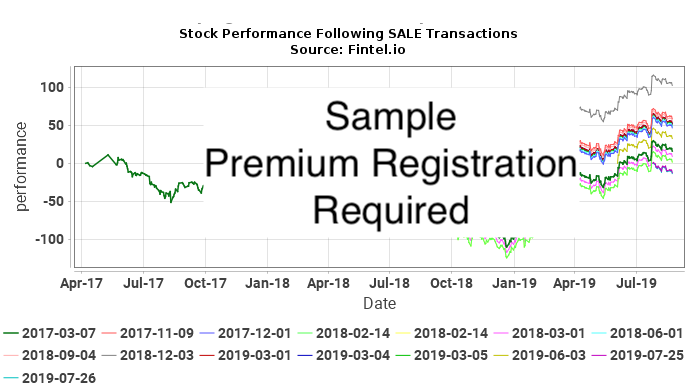
Gráfico de Negociação de Insider
Amplify Energy Corp. negociações de insiders são mostradas no seguinte gráfico. Insiders são oficiais, diretores ou investidores significativos em uma empresa. Em geral, é geralmente ilegal para insiders realizarem negociações em suas empresas com base em informações materiais, não públicas. Isso não significa que seja ilegal para eles fazerem quaisquer negociações em suas próprias empresas. No entanto, eles devem relatar todas as negociações à SEC através de um Formulário 4.
Roster de Insider e Métricas de Lucratividade
Esta tabela mostra a lista de insiders conhecidos, e é gerada automaticamente a partir de arquivamentos divulgados à SEC. Além dos nomes, título mais recente, e designação de diretor, oficial ou proprietário de 10%, fornecemos as últimas participações divulgadas. Adicionalmente, quando possível fornecemos o desempenho comercial histórico do insider. O desempenho comercial histórico é uma média ponderada do desempenho de transações reais de compra no mercado aberto feitas pelo insider. Para mais informações sobre como isso é calculado, assista este webinar no YouTube.
See our leaderboard of most profitable insider traders.
| Insider | Lucro Médio (%) | Ações Possuídas |
Ajuste de Divisão |
|---|---|---|---|
| Deborah G Adams Director - [D] | 81,626 | 81,626 | |
|
Avenue Capital Management II, L.P.
10% Owner -
|
2,561,375 | 2,561,375 | |
| Frederic F Brace President and CEO, Director - [D] [O] | 83,900 | 83,900 | |
|
Brigade Capital Management, Lp
10% Owner -
|
3,748,088 | 3,748,088 | |
|
Brigade Capital Management GP, LLC
10% Owner -
|
3,748,088 | 3,748,088 | |
| Burleigh Dexter A. SVP - Strategic Planning - [O] | 493,198 | 493,198 | |
| Clint D Coghill Director - [D] | 2,504,347 | 2,504,347 | |
| John A Crum Chairman, President and CEO, Director - [D] [O] | 1,325,465 | 1,325,465 | |
| Alan Jeffrey Carr Director - [D] | 51,294 | 51,294 | |
|
Centerbridge Credit Partners Master AIV IV, L.P.
10% Owner -
|
646,632 | 646,632 | |
|
Centerbridge Credit Partners, L.P.
10% Owner -
|
1,360,372 | 1,360,372 | |
| Eric J Christ VP, Gen. Counsel & Corp. Sec. - [O] | 149,866 | 149,866 | |
| James E Craddock Director - [D] | 44,557 | 44,557 | |
| David Matthew G. Vice President - Land - [O] | 325,631 | 325,631 | |
| George A DeMontrond | 0 | ||
| Anastasia Deulina | 0 | ||
| Patrice D Douglas Director - [D] | 79,960 | 79,960 | |
| Denise DuBard See Remarks - [O] | 49,334 | 49,334 | |
| Eric Edward Dulany SEE REMARKS - [O] | 60,077 | 60,077 | |
| David M Dunn Director - [D] | 2,232 | 2,232 | |
| Mark E Eck EVP - COO - [O] | 266,667 | 266,667 | |
| Elkins Mitchell G. EVP Operations - [O] | 22,999 | 22,999 | |
|
Fir Tree Inc.
Director, 10% Owner -
[D]
|
0 | 0 | |
| James Frew SEE REMARKS - [O] | 191,859 | 191,859 |
| Insider | Lucro Médio (%) | Ações Possuídas |
Ajuste de Divisão |
|---|---|---|---|
| Daniel Furbee SEE REMARKS, Director - [D] [O] | 112,472 | 112,472 | |
|
First Reserve GP XII Ltd
10% Owner -
|
27,147,651 | 27,147,651 | |
| Foley John P. VP - Corp. Counsel & Secretary - [O] | 638,737 | 638,737 | |
| Natasha France SEE REMARKS - [O] | 67,672 | 67,672 | |
| Neal P Goldman Director - [D] | 38,442 | 38,442 | |
| Greager Eric T. Director - [D] | 11,442 | 11,442 | |
| Nelson M Haight EVP and CFO - [O] | 11,626 | 11,626 | |
| Peter J Hill Director - [D] | 41,000 | 41,000 | |
| Nelson Haight EVP, CFO and CAO - [O] | 734,182 | 734,182 | |
| Hamm Christopher W. Director - [D] | 272,078 | 272,078 | |
| Amelia Kim Harding VP- Human Resources & Admin - [O] | 48,209 | 48,209 | |
| Hart James R. Vice President - Midstream - [O] | 146,599 | 146,599 | |
| Gregory F Hebertson SVP - Exploration - [O] | 228,420 | 228,420 | |
| Scott L Hoffman | 0 | ||
| Alex T Krueger | 0 | ||
| Randal T Klein Director - [D] | 17,824 | 17,824 | |
| Thomas C Knudson Director - [D] | 42,000 | 42,000 | |
|
Marc Lasry
10% Owner -
|
2,561,375 | 2,561,375 | |
| Loren M Leiker Director - [D] | 50,615 | 50,615 | |
| Lederman Evan S. Director - [D] | 40,329 | 40,329 | |
| Anthony William Lopez SEE REMARKS - [O] | 196,727 | 196,727 | |
|
William E Macaulay
10% Owner -
|
27,147,651 | 27,147,651 | |
| Kenneth Mariani PRESIDENT, CEO, Director - [D] [O] | 55,034 | 55,034 | |
| Thomas L Mitchell EVP & Chief Financial Officer - [O] | 430,375 | 430,375 |
| Insider | Lucro Médio (%) | Ações Possuídas |
Ajuste de Divisão |
|---|---|---|---|
| Richard Wayne McCullough VP and CAO - [O] | 32,356 | 32,356 | |
| Stephen James McDaniel Director - [D] | 4,506,242 | 4,506,242 | |
| Jason William McGlynn SVP, CHIEF FINANCIAL OFFICER - [O] | 79,987 | 79,987 | |
| John Mogford | 0 | ||
| Curtis Newstrom SVP - Business Development - [O] | 540,877 | 540,877 | |
| Robert Earl Ogle | 0 | ||
| Vidisha Prasad Director - [D] | 32,850 | 32,850 | |
| David Proman Director - [D] | 45,329 | 45,329 | |
| Stephen C Pugh EVP & Chief Operating Officer - [O] | 356,717 | 356,717 | |
|
R/C IV Eagle Holdings, L.P.
10% Owner -
|
1,960,265 | 1,960,265 | |
| Mary P Ricciardello Director - [D] | 50,615 | 50,615 | |
| Michael Reddin Director - [D] | 10,100 | 10,100 | |
| Bruce H Stover | 0 | ||
| Sambrooks David J. President and CEO, Director - [D] [O] | 160,625 | 160,625 | |
| Polly Schott See Remarks - [O] | 22,334 | 22,334 | |
| Richard Smiley SVP, OPERATIONS - [O] | 169,869 | 169,869 | |
| Todd R Snyder Director - [D] | 128,081 | 128,081 | |
| Thomas E Thiele SVP - Mid-Continent Region - [O] | 216,328 | 216,328 | |
| Tichio Robert M. | 0 | ||
| Bruce H Vincent Director - [D] | 100 | 100 | |
| Scott C Weatherholt EVP-GC, Corp Secty EVP-Land - [O] | 77,232 | 77,232 | |
| Willis Eric M. See Remarks - [O] | 266,347 | 266,347 | |
| Martyn Willsher SEE REMARKS, Director - [D] [O] | 310,794 | 310,794 | |
| Clifford G Zwahlen VP - Corporate Reserves - [O] | 45,000 | 45,000 |
Report errors via our new Insider Auditing Tool
Acompanhar Históricos de Compras de Insiders - Análise de Lucro a Curto Prazo
Nesta seção, analisamos a lucratividade de cada compra de insider não planejada, feita no mercado aberto em AMPY / Amplify Energy Corp.. Esta análise ajuda a entender se o insider gera consistentemente retornos anormais, e vale a pena ser seguido. Esta análise é para um ano após cada negociação, e os resultados são teóricos .
A tabela a seguir mostra as compras mais recentes no mercado aberto que não fizeram parte de um plano de negociação automática.
Preço Ajustado é o preço ajustado pelo desdobramento. Ações Ajustadas são as ações ajustadas pelo desdobramento.
Acompanhar Históricos de Vendas de Insiders - Análise de Perda a Curto Prazo
Nesta seção, analisamos a evitação de perda de curto prazo de cada venda de insider não planejada, feita no mercado aberto em AMPY / Amplify Energy Corp.. Um padrão consistente de evitação de perdas pode sugerir que transações de venda futuras possam prever quedas no preço. Esta análise é para um ano após cada negociação, e os resultados são teóricos .
A tabela a seguir mostra as vendas mais recentes no mercado aberto que não fizeram parte de um plano de negociação automática.
Preço Ajustado é o preço ajustado pelo desdobramento. Ações Ajustadas são as ações ajustadas pelo desdobramento.
Histórico de Transações
Clique no ícone de link para ver o histórico completo de transações. As transações relatadas como parte de um plano de negociação automática 10b5-1 terão um X na coluna marcada como 10b-5.
| Arquivo Data |
Data da Operação |
Formulário | Insider | Ticker | Título de Segurança | Código | Direto | Preço de Exercício Preço Unitário |
Preço por Unidade |
Unidades Alteradas |
Valor Alterado (1K) |
Opções Restantes |
Ações Restantes |
|
|---|---|---|---|---|---|---|---|---|---|---|---|---|---|---|
| 2026-03-17 | 2026-03-17 | 4 | COGHILL CLINT D By: Stoney Lonesome HF LP | AMPY | Common Stock, par value $0.01 per share | I | 6.3100 | -242,489 | -1,530 | 2,504,347 | ||||
| 2026-03-17 | 2026-03-16 | 4 | COGHILL CLINT D By: Stoney Lonesome HF LP | AMPY | Common Stock, par value $0.01 per share | I | 6.4200 | -501,279 | -3,218 | 2,746,836 | ||||
| 2026-03-17 | 2026-03-13 | 4 | COGHILL CLINT D By: Stoney Lonesome HF LP | AMPY | Common Stock, par value $0.01 per share | I | 6.6600 | -256,232 | -1,707 | 3,248,115 | ||||
| 2026-02-04 | 2026-02-01 | 4 | Willis Eric M. | AMPY | Common Stock, par value $0.01 per share | D | 5.0200 | -17,956 | -90 | 266,347 | ||||
| 2026-02-04 | 2026-02-01 | 4 | Willis Eric M. | AMPY | Common Stock, par value $0.01 per share | D | 45,243 | 284,303 | ||||||
| 2026-02-04 | 2026-02-01 | 4 | FREW JAMES | AMPY | Common Stock, par value $0.01 per share | D | 5.0200 | -19,917 | -100 | 191,859 | ||||
| 2026-02-04 | 2026-02-01 | 4 | FREW JAMES | AMPY | Common Stock, par value $0.01 per share | D | 50,613 | 211,776 | ||||||
| 2026-02-04 | 2026-02-01 | 4 | FURBEE DANIEL | AMPY | Common Stock, par value $0.01 per share | D | 5.0200 | -20,297 | -102 | 112,472 | ||||
| 2026-02-04 | 2026-02-01 | 4 | FURBEE DANIEL | AMPY | Common Stock, par value $0.01 per share | D | 51,580 | 132,769 | ||||||
| 2026-02-04 | 2026-02-01 | 4 | Lopez Anthony William | AMPY | Common Stock, par value $0.01 per share | D | 5.0200 | -31,605 | -159 | 196,727 | ||||
| 2026-02-04 | 2026-02-01 | 4 | Lopez Anthony William | AMPY | Common Stock, par value $0.01 per share | D | 12,641 | 228,332 | ||||||
| 2026-02-04 | 2026-02-01 | 4 | Lopez Anthony William | AMPY | Common Stock, par value $0.01 per share | D | 65,641 | 215,691 | ||||||
| 2026-02-04 | 2026-02-01 | 4 | France Natasha | AMPY | Common Stock, par value $0.01 per share | D | 5.0200 | -3,100 | -16 | 67,672 | ||||
| 2026-02-04 | 2026-02-01 | 4 | France Natasha | AMPY | Common Stock, par value $0.01 per share | D | 10,449 | 70,772 | ||||||
| 2026-01-08 | 2026-01-06 | 4 | FREW JAMES | AMPY | Common Stock, par value $0.01 per share | D | 4.5700 | -23,888 | -109 | 161,163 | ||||
| 2026-01-08 | 2026-01-06 | 4 | FREW JAMES | AMPY | Common Stock, par value $0.01 per share | D | 55,829 | 185,051 | ||||||
| 2026-01-08 | 2026-01-06 | 4 | Willis Eric M. | AMPY | Common Stock, par value $0.01 per share | D | 4.5700 | -13,155 | -60 | 239,060 | ||||
| 2026-01-08 | 2026-01-06 | 4 | Willis Eric M. | AMPY | Common Stock, par value $0.01 per share | D | 29,462 | 252,215 | ||||||
| 2026-01-08 | 2026-01-06 | 4 | FURBEE DANIEL | AMPY | Common Stock, par value $0.01 per share | D | 4.5700 | -23,878 | -109 | 81,189 | ||||
| 2026-01-08 | 2026-01-06 | 4 | FURBEE DANIEL | AMPY | Common Stock, par value $0.01 per share | D | 55,829 | 105,067 | ||||||
| 2026-01-08 | 2026-01-06 | 4 | Lopez Anthony William | AMPY | Common Stock, par value $0.01 per share | D | 4.5700 | -7,768 | -35 | 150,050 | ||||
| 2026-01-08 | 2026-01-06 | 4 | Lopez Anthony William | AMPY | Common Stock, par value $0.01 per share | D | 17,397 | 157,818 | ||||||
| 2025-11-17 | 2025-11-14 | 4 | Dulany Eric Edward | AMPY | Common Stock, par value $0.01 per share | D | 5.6300 | -20,090 | -113 | 60,077 | ||||
| 2025-11-17 | 2025-11-14 | 4 | Dulany Eric Edward | AMPY | Common Stock, par value $0.01 per share | D | 51,050 | 80,167 | ||||||
| 2025-08-14 | 2025-08-14 | 4 | COGHILL CLINT D By: Stoney Lonesome HF LP | AMPY | Common Stock, par value $0.01 per share | I | 3.8888 | 65,494 | 255 | 3,504,347 | ||||
| 2025-08-14 | 2025-08-13 | 4 | COGHILL CLINT D By: Stoney Lonesome HF LP | AMPY | Common Stock, par value $0.01 per share | I | 3.8763 | 167,086 | 648 | 3,438,853 | ||||
| 2025-08-14 | 2025-08-12 | 4 | COGHILL CLINT D By: Stoney Lonesome HF LP | AMPY | Common Stock, par value $0.01 per share | I | 3.6929 | 117,420 | 434 | 3,271,767 | ||||
| 2025-08-13 | 2025-08-12 | 4 | FREW JAMES | AMPY | Common Stock, par value $0.01 per share | D | 3.7000 | 25,000 | 92 | 129,222 | ||||
| 2025-08-13 | 2025-08-11 | 4 | FREW JAMES | AMPY | Common Stock, par value $0.01 per share | D | 3.5000 | 50,000 | 175 | 104,222 | ||||
| 2025-07-02 | 2025-07-01 | 4 | Adams Deborah G | AMPY | Common Stock, par value $0.01 per share | D | 19,665 | 81,626 | ||||||
| 2025-07-02 | 2025-07-01 | 4 | Hamm Christopher W. | AMPY | Common Stock, par value $0.01 per share | D | 27,531 | 272,078 | ||||||
| 2025-07-02 | 2025-07-01 | 4 | Snyder Todd R | AMPY | Common Stock, par value $0.01 per share | D | 19,665 | 128,081 | ||||||
| 2025-06-24 | 2025-06-20 | 4 | COGHILL CLINT D | AMPY | Common Stock, par value $0.01 per share | I | 3.6700 | 150,000 | 550 | 3,154,347 | ||||
| 2025-06-23 | 2025-06-23 | 4 | Dulany Eric Edward | AMPY | Common Stock, par value $0.01 per share | D | 3.6515 | -5,500 | -20 | 29,117 | ||||
| 2025-06-20 | 2025-06-18 | 4 | Hamm Christopher W. | AMPY | Common Stock, par value $0.01 per share | D | 3.6700 | 77,176 | 283 | 244,547 | ||||
| 2025-06-13 | 2025-06-13 | 4 | Douglas Patrice D | AMPY | Common Stock, par value $0.01 per share | D | 19,665 | 79,960 | ||||||
| 2025-06-13 | 2025-06-13 | 4 | Prasad Vidisha | AMPY | Common Stock, par value $0.01 per share | D | 19,665 | 32,850 | ||||||
| 2025-06-13 | 2025-06-13 | 4 | Craddock James E | AMPY | Common Stock, par value $0.01 per share | D | 19,665 | 44,557 | ||||||
| 2025-06-06 | 2025-06-06 | 4 | COGHILL CLINT D | AMPY | Common Stock, par value $0.01 per share | I | 3.4000 | 31,000 | 105 | 3,004,347 | ||||
| 2025-06-06 | 2025-06-05 | 4 | COGHILL CLINT D | AMPY | Common Stock, par value $0.01 per share | I | 3.2600 | 92,000 | 300 | 2,973,347 | ||||
| 2025-06-06 | 2025-06-04 | 4 | COGHILL CLINT D | AMPY | Common Stock, par value $0.01 per share | I | 3.2700 | 181,000 | 592 | 2,881,347 | ||||
| 2025-06-02 | 2025-05-30 | 4 | FURBEE DANIEL | AMPY | Common Stock, par value $0.01 per share | D | 2.9747 | 10,000 | 30 | 49,238 | ||||
| 2025-05-22 | 3 | COGHILL CLINT D | AMPY | Common Stock, par value $0.01 per share | I | 2,783,347 | ||||||||
| 2025-05-22 | 3 | COGHILL CLINT D | AMPY | Common Stock, par value $0.01 per share | D | 2,410 | ||||||||
| 2025-03-12 | 2025-03-11 | 4 | Adams Deborah G | AMPY | Common Stock, par value $0.01 per share | D | 4.1400 | 10,000 | 41 | 61,961 | ||||
| 2025-03-10 | 2025-03-07 | 4 | FREW JAMES | AMPY | Common Stock, par value $0.01 per share | D | 3.8500 | 15,000 | 58 | 54,222 | ||||
| 2025-03-10 | 2025-03-07 | 4 | Willsher Martyn | AMPY | Common Stock, par value $0.01 per share | D | 3.8400 | 15,000 | 58 | 310,794 | ||||
| 2025-03-10 | 2025-03-07 | 4 | Snyder Todd R | AMPY | Common Stock, par value $0.01 per share | D | 3.8300 | 25,000 | 96 | 108,416 | ||||
| 2025-02-04 | 2025-02-01 | 4 | Willis Eric M. | AMPY | Common Stock, par value $0.01 per share | D | 5.3400 | -15,818 | -84 | 222,753 | ||||
| 2025-02-04 | 2025-02-01 | 4 | Willis Eric M. | AMPY | Common Stock, par value $0.01 per share | D | 40,195 | 238,571 | ||||||
| 2025-02-04 | 2025-02-01 | 4 | Willsher Martyn | AMPY | Common Stock, par value $0.01 per share | D | 5.3400 | -24,200 | -129 | 295,794 | ||||
| 2025-02-04 | 2025-02-01 | 4 | Willsher Martyn | AMPY | Common Stock, par value $0.01 per share | D | 61,496 | 319,994 | ||||||
| 2025-02-04 | 2025-02-01 | 4 | Lopez Anthony William | AMPY | Common Stock, par value $0.01 per share | D | 5.3400 | -10,269 | -55 | 140,421 | ||||
| 2025-02-04 | 2025-02-01 | 4 | Lopez Anthony William | AMPY | Common Stock, par value $0.01 per share | D | 26,094 | 150,690 | ||||||
| 2025-02-04 | 2025-02-01 | 4 | FURBEE DANIEL | AMPY | Common Stock, par value $0.01 per share | D | 5.3400 | -14,607 | -78 | 39,238 | ||||
| 2025-02-04 | 2025-02-01 | 4 | FURBEE DANIEL | AMPY | Common Stock, par value $0.01 per share | D | 33,545 | 53,845 | ||||||
| 2025-02-04 | 2025-02-01 | 4 | FREW JAMES | AMPY | Common Stock, par value $0.01 per share | D | 5.3400 | -14,623 | -78 | 39,222 | ||||
| 2025-02-04 | 2025-02-01 | 4 | FREW JAMES | AMPY | Common Stock, par value $0.01 per share | D | 33,545 | 53,845 | ||||||
| 2025-02-04 | 2025-02-01 | 4 | Dulany Eric Edward | AMPY | Common Stock, par value $0.01 per share | D | 5.3400 | -11,151 | -60 | 34,617 | ||||
| 2025-02-04 | 2025-02-01 | 4 | Dulany Eric Edward | AMPY | Common Stock, par value $0.01 per share | D | 24,971 | 45,768 | ||||||
| 2025-01-10 | 2025-01-08 | 4 | Willis Eric M. | AMPY | Common Stock, par value $0.01 per share | D | 6.0000 | -29,659 | -178 | 198,376 | ||||
| 2025-01-10 | 2025-01-08 | 4 | Willis Eric M. | AMPY | Common Stock, par value $0.01 per share | D | 72,116 | 228,035 | ||||||
| 2025-01-10 | 2025-01-08 | 4 | Willsher Martyn | AMPY | Common Stock, par value $0.01 per share | D | 6.0000 | -48,201 | -289 | 258,498 | ||||
| 2025-01-10 | 2025-01-08 | 4 | Willsher Martyn | AMPY | Common Stock, par value $0.01 per share | D | 120,192 | 306,699 | ||||||
| 2025-01-10 | 2025-01-08 | 4 | Lopez Anthony William | AMPY | Common Stock, par value $0.01 per share | D | 6.0000 | -23,298 | -140 | 124,596 | ||||
| 2025-01-10 | 2025-01-08 | 4 | Lopez Anthony William | AMPY | Common Stock, par value $0.01 per share | D | 55,632 | 147,894 | ||||||
| 2024-08-13 | 2024-08-12 | 4 | Dulany Eric Edward | AMPY | Common Stock, par value $0.01 per share | D | 7.0329 | -6,000 | -42 | 20,797 | ||||
| 2024-07-03 | 2024-07-01 | 4 | Douglas Patrice D | AMPY | Common Stock, par value $0.01 per share | D | 19,077 | 60,295 | ||||||
| 2024-07-03 | 2024-07-01 | 4 | Dulany Eric Edward | AMPY | Common Stock, par value $0.01 per share | D | 6.7800 | -3,820 | -26 | 26,797 | ||||
| 2024-07-03 | 2024-07-01 | 4 | Dulany Eric Edward | AMPY | Common Stock, par value $0.01 per share | D | 9,706 | 30,617 | ||||||
| 2024-07-03 | 2024-07-01 | 4 | Craddock James E | AMPY | Common Stock, par value $0.01 per share | D | 24,892 | 24,892 | ||||||
| 2024-07-03 | 2024-07-01 | 4 | Snyder Todd R | AMPY | Common Stock, par value $0.01 per share | D | 19,077 | 83,416 | ||||||
| 2024-07-03 | 2024-07-01 | 4 | Prasad Vidisha | AMPY | Common Stock, par value $0.01 per share | D | 13,185 | 13,185 | ||||||
| 2024-07-03 | 2024-07-01 | 4 | Adams Deborah G | AMPY | Common Stock, par value $0.01 per share | D | 19,077 | 51,961 | ||||||
| 2024-07-03 | 2024-07-01 | 4 | Hamm Christopher W. | AMPY | Common Stock, par value $0.01 per share | D | 26,708 | 167,371 | ||||||
| 2024-05-15 | 2024-05-15 | 4 | Klein Randal T | AMPY | Common Stock, par value $0.01 per share | D | 17,824 | 17,824 | ||||||
| 2024-03-18 | 2024-03-16 | 4 | Lopez Anthony William | AMPY | Common Stock, par value $0.01 per share | D | 6.0500 | -3,773 | -23 | 92,262 | ||||
| 2024-03-18 | 2024-03-16 | 4 | Lopez Anthony William | AMPY | Common Stock, par value $0.01 per share | D | 9,588 | 96,035 | ||||||
| 2024-03-18 | 2024-03-16 | 4 | Willsher Martyn | AMPY | Common Stock, par value $0.01 per share | D | 6.0500 | -8,152 | -49 | 186,507 | ||||
| 2024-03-18 | 2024-03-16 | 4 | Willsher Martyn | AMPY | Common Stock, par value $0.01 per share | D | 20,715 | 194,659 | ||||||
| 2024-03-18 | 2024-03-16 | 4 | Willis Eric M. | AMPY | Common Stock, par value $0.01 per share | D | 6.0500 | -4,891 | -30 | 155,919 | ||||
| 2024-03-18 | 2024-03-16 | 4 | Willis Eric M. | AMPY | Common Stock, par value $0.01 per share | D | 12,429 | 160,810 | ||||||
| 2024-02-05 | 2024-02-01 | 4 | Willis Eric M. | AMPY | Common Stock, par value $0.01 per share | D | 6.1200 | -8,595 | -53 | 148,381 | ||||
| 2024-02-05 | 2024-02-01 | 4 | Willis Eric M. | AMPY | Common Stock, par value $0.01 per share | D | 21,839 | 156,976 | ||||||
| 2024-02-05 | 2024-02-01 | 4 | FREW JAMES | AMPY | Common Stock, par value $0.01 per share | D | 6.1200 | -8,309 | -51 | 20,300 | ||||
| 2024-02-05 | 2024-02-01 | 4 | FREW JAMES | AMPY | Common Stock, par value $0.01 per share | D | 18,609 | 28,609 | ||||||
| 2024-02-05 | 2024-02-01 | 4 | Willsher Martyn | AMPY | Common Stock, par value $0.01 per share | D | 6.1200 | -15,244 | -93 | 173,944 | ||||
| 2024-02-05 | 2024-02-01 | 4 | Willsher Martyn | AMPY | Common Stock, par value $0.01 per share | D | 38,737 | 189,188 | ||||||
| 2024-02-05 | 2024-02-01 | 4 | Lopez Anthony William | AMPY | Common Stock, par value $0.01 per share | D | 6.1200 | -5,899 | -36 | 86,447 | ||||
| 2024-02-05 | 2024-02-01 | 4 | Lopez Anthony William | AMPY | Common Stock, par value $0.01 per share | D | 15,071 | 92,346 | ||||||
| 2024-02-05 | 2024-02-01 | 4 | FURBEE DANIEL | AMPY | Common Stock, par value $0.01 per share | D | 6.1200 | -8,309 | -51 | 20,300 | ||||
| 2024-02-05 | 2024-02-01 | 4 | FURBEE DANIEL | AMPY | Common Stock, par value $0.01 per share | D | 18,609 | 28,609 | ||||||
| 2024-02-05 | 2024-02-01 | 4 | Dulany Eric Edward | AMPY | Common Stock, par value $0.01 per share | D | 6.1200 | -7,413 | -45 | 20,911 | ||||
| 2024-02-05 | 2024-02-01 | 4 | Dulany Eric Edward | AMPY | Common Stock, par value $0.01 per share | D | 16,601 | 28,324 | ||||||
| 2024-01-08 | 2024-01-05 | 4 | Willsher Martyn | AMPY | Common Stock, par value $0.01 per share | D | 5.9300 | -21,879 | -130 | 150,451 | ||||
| 2024-01-08 | 2024-01-05 | 4 | Willsher Martyn | AMPY | Common Stock, par value $0.01 per share | D | 51,892 | 172,330 | ||||||
| 2024-01-08 | 2024-01-05 | 4 | Willis Eric M. | AMPY | Common Stock, par value $0.01 per share | D | 5.9300 | -13,734 | -81 | 135,137 | ||||
| 2024-01-08 | 2024-01-05 | 4 | Willis Eric M. | AMPY | Common Stock, par value $0.01 per share | D | 31,134 | 148,871 | ||||||
| 2024-01-08 | 2024-01-05 | 4 | Lopez Anthony William | AMPY | Common Stock, par value $0.01 per share | D | 5.9300 | -10,244 | -61 | 77,275 | ||||
| 2024-01-08 | 2024-01-05 | 4 | Lopez Anthony William | AMPY | Common Stock, par value $0.01 per share | D | 24,018 | 87,519 | ||||||
| 2023-12-21 | 2023-12-21 | 4 | Dulany Eric Edward | AMPY | Common Stock, par value $0.01 per share | D | 5.9306 | -2,000 | -12 | 11,723 | ||||
| 2023-11-09 | 2023-11-08 | 4 | FREW JAMES | AMPY | Common Stock, par value $0.01 per share | D | 6.0499 | 10,000 | 60 | 10,000 | ||||
| 2023-11-08 | 2023-11-07 | 4 | FURBEE DANIEL | AMPY | Common Stock, par value $0.01 per share | D | 6.0963 | 10,000 | 61 | 10,000 | ||||
| 2023-09-21 | 2023-09-20 | 4 | Adams Deborah G | AMPY | Common Stock, par value $0.01 per share | D | 6.9451 | 10,000 | 69 | 32,884 | ||||
| 2023-09-13 | 2023-09-12 | 4 | Snyder Todd R | AMPY | Common Stock, par value $0.01 per share | D | 7.4400 | 2,679 | 20 | 64,339 | ||||
| 2023-09-12 | 2023-09-11 | 4 | Douglas Patrice D | AMPY | Common Stock, par value $0.01 per share | D | 7.1314 | -7,000 | -50 | 41,218 | ||||
| 2023-08-21 | 2023-08-18 | 4 | Dulany Eric Edward | AMPY | Common Stock, par value $0.01 per share | D | 6.6050 | -3,000 | -20 | 7,643 | ||||
| 2023-07-05 | 2023-07-01 | 4 | Snyder Todd R | AMPY | Common Stock, par value $0.01 per share | D | 17,889 | 61,660 | ||||||
| 2023-07-05 | 2023-07-01 | 4 | Douglas Patrice D | AMPY | Common Stock, par value $0.01 per share | D | 17,889 | 48,218 | ||||||
| 2023-07-05 | 2023-07-01 | 4 | Adams Deborah G | AMPY | Common Stock, par value $0.01 per share | D | 22,884 | 22,884 | ||||||
| 2023-07-05 | 2023-07-01 | 4 | Hamm Christopher W. | AMPY | Common Stock, par value $0.01 per share | D | 25,045 | 140,663 | ||||||
| 2023-07-05 | 2023-07-01 | 4 | Dulany Eric Edward | AMPY | Common Stock, par value $0.01 per share | D | 6.7700 | -3,625 | -25 | 16,723 | ||||
| 2023-07-05 | 2023-07-01 | 4 | Dulany Eric Edward | AMPY | Common Stock, par value $0.01 per share | D | 9,705 | 20,348 | ||||||
| 2023-06-26 | 2023-06-23 | 4 | Dulany Eric Edward | AMPY | Common Stock, par value $0.01 per share | D | 6.4501 | -3,000 | -19 | 10,643 | ||||
| 2023-06-13 | 2023-06-12 | 4 | Willsher Martyn | AMPY | Common Stock, par value $0.01 per share | D | 6.8505 | -26,599 | -182 | 120,438 | ||||
| 2023-03-20 | 2023-03-17 | 4 | Smiley Richard | AMPY | Common Stock, par value $0.01 per share | D | 6.9600 | -18,113 | -126 | 169,869 | ||||
| 2023-03-20 | 2023-03-17 | 4 | Smiley Richard | AMPY | Common Stock, par value $0.01 per share | D | 56,490 | 187,982 | ||||||
| 2023-03-20 | 2023-03-17 | 4 | Smiley Richard | AMPY | Common Stock, par value $0.01 per share | D | 6.9600 | -9,787 | -68 | 131,492 | ||||
| 2023-03-20 | 2023-03-17 | 4 | Smiley Richard | AMPY | Common Stock, par value $0.01 per share | D | 36,468 | 141,279 | ||||||
| 2023-03-20 | 2023-03-16 | 4 | Smiley Richard | AMPY | Common Stock, par value $0.01 per share | D | 6.7600 | -3,027 | -20 | 104,811 | ||||
| 2023-03-20 | 2023-03-16 | 4 | Smiley Richard | AMPY | Common Stock, par value $0.01 per share | D | 12,429 | 107,838 | ||||||
| 2023-03-20 | 2023-03-16 | 4 | Lopez Anthony William | AMPY | Common Stock, par value $0.01 per share | D | 6.7600 | -3,582 | -24 | 63,501 | ||||
| 2023-03-20 | 2023-03-16 | 4 | Lopez Anthony William | AMPY | Common Stock, par value $0.01 per share | D | 9,588 | 67,083 | ||||||
| 2023-03-20 | 2023-03-16 | 4 | Willsher Martyn | AMPY | Common Stock, par value $0.01 per share | D | 6.7600 | -8,152 | -55 | 147,037 | ||||
| 2023-03-20 | 2023-03-16 | 4 | Willsher Martyn | AMPY | Common Stock, par value $0.01 per share | D | 20,715 | 155,189 | ||||||
| 2023-03-20 | 2023-03-17 | 4 | McGlynn Jason William | AMPY | Common Stock, par value $0.01 per share | D | 6.9600 | -2,030 | -14 | 79,987 | ||||
| 2023-03-20 | 2023-03-17 | 4 | McGlynn Jason William | AMPY | Common Stock, par value $0.01 per share | D | 8,334 | 82,017 | ||||||
| 2023-03-20 | 2023-03-16 | 4 | McGlynn Jason William | AMPY | Common Stock, par value $0.01 per share | D | 6.7600 | -2,508 | -17 | 73,683 | ||||
| 2023-03-20 | 2023-03-16 | 4 | McGlynn Jason William | AMPY | Common Stock, par value $0.01 per share | D | 10,298 | 76,191 | ||||||
| 2023-03-20 | 2023-03-16 | 4 | Willis Eric M. | AMPY | Common Stock, par value $0.01 per share | D | 6.7600 | -4,021 | -27 | 117,737 | ||||
| 2023-03-20 | 2023-03-16 | 4 | Willis Eric M. | AMPY | Common Stock, par value $0.01 per share | D | 12,429 | 121,758 | ||||||
| 2023-03-15 | 2023-03-15 | 4 | Hamm Christopher W. | AMPY | Common Stock, par value $0.01 per share | D | 6.6500 | 20,000 | 133 | 115,618 | ||||
| 2023-03-15 | 2023-03-14 | 4 | Hamm Christopher W. | AMPY | Common Stock, par value $0.01 per share | D | 7.1400 | 20,000 | 143 | 95,618 | ||||
| 2023-02-03 | 2023-02-01 | 4 | Willis Eric M. | AMPY | Common Stock, par value $0.01 per share | D | 8.6600 | -3,879 | -34 | 109,329 | ||||
| 2023-02-03 | 2023-02-01 | 4 | Willis Eric M. | AMPY | Common Stock, par value $0.01 per share | D | 12,019 | 113,208 | ||||||
| 2023-02-03 | 2023-02-01 | 4 | Dulany Eric Edward | AMPY | Common Stock, par value $0.01 per share | D | 8.6600 | -4,687 | -41 | 13,643 | ||||
| 2023-02-03 | 2023-02-01 | 4 | Dulany Eric Edward | AMPY | Common Stock, par value $0.01 per share | D | 10,989 | 18,330 | ||||||
| 2023-02-03 | 2023-02-01 | 4 | McGlynn Jason William | AMPY | Common Stock, par value $0.01 per share | D | 8.6600 | -2,386 | -21 | 65,893 | ||||
| 2023-02-03 | 2023-02-01 | 4 | McGlynn Jason William | AMPY | Common Stock, par value $0.01 per share | D | 9,958 | 68,279 | ||||||
| 2023-02-03 | 2023-02-01 | 4 | Willsher Martyn | AMPY | Common Stock, par value $0.01 per share | D | 8.6600 | -7,883 | -68 | 134,474 | ||||
| 2023-02-03 | 2023-02-01 | 4 | Willsher Martyn | AMPY | Common Stock, par value $0.01 per share | D | 20,032 | 142,357 | ||||||
| 2023-02-03 | 2023-02-01 | 4 | Smiley Richard | AMPY | Common Stock, par value $0.01 per share | D | 8.6600 | -2,918 | -25 | 95,409 | ||||
| 2023-02-03 | 2023-02-01 | 4 | Smiley Richard | AMPY | Common Stock, par value $0.01 per share | D | 12,019 | 98,327 | ||||||
| 2023-02-03 | 2023-02-01 | 4 | Lopez Anthony William | AMPY | Common Stock, par value $0.01 per share | D | 8.6600 | -3,484 | -30 | 57,495 | ||||
| 2023-02-03 | 2023-02-01 | 4 | Lopez Anthony William | AMPY | Common Stock, par value $0.01 per share | D | 9,272 | 60,979 | ||||||
| 2023-01-09 | 2023-01-07 | 4 | Lopez Anthony William | AMPY | Common Stock, par value $0.01 per share | D | 8.7900 | -5,415 | -48 | 51,707 | ||||
| 2023-01-09 | 2023-01-07 | 4 | Lopez Anthony William | AMPY | Common Stock, par value $0.01 per share | D | 14,382 | 57,122 | ||||||
| 2023-01-09 | 2023-01-07 | 4 | Willsher Martyn | AMPY | Common Stock, par value $0.01 per share | D | 8.7900 | -13,153 | -116 | 122,325 | ||||
| 2023-01-09 | 2023-01-07 | 4 | Willsher Martyn | AMPY | Common Stock, par value $0.01 per share | D | 31,072 | 135,478 | ||||||
| 2023-01-09 | 2023-01-07 | 4 | Smiley Richard | AMPY | Common Stock, par value $0.01 per share | D | 8.7900 | -5,502 | -48 | 86,308 | ||||
| 2023-01-09 | 2023-01-07 | 4 | Smiley Richard | AMPY | Common Stock, par value $0.01 per share | D | 18,644 | 91,810 | ||||||
| 2023-01-09 | 2023-01-07 | 4 | Willis Eric M. | AMPY | Common Stock, par value $0.01 per share | D | 8.7900 | -6,994 | -61 | 101,189 | ||||
| 2023-01-09 | 2023-01-07 | 4 | Willis Eric M. | AMPY | Common Stock, par value $0.01 per share | D | 18,644 | 108,183 | ||||||
| 2023-01-09 | 2023-01-07 | 4 | McGlynn Jason William | AMPY | Common Stock, par value $0.01 per share | D | 8.7900 | -4,581 | -40 | 58,321 | ||||
| 2023-01-09 | 2023-01-07 | 4 | McGlynn Jason William | AMPY | Common Stock, par value $0.01 per share | D | 15,448 | 62,902 | ||||||
| 2023-01-04 | 2022-12-31 | 4 | Greager Eric T. | AMPY | Common Stock, par value $0.01 per share | D | 11,442 | 11,442 | ||||||
| 2022-12-23 | 2022-12-22 | 4 | Hamm Christopher W. | AMPY | Common Stock, par value $0.01 per share | D | 7.7900 | 9,000 | 70 | 75,618 | ||||
| 2022-12-23 | 2022-12-22 | 4 | Hamm Christopher W. | AMPY | Common Stock, par value $0.01 per share | D | 7.5000 | 8,000 | 60 | 66,618 | ||||
| 2022-07-05 | 2022-07-01 | 4 | Hamm Christopher W. | AMPY | Common Stock, par value $0.01 per share | D | 42,461 | 58,618 | ||||||
| 2022-07-05 | 2022-07-01 | 4 | Douglas Patrice D | AMPY | Common Stock, par value $0.01 per share | D | 30,329 | 30,329 | ||||||
| 2022-07-05 | 2022-07-01 | 4 | Snyder Todd R | AMPY | Common Stock, par value $0.01 per share | D | 30,329 | 43,771 | ||||||
| 2022-07-05 | 2022-07-01 | 4 | Dulany Eric Edward | AMPY | Common Stock, par value $0.01 per share | D | 6.4600 | -2,364 | -15 | 7,341 | ||||
| 2022-07-05 | 2022-07-01 | 4 | Dulany Eric Edward | AMPY | Common Stock, par value $0.01 per share | D | 9,705 | 9,705 | ||||||
| 2022-05-04 | 2022-05-03 | 4 | Hamm Christopher W. | AMPY | Common Stock, par value $0.01 per share | D | 3,333 | 16,157 | ||||||
| 2022-04-04 | 2022-04-01 | 4 | McGlynn Jason William | AMPY | Common Stock, par value $0.01 per share | D | 5.7800 | -2,030 | -12 | 47,454 | ||||
| 2022-04-04 | 2022-04-01 | 4 | McGlynn Jason William | AMPY | Common Stock, par value $0.01 per share | D | 8,333 | 49,484 | ||||||
| 2022-03-17 | 2022-03-16 | 4 | Lopez Anthony William | AMPY | Common Stock, par value $0.01 per share | D | 5.4600 | -2,327 | -13 | 42,740 | ||||
| 2022-03-17 | 2022-03-16 | 4 | Lopez Anthony William | AMPY | Common Stock, par value $0.01 per share | D | 9,588 | 45,067 | ||||||
| 2022-03-17 | 2022-03-16 | 4 | Smiley Richard | AMPY | Common Stock, par value $0.01 per share | D | 5.4600 | -3,027 | -17 | 73,166 | ||||
| 2022-03-17 | 2022-03-16 | 4 | Smiley Richard | AMPY | Common Stock, par value $0.01 per share | D | 12,429 | 76,193 | ||||||
| 2022-03-17 | 2022-03-16 | 4 | McGlynn Jason William | AMPY | Common Stock, par value $0.01 per share | D | 5.4600 | -2,508 | -14 | 41,151 | ||||
| 2022-03-17 | 2022-03-16 | 4 | McGlynn Jason William | AMPY | Common Stock, par value $0.01 per share | D | 10,298 | 43,659 | ||||||
| 2022-03-17 | 2022-03-16 | 4 | Willsher Martyn | AMPY | Common Stock, par value $0.01 per share | D | 5.4600 | -5,045 | -28 | 104,406 | ||||
| 2022-03-17 | 2022-03-16 | 4 | Willsher Martyn | AMPY | Common Stock, par value $0.01 per share | D | 20,715 | 109,451 | ||||||
| 2022-03-17 | 2022-03-16 | 4 | Willis Eric M. | AMPY | Common Stock, par value $0.01 per share | D | 5.4600 | -3,027 | -17 | 89,539 | ||||
| 2022-03-17 | 2022-03-16 | 4 | Willis Eric M. | AMPY | Common Stock, par value $0.01 per share | D | 12,429 | 92,566 | ||||||
| 2022-02-02 | 2022-02-01 | 4 | Lopez Anthony William | AMPY | Restricted Stock Units | D | 27,816 | 105,969 | ||||||
| 2022-02-02 | 2022-02-01 | 4 | Lopez Anthony William | AMPY | Restricted Stock Units | D | 27,816 | 105,969 | ||||||
| 2022-02-02 | 2022-02-01 | 4 | Lopez Anthony William | AMPY | Common Stock, par value $0.01 per share | D | 3.1100 | -2,133 | -7 | 35,479 | ||||
| 2022-02-02 | 2022-02-01 | 4 | Lopez Anthony William | AMPY | Common Stock, par value $0.01 per share | D | 7,191 | 37,612 | ||||||
| 2022-02-02 | 2021-04-01 | 4 | Lopez Anthony William | AMPY | Restricted Stock Units | D | 28,764 | 50,337 | ||||||
| 2022-02-02 | 2021-04-01 | 4 | Lopez Anthony William | AMPY | Restricted Stock Units | D | 21,573 | 21,573 | ||||||
| 2022-02-02 | 2022-02-01 | 4 | Smiley Richard | AMPY | Restricted Sock Units | D | 36,058 | 137,368 | ||||||
| 2022-02-02 | 2022-02-01 | 4 | Smiley Richard | AMPY | Restricted Stock Units | D | 36,058 | 137,368 | ||||||
| 2022-02-02 | 2022-02-01 | 4 | Smiley Richard | AMPY | Restricted Stock Units | D | -9,322 | 65,252 | ||||||
| 2022-02-02 | 2022-02-01 | 4 | Smiley Richard | AMPY | Common Stock, par value $0.01 per share | D | 3.1100 | -2,764 | -9 | 63,764 | ||||
| 2022-02-02 | 2022-02-01 | 4 | Smiley Richard | AMPY | Common Stock, par value $0.01 per share | D | 9,322 | 66,528 | ||||||
| 2022-02-02 | 2022-02-01 | 4 | McGlynn Jason William | AMPY | Restricted Stock Units | D | 29,876 | 155,485 | ||||||
| 2022-02-02 | 2022-02-01 | 4 | McGlynn Jason William | AMPY | Restricted Stock Units | D | 29,876 | 155,485 | ||||||
| 2022-02-02 | 2022-02-01 | 4 | McGlynn Jason William | AMPY | Common Stock, par value $0.01 per share | D | 3.1100 | -2,291 | -7 | 33,361 | ||||
| 2022-02-02 | 2022-02-01 | 4 | McGlynn Jason William | AMPY | Common Stock, par value $0.01 per share | D | 7,724 | 35,652 | ||||||
| 2022-02-02 | 2021-04-01 | 4 | McGlynn Jason William | AMPY | Restricted Stock Units | D | 30,895 | 54,066 | ||||||
| 2022-02-02 | 2021-04-01 | 4 | McGlynn Jason William | AMPY | Restricted Stock Units | D | 23,171 | 23,171 | ||||||
| 2022-02-02 | 2020-01-19 | 4 | McGlynn Jason William | AMPY | Restricted Stock Units | D | 41,667 | 95,733 | ||||||
| 2022-02-02 | 2022-02-01 | 4 | Willsher Martyn | AMPY | Restricted Stock Units | D | 60,096 | 228,946 | ||||||
| 2022-02-02 | 2022-02-01 | 4 | Willsher Martyn | AMPY | Restricted Stock Units | D | 60,096 | 228,946 | ||||||
| 2022-02-02 | 2022-02-01 | 4 | Willsher Martyn | AMPY | Restricted Stock Units | D | -15,536 | 108,754 | ||||||
| 2022-02-02 | 2022-02-01 | 4 | Willsher Martyn | AMPY | Common Stock, par value $0.01 per share | D | 3.1100 | -4,607 | -14 | 88,736 | ||||
| 2022-02-02 | 2022-02-01 | 4 | Willsher Martyn | AMPY | Common Stock, par value $0.01 per share | D | 15,536 | 93,343 | ||||||
| 2022-02-02 | 2022-02-01 | 4 | Willis Eric M. | AMPY | Restricted Stock Units | D | 36,058 | 137,368 | ||||||
| 2022-02-02 | 2022-02-01 | 4 | Willis Eric M. | AMPY | Restricted Stock Units | D | 36,058 | 137,368 | ||||||
| 2022-02-02 | 2022-02-01 | 4 | Willis Eric M. | AMPY | Restricted Stock Units | D | -9,322 | 65,252 | ||||||
| 2022-02-02 | 2022-02-01 | 4 | Willis Eric M. | AMPY | Common Stock, par value $0.01 per share | D | 3.1100 | -2,764 | -9 | 80,137 | ||||
| 2022-02-02 | 2022-02-01 | 4 | Willis Eric M. | AMPY | Common Stock, par value $0.01 per share | D | 9,322 | 82,901 | ||||||
| 2022-02-02 | 2022-02-01 | 4 | Dulany Eric Edward | AMPY | Restricted Stock Units | D | 32,967 | 62,083 | ||||||
| 2022-02-02 | 2021-07-01 | 4 | Dulany Eric Edward | AMPY | Restricted Stock Units | D | 29,116 | 29,116 | ||||||
| 2021-10-05 | 2021-10-01 | 4 | Smiley Richard | AMPY | Common Stock, par value $0.01 per share | D | 2,352 | 57,206 | ||||||
| 2021-10-05 | 2021-04-01 | 4 | Smiley Richard | AMPY | Restricted Stock Units | D | 37,287 | 74,574 | ||||||
| 2021-10-05 | 2021-04-01 | 4 | Smiley Richard | AMPY | Restricted Stock Units | D | 37,287 | 74,574 | ||||||
| 2021-10-05 | 2021-10-01 | 4 | Willsher Martyn | AMPY | Common Stock, par value $0.01 per share | D | 3,529 | 77,807 | ||||||
| 2021-10-05 | 2021-04-01 | 4 | Willsher Martyn | AMPY | Restricted Stock Units | D | 62,145 | 124,290 | ||||||
| 2021-10-05 | 2021-04-01 | 4 | Willsher Martyn | AMPY | Restricted Stock Units | D | 62,145 | 62,145 | ||||||
| 2021-10-05 | 2021-10-01 | 4 | Willis Eric M. | AMPY | Common Stock, par value $0.01 per share | D | 2,352 | 73,579 | ||||||
| 2021-10-05 | 2021-04-01 | 4 | Willis Eric M. | AMPY | Restricted Stock Units | D | 37,287 | 74,574 | ||||||
| 2021-10-05 | 2021-04-01 | 4 | Willis Eric M. | AMPY | Restricted Stock Units | D | 37,287 | 74,574 | ||||||
| 2021-08-31 | 2021-08-30 | 4 | Lederman Evan S. | AMPY | Common Stock, par value $0.01 per share | D | 3.6900 | 10,000 | 37 | 40,329 | ||||
| 2021-08-24 | 2021-08-20 | 4 | Proman David | AMPY | Common Stock, par value $0.01 per share | D | 3.3586 | 15,000 | 50 | 45,329 | ||||
| 2021-08-10 | 2021-08-09 | 4 | Smiley Richard | AMPY | Common Stock, par value $0.01 per share | D | 3.6900 | -30,000 | -111 | 129,428 | ||||
| 2021-07-06 | 2021-07-01 | 4 | Proman David | AMPY | Common Stock, par value $0.01 per share | D | 30,329 | 30,329 | ||||||
| 2021-07-06 | 2021-07-01 | 4 | Dulany Eric Edward | AMPY | Common Stock, par value $0.01 per share | D | 29,116 | 29,116 | ||||||
| 2021-07-06 | 2021-07-01 | 4 | Lederman Evan S. | AMPY | Common Stock, par value $0.01 per share | D | 30,329 | 30,329 | ||||||
| 2021-07-06 | 2021-07-01 | 4 | Douglas Patrice D | AMPY | Common Stock, par value $0.01 per share | D | 30,329 | 30,329 | ||||||
| 2021-07-06 | 2021-07-01 | 4 | Hamm Christopher W. | AMPY | Common Stock, par value $0.01 per share | D | 42,461 | 55,285 | ||||||
| 2021-07-06 | 2021-07-01 | 4 | Lopez Anthony William | AMPY | Common Stock, par value $0.01 per share | D | 5,881 | 87,949 | ||||||
| 2021-07-06 | 2021-07-01 | 4 | Snyder Todd R | AMPY | Common Stock, par value $0.01 per share | D | 30,329 | 43,771 | ||||||
| 2021-07-06 | 2020-12-14 | 4 | Snyder Todd R | AMPY | Common Stock, par value $0.01 per share | D | 1.1600 | -25,000 | -29 | 13,442 | ||||
| 2021-05-04 | 2021-04-30 | 4 | Smiley Richard | AMPY | Common Stock, par value $0.01 per share | D | 2,352 | 159,428 | ||||||
| 2021-05-04 | 2021-05-04 | 4 | Hamm Christopher W. | AMPY | Common Stock, par value $0.01 per share | D | 2,233 | 12,824 | ||||||
| 2021-05-04 | 2021-05-03 | 4 | Hamm Christopher W. | AMPY | Common Stock, par value $0.01 per share | D | 3,332 | 10,591 | ||||||
| 2021-05-04 | 2021-04-30 | 4 | Willsher Martyn | AMPY | Common Stock, par value $0.01 per share | D | 2,706 | 198,568 | ||||||
| 2021-04-05 | 2021-04-01 | 4 | McGlynn Jason William | AMPY | Common Stock, par value $0.01 per share | D | 61,790 | 89,718 | ||||||
| 2021-04-05 | 2021-04-01 | 4 | DuBard Denise | AMPY | Common Stock, par value $0.01 per share | D | 34,091 | 49,334 | ||||||
| 2021-04-05 | 2021-04-01 | 4 | Lopez Anthony William | AMPY | Common Stock, par value $0.01 per share | D | 57,528 | 82,068 | ||||||
| 2021-04-05 | 2021-04-01 | 4 | Willis Eric M. | AMPY | Common Stock, par value $0.01 per share | D | 74,574 | 145,801 | ||||||
| 2021-04-05 | 2021-04-01 | 4 | Smiley Richard | AMPY | Common Stock, par value $0.01 per share | D | 74,574 | 157,076 | ||||||
| 2021-04-05 | 2021-04-01 | 4 | Willsher Martyn | AMPY | Common Stock, par value $0.01 per share | D | 124,290 | 195,862 | ||||||
| 2021-03-15 | 2021-03-12 | 4 | DuBard Denise | AMPY | Common Stock, par value $0.01 per share | D | 3.4030 | -13,284 | -45 | 15,243 | ||||
| 2021-03-15 | 2021-03-15 | 4 | Lopez Anthony William | AMPY | Common Stock, par value $0.01 per share | D | 3.4107 | -18,000 | -61 | 24,540 | ||||
| 2021-02-22 | 2020-05-04 | 4 | Hamm Christopher W. | AMPY | Common Stock, par value $0.01 per share | D | 1,695 | 7,259 | ||||||
| 2021-02-22 | 2020-05-04 | 4 | Hamm Christopher W. | AMPY | Common Stock, par value $0.01 per share | D | 2,232 | 5,564 | ||||||
| 2021-02-22 | 2020-05-03 | 4 | Hamm Christopher W. | AMPY | Common Stock, par value $0.01 per share | D | 3,332 | 3,332 | ||||||
| 2021-02-22 | 2021-02-19 | 4 | McGlynn Jason William | AMPY | Common Stock, par value $0.01 per share | D | 21,550 | 21,550 | ||||||
| 2021-02-22 | 2021-02-19 | 4 | Willis Eric M. | AMPY | Common Stock, par value $0.01 per share | D | 29,236 | 71,227 | ||||||
| 2021-02-22 | 2021-02-19 | 4 | Smiley Richard | AMPY | Common Stock, par value $0.01 per share | D | 36,609 | 82,502 | ||||||
| 2021-02-22 | 2021-02-19 | 4 | Willsher Martyn | AMPY | Common Stock, par value $0.01 per share | D | 47,090 | 71,572 | ||||||
| 2021-02-22 | 2021-02-19 | 4 | Lopez Anthony William | AMPY | Common Stock, par value $0.01 per share | D | 23,779 | 42,540 | ||||||
| 2021-02-22 | 2021-02-19 | 4 | DuBard Denise | AMPY | Common Stock, par value $0.01 per share | D | 15,243 | 28,527 | ||||||
| 2021-01-27 | 3 | McGlynn Jason William | AMPY | Common Stock | D | 50,000 | ||||||||
| 2021-01-22 | 2020-10-01 | 4 | Smiley Richard | AMPY | Common Stock, par value $0.01 per share | D | 2,352 | 45,893 | ||||||
| 2021-01-22 | 2020-05-04 | 4 | Smiley Richard | AMPY | Common Stock, par value $0.01 per share | D | 6,729 | 43,541 | ||||||
| 2021-01-22 | 2020-05-01 | 4 | Smiley Richard | AMPY | Common Stock, par value $0.01 per share | D | 2,352 | 36,812 | ||||||
| 2021-01-22 | 2019-10-01 | 4 | Smiley Richard | AMPY | Common Stock, par value $0.01 per share | D | 2,352 | 34,460 | ||||||
| 2021-01-22 | 2020-07-01 | 4 | Lopez Anthony William | AMPY | Common Stock, par value $0.01 per share | D | 6,178 | 18,761 | ||||||
| 2021-01-22 | 2020-04-01 | 4 | Lopez Anthony William | AMPY | Restricted Stock Units | D | 23,325 | 23,325 | ||||||
| 2021-01-22 | 2020-04-01 | 4 | Lopez Anthony William | AMPY | Restricted Stock Units | D | 15,550 | 15,550 | ||||||
| 2021-01-22 | 2020-12-01 | 4 | Willis Eric M. | AMPY | Common Stock, par value $0.01 per share | D | 7,058 | 41,991 | ||||||
| 2021-01-22 | 2020-10-01 | 4 | Willis Eric M. | AMPY | Common Stock, par value $0.01 per share | D | 2,352 | 34,933 | ||||||
| 2021-01-22 | 2019-12-01 | 4 | Willis Eric M. | AMPY | Common Stock, par value $0.01 per share | D | 7,058 | 32,581 | ||||||
| 2021-01-22 | 2019-10-01 | 4 | Willis Eric M. | AMPY | Common Stock, par value $0.01 per share | D | 2,352 | 25,523 | ||||||
| 2021-01-22 | 2020-10-01 | 4 | Willsher Martyn | AMPY | Common Stock, par value $0.01 per share | D | 3,529 | 24,482 | ||||||
| 2021-01-22 | 2020-05-04 | 4 | Willsher Martyn | AMPY | Common Stock, par value $0.01 per share | D | 4,352 | 20,953 | ||||||
| 2021-01-22 | 2020-05-01 | 4 | Willsher Martyn | AMPY | Common Stock, par value $0.01 per share | D | 2,705 | 16,601 | ||||||
| 2021-01-22 | 2019-10-01 | 4 | Willsher Martyn | AMPY | Common Stock, par value $0.01 per share | D | 3,529 | 13,896 | ||||||
| 2021-01-22 | 2020-08-01 | 4 | DuBard Denise | AMPY | Common Stock, par value $0.01 per share | D | 2,941 | 13,284 | ||||||
| 2020-12-14 | 2020-12-11 | 4 | FIR TREE INC. See footnotes | AMPY | Common Stock, $0.01 par value per share ("Common Stock") | I | 1.0925 | -8,548,485 | -9,339 | 0 | ||||
| 2020-12-03 | 2020-12-02 | 4 | FIR TREE INC. See footnotes | AMPY | Common Stock | I | 1.0510 | -16,916 | -18 | 8,548,485 | ||||
| 2020-12-03 | 2020-12-01 | 4 | FIR TREE INC. See footnotes | AMPY | Common Stock, $0.01 par value per share ("Common Stock") | I | 1.0457 | -50,134 | -52 | 8,565,401 | ||||
| 2020-12-01 | 2020-11-30 | 4 | FIR TREE INC. See footnotes | AMPY | Common Stock | I | 0.9998 | -78,897 | -79 | 8,615,535 | ||||
| 2020-12-01 | 2020-11-27 | 4 | FIR TREE INC. See footnotes | AMPY | Common Stock, $0.01 par value per share ("Common Stock") | I | 1.1030 | -38,887 | -43 | 8,694,432 | ||||
| 2020-11-27 | 2020-11-25 | 4 | FIR TREE INC. See footnotes | AMPY | Common Stock | I | 1.0895 | -178,794 | -195 | 8,733,319 | ||||
| 2020-11-27 | 2020-11-24 | 4 | FIR TREE INC. See footnotes | AMPY | Common Stock, $0.01 par value per share ("Common Stock") | I | 1.0602 | -271,908 | -288 | 8,912,113 | ||||
| 2020-11-24 | 2020-11-23 | 4 | FIR TREE INC. See footnotes | AMPY | Common Stock | I | 0.9158 | -116,051 | -106 | 9,184,021 | ||||
| 2020-11-24 | 2020-11-20 | 4 | FIR TREE INC. See footnotes | AMPY | Common Stock, $0.01 par value per share ("Common Stock") | I | 0.9039 | -12,527 | -11 | 9,300,072 | ||||
| 2020-11-20 | 2020-11-19 | 4 | FIR TREE INC. See footnotes | AMPY | Common Stock | I | 0.9144 | -66,031 | -60 | 9,312,599 | ||||
| 2020-11-20 | 2020-11-18 | 4 | FIR TREE INC. See footnotes | AMPY | Common Stock, $0.01 par value per share ("Common Stock") | I | 0.9491 | -157,193 | -149 | 9,378,630 | ||||
| 2020-10-14 | 2020-10-09 | 4 | FIR TREE INC. See footnotes | AMPY | Common Stock, $0.01 par value per share ("Common Stock") | I | 0.9164 | -50,027 | -46 | 9,535,823 | ||||
| 2020-10-01 | 2020-09-30 | 4 | FIR TREE INC. See footnotes | AMPY | Common Stock | I | 0.9049 | -19,389 | -18 | 9,585,850 | ||||
| 2020-10-01 | 2020-09-29 | 4 | FIR TREE INC. See footnotes | AMPY | Common Stock, $0.01 par value per share ("Common Stock") | I | 0.9743 | -441,883 | -431 | 9,605,239 | ||||
| 2020-09-22 | 2020-09-18 | 4 | FIR TREE INC. See footnotes | AMPY | Common Stock, $0.01 par value per share ("Common Stock") | I | 0.9032 | -7,751 | -7 | 10,047,122 | ||||
| 2020-09-18 | 2020-09-17 | 4 | FIR TREE INC. See footnotes | AMPY | Common Stock | I | 0.9115 | 39,591 | 36 | |||||
| 2020-09-18 | 2020-09-16 | 4 | FIR TREE INC. See footnotes | AMPY | Common Stock, $0.01 par value per share ("Common Stock") | I | 0.9187 | 93,826 | 86 | 10,094,464 | ||||
| 2020-08-13 | 2020-08-12 | 4 | FIR TREE INC. | AMPY | Common Stock | I | 1.2324 | -29,800 | -37 | 10,188,290 | ||||
| 2020-08-13 | 2020-08-11 | 4 | FIR TREE INC. | AMPY | Common Stock, $0.01 par value per share ("Common Stock") | I | 1.2840 | -38,813 | -50 | 10,218,090 | ||||
| 2020-08-10 | 2020-08-07 | 4 | FIR TREE INC. | AMPY | Common Stock, $0.01 par value per share ("Common Stock" | I | 1.2338 | -74,950 | -92 | 10,256,903 | ||||
| 2020-08-10 | 2020-08-06 | 4 | FIR TREE INC. | AMPY | Common Stock, $0.01 par value per share ("Common Stock") | I | 1.2673 | -83,444 | -106 | 10,331,853 | ||||
| 2020-06-30 | 2020-06-26 | 4 | BRIGADE CAPITAL MANAGEMENT, LP | AMPY | Common Stock, $0.01 par value | I | 1.2900 | -25,000 | -32 | 3,748,088 | ||||
| 2020-06-23 | 2020-06-22 | 4 | BRIGADE CAPITAL MANAGEMENT, LP | AMPY | Common Stock, $0.01 par value | I | 1.5600 | -15,000 | -23 | 3,773,088 | ||||
| 2020-06-23 | 2020-06-19 | 4 | BRIGADE CAPITAL MANAGEMENT, LP | AMPY | Common Stock, $0.01 par value | I | 1.6400 | -15,000 | -25 | 3,788,088 | ||||
| 2020-06-19 | 2020-06-17 | 4 | BRIGADE CAPITAL MANAGEMENT, LP | AMPY | Common Stock, $0.01 par value | I | 1.6300 | -16,162 | -26 | 3,803,088 | ||||
| 2020-06-17 | 2020-06-16 | 4 | BRIGADE CAPITAL MANAGEMENT, LP | AMPY | Common Stock, $0.01 par value | I | 1.8200 | -5,411 | -10 | 3,819,250 | ||||
| 2020-06-17 | 2020-06-16 | 4 | BRIGADE CAPITAL MANAGEMENT, LP | AMPY | Common Stock, $0.01 par value | I | 1.8200 | -16,500 | -30 | 3,824,661 | ||||
| 2020-06-17 | 2020-06-15 | 4 | BRIGADE CAPITAL MANAGEMENT, LP | AMPY | Common Stock, $0.01 par value | I | 1.7600 | -12,132 | -21 | 3,841,161 | ||||
| 2020-06-17 | 2020-06-15 | 4 | BRIGADE CAPITAL MANAGEMENT, LP | AMPY | Common Stock, $0.01 par value | I | 1.8700 | -19,913 | -37 | 3,853,293 | ||||
| 2020-06-17 | 2020-06-15 | 4 | BRIGADE CAPITAL MANAGEMENT, LP | AMPY | Common Stock, $0.01 par value | I | 1.8300 | -15,000 | -27 | 3,873,206 | ||||
| 2020-06-12 | 2020-06-10 | 4 | BRIGADE CAPITAL MANAGEMENT, LP | AMPY | Common Stock, $0.01 par value | I | 2.0300 | -80,117 | -163 | 3,888,206 | ||||
| 2020-04-08 | 3 | Lopez Anthony William | AMPY | Common Stock, par value $0.01 per share | D | 25,166 | ||||||||
| 2020-04-08 | 3 | Lopez Anthony William | AMPY | Common Stock, par value $0.01 per share | D | 25,166 | ||||||||
| 2020-04-08 | 3 | Lopez Anthony William | AMPY | Common Stock, par value $0.01 per share | D | 25,166 | ||||||||
| 2020-03-16 | 2020-03-12 | 4 | BRIGADE CAPITAL MANAGEMENT, LP | AMPY | Common Stock, $0.01 par value | I | 1.0800 | -43,112 | -47 | 3,968,323 | ||||
| 2019-12-18 | 2019-12-17 | 4 | Hamm Christopher W. | AMPY | Common Stock, par value $0.01 per share | D | 6.8250 | -1,304 | -9 | 0 | ||||
| 2019-11-26 | 2019-11-22 | 4 | BRIGADE CAPITAL MANAGEMENT, LP | AMPY | Common Stock, $0.01 par value | I | 5.3700 | -500,000 | -2,685 | 4,011,435 | ||||
| 2019-11-26 | 2019-11-22 | 4 | FIR TREE INC. | AMPY | Common Stock, $0.01 par value per share ("Common Stock") | I | 5.3700 | -496,817 | -2,668 | 10,415,297 | ||||
| 2019-11-12 | 2019-11-11 | 4 | BRIGADE CAPITAL MANAGEMENT, LP | AMPY | Common Stock, $0.01 par value | I | 6.5700 | -5,000 | -33 | 4,511,435 | ||||
| 2019-11-12 | 2019-11-11 | 4 | BRIGADE CAPITAL MANAGEMENT, LP | AMPY | Common Stock, $0.01 par value | I | 6.6100 | -5,000 | -33 | 4,516,435 | ||||
| 2019-11-12 | 2019-11-08 | 4 | BRIGADE CAPITAL MANAGEMENT, LP | AMPY | Common Stock, $0.01 par value | I | 6.5400 | -15,000 | -98 | 4,521,435 | ||||
| 2019-11-12 | 2019-11-08 | 4 | BRIGADE CAPITAL MANAGEMENT, LP | AMPY | Common Stock, $0.01 par value | I | 6.6000 | -10,276 | -68 | 4,536,435 | ||||
| 2019-09-24 | 2019-09-23 | 4 | Hamm Christopher W. | AMPY | Common Stock, par value $0.01 per share | D | 6.6137 | -4,316 | -29 | 1,304 | ||||
| 2019-08-16 | 3 | MORGAN DONALD E III | AMPY | Common Stock, $0.01 par value | I | 9,093,422 | ||||||||
| 2019-08-16 | 3 | MORGAN DONALD E III | AMPY | Common Stock, $0.01 par value | I | 9,093,422 | ||||||||
| 2019-08-16 | 3 | MORGAN DONALD E III | AMPY | Common Stock, $0.01 par value | I | 9,093,422 | ||||||||
| 2019-08-16 | 3 | MORGAN DONALD E III | AMPY | Common Stock, $0.01 par value | I | 9,093,422 | ||||||||
| 2019-08-16 | 3 | MORGAN DONALD E III | AMPY | Common Stock, $0.01 par value | I | 9,093,422 | ||||||||
| 2019-08-14 | 2019-08-06 | 4/A | DuBard Denise | AMPY | Restricted Stock Units | D | 11,663 | 11,663 | ||||||
| 2019-08-14 | 2019-08-06 | 4/A | DuBard Denise | AMPY | Restricted Stock Units | D | 7,776 | 7,776 | ||||||
| 2019-08-14 | 2019-08-06 | 4/A | DuBard Denise | AMPY | Common Stock, par value $0.01 per share | D | 10,343 | 10,343 | ||||||
| 2019-08-13 | 2019-08-06 | 4 | FIR TREE INC. | AMPY | Common Stock, $0.01 par value per share ("Common Stock") | I | 6,226,714 | 10,912,114 | ||||||
| 2019-08-07 | 2019-08-06 | 4 | Sambrooks David J. | AMPY | Performance Stock Units | D | -135,778 | 0 | ||||||
| 2019-08-07 | 2019-08-06 | 4 | Sambrooks David J. | AMPY | Common Stock | D | 10.0000 | -12,084 | -121 | 160,625 | ||||
| 2019-08-07 | 2019-08-06 | 4 | Sambrooks David J. | AMPY | Common Stock | D | 4.3600 | -62,220 | -271 | 172,709 | ||||
| 2019-08-07 | 2019-08-06 | 4 | Sambrooks David J. | AMPY | Common Stock | D | 135,778 | 234,929 | ||||||
| 2019-08-07 | 2019-08-06 | 4 | Harding Amelia Kim | AMPY | Performance Stock Units | D | -20,010 | 0 | ||||||
| 2019-08-07 | 2019-08-06 | 4 | Harding Amelia Kim | AMPY | Common Stock | D | 10.0000 | -6,877 | -69 | 48,209 | ||||
| 2019-08-07 | 2019-08-06 | 4 | Harding Amelia Kim | AMPY | Common Stock | D | 4.3600 | -17,081 | -74 | 55,086 | ||||
| 2019-08-07 | 2019-08-06 | 4 | Harding Amelia Kim | AMPY | Common Stock | D | 20,010 | 72,167 | ||||||
| 2019-08-07 | 2019-08-06 | 4 | McCullough Richard Wayne | AMPY | Performance Stock Units | D | -19,074 | 0 | ||||||
| 2019-08-07 | 2019-08-06 | 4 | McCullough Richard Wayne | AMPY | Common Stock | D | 10.0000 | -10,988 | -110 | 32,356 | ||||
| 2019-08-07 | 2019-08-06 | 4 | McCullough Richard Wayne | AMPY | Common Stock | D | 4.3600 | -14,620 | -64 | 43,344 | ||||
| 2019-08-07 | 2019-08-06 | 4 | McCullough Richard Wayne | AMPY | Common Stock | D | 19,074 | 57,964 | ||||||
| 2019-08-07 | 2019-08-06 | 4 | Douglas Patrice D | AMPY | Restricted Stock Units | D | -34,994 | 0 | ||||||
| 2019-08-07 | 2019-08-06 | 4 | Douglas Patrice D | AMPY | Performance Stock Units | D | -12,716 | 0 | ||||||
| 2019-08-07 | 2019-08-06 | 4 | Douglas Patrice D | AMPY | Common Stock | D | 10.0000 | -9,341 | -93 | 38,442 | ||||
| 2019-08-07 | 2019-08-06 | 4 | Douglas Patrice D | AMPY | Common Stock | D | 34,994 | 47,783 | ||||||
| 2019-08-07 | 2019-08-06 | 4 | Douglas Patrice D | AMPY | Common Stock | D | 12,716 | 12,789 | ||||||
| 2019-08-07 | 2019-08-06 | 4 | Snyder Todd R | AMPY | Restricted Stock Units | D | -34,994 | 0 | ||||||
| 2019-08-07 | 2019-08-06 | 4 | Snyder Todd R | AMPY | Performance Stock Units | D | -12,716 | 0 | ||||||
| 2019-08-07 | 2019-08-06 | 4 | Snyder Todd R | AMPY | Common Stock | D | 10.0000 | -9,341 | -93 | 38,442 | ||||
| 2019-08-07 | 2019-08-06 | 4 | Snyder Todd R | AMPY | Common Stock | D | 34,994 | 47,783 | ||||||
| 2019-08-07 | 2019-08-06 | 4 | Snyder Todd R | AMPY | Common Stock | D | 12,716 | 12,789 | ||||||
| 2019-08-07 | 2019-08-06 | 4 | GOLDMAN NEAL P | AMPY | Restricted Stock Units | D | -34,994 | 0 | ||||||
| 2019-08-07 | 2019-08-06 | 4 | GOLDMAN NEAL P | AMPY | Performance Stock Units | D | -12,716 | 0 | ||||||
| 2019-08-07 | 2019-08-06 | 4 | GOLDMAN NEAL P | AMPY | Common Stock | D | 10.0000 | -9,341 | -93 | 38,442 | ||||
| 2019-08-07 | 2019-08-06 | 4 | GOLDMAN NEAL P | AMPY | Common Stock | D | 34,994 | 47,783 | ||||||
| 2019-08-07 | 2019-08-06 | 4 | GOLDMAN NEAL P | AMPY | Common Stock | D | 12,716 | 12,789 | ||||||
| 2019-08-07 | 2019-08-06 | 4 | Weatherholt Scott C | AMPY | Performance Stock Units | D | -42,916 | 0 | ||||||
| 2019-08-07 | 2019-08-06 | 4 | Weatherholt Scott C | AMPY | Common Stock | D | 10.0000 | -9,327 | -93 | 77,232 | ||||
| 2019-08-07 | 2019-08-06 | 4 | Weatherholt Scott C | AMPY | Common Stock | D | 4.3600 | -28,310 | -123 | 86,559 | ||||
| 2019-08-07 | 2019-08-06 | 4 | Weatherholt Scott C | AMPY | Common Stock | D | 42,916 | 114,869 | ||||||
| 2019-08-07 | 2019-08-06 | 4 | Carr Alan Jeffrey | AMPY | Restricted Stock Units | D | -52,491 | 0 | ||||||
| 2019-08-07 | 2019-08-06 | 4 | Carr Alan Jeffrey | AMPY | Performance Stock Units | D | -12,716 | 0 | ||||||
| 2019-08-07 | 2019-08-06 | 4 | Carr Alan Jeffrey | AMPY | Common Stock | D | 10.0000 | -14,013 | -140 | 51,294 | ||||
| 2019-08-07 | 2019-08-06 | 4 | Carr Alan Jeffrey | AMPY | Common Stock | D | 52,491 | 65,307 | ||||||
| 2019-08-07 | 2019-08-06 | 4 | Carr Alan Jeffrey | AMPY | Common Stock | D | 12,716 | 12,816 | ||||||
| 2019-08-06 | 2019-08-06 | 4 | Smiley Richard | AMPY | Restricted Stock Units | D | 9,330 | 9,330 | ||||||
| 2019-08-06 | 2019-08-06 | 4 | Smiley Richard | AMPY | Restricted Stock Units | D | 24,446 | 24,446 | ||||||
| 2019-08-06 | 2019-08-06 | 4 | Smiley Richard | AMPY | Stock Option (Right to Buy) | D | 8,895 | 8,895 | ||||||
| 2019-08-06 | 2019-08-06 | 4 | Smiley Richard | AMPY | Common Stock, par value $0.01 per share | D | 32,108 | 32,108 | ||||||
| 2019-08-06 | 2019-08-06 | 4 | Willsher Martyn | AMPY | Restricted Stock Units | D | 13,995 | 13,995 | ||||||
| 2019-08-06 | 2019-08-06 | 4 | Willsher Martyn | AMPY | Restricted Stock Units | D | 26,903 | 26,903 | ||||||
| 2019-08-06 | 2019-08-06 | 4 | Willsher Martyn | AMPY | Stock Option (Right to Buy) | D | 5,753 | 5,753 | ||||||
| 2019-08-06 | 2019-08-06 | 4 | Willsher Martyn | AMPY | Common Stock, par value $0.01 per share | D | 10,367 | 10,367 | ||||||
| 2019-08-06 | 2019-08-06 | 4 | DuBard Denise | AMPY | Restricted Stock Units | D | 1.0000 | 11,663 | 12 | 11,663 | ||||
| 2019-08-06 | 2019-08-06 | 4 | DuBard Denise | AMPY | Restricted Stock Units | D | 1.0000 | 7,776 | 8 | 7,776 | ||||
| 2019-08-06 | 2019-08-06 | 4 | DuBard Denise | AMPY | Common Stock, par value $0.01 per share | D | 10,356 | 10,356 | ||||||
| 2019-08-06 | 2019-08-06 | 4 | Schott Polly | AMPY | Restricted Stock Units | D | 37,320 | 37,320 | ||||||
| 2019-08-06 | 2019-08-06 | 4 | Schott Polly | AMPY | Restricted Stock Units | D | 24,881 | 24,881 | ||||||
| 2019-08-06 | 2019-08-06 | 4 | Schott Polly | AMPY | Common Stock, par value $0.01 per share | D | 22,334 | 22,334 | ||||||
| 2019-08-06 | 2019-08-06 | 4 | Hamm Christopher W. | AMPY | Restricted Stock Units | D | 16,155 | 16,155 | ||||||
| 2019-08-06 | 2019-08-06 | 4 | Hamm Christopher W. | AMPY | Common Stock, par value $0.01 per share | D | 5,620 | 5,620 | ||||||
| 2019-08-06 | 2019-08-06 | 4 | Willis Eric M. | AMPY | Restricted Stock Units | D | 9,330 | 9,330 | ||||||
| 2019-08-06 | 2019-08-06 | 4 | Willis Eric M. | AMPY | Restricted Stock Units | D | 27,990 | 27,990 | ||||||
| 2019-08-06 | 2019-08-06 | 4 | Willis Eric M. | AMPY | Common Stock, par value $0.01 per share | D | 23,171 | 23,171 | ||||||
| 2019-08-06 | 2019-08-06 | 4 | MARIANI KENNETH | AMPY | Restricted Stock Units | D | 116,625 | 116,625 | ||||||
| 2019-08-06 | 2019-08-06 | 4 | MARIANI KENNETH | AMPY | Restricted Stock Units | D | 77,751 | 77,751 | ||||||
| 2019-08-06 | 2019-08-06 | 4 | MARIANI KENNETH | AMPY | Common Stock, par value $0.01 per share | D | 55,034 | 55,034 | ||||||
| 2019-08-06 | 2019-08-06 | 4 | Dunn David M | AMPY | Restricted Stock Units | D | 14,461 | 14,461 | ||||||
| 2019-08-06 | 2019-08-06 | 4 | Dunn David M | AMPY | Common Stock, par value $0.01 per share | D | 2,232 | 2,232 | ||||||
| 2019-03-11 | 2019-03-07 | 4 | Harding Amelia Kim | MPO | Performance Stock Units | D | 29,024 | 29,024 | ||||||
| 2019-03-11 | 2019-03-07 | 4 | Harding Amelia Kim | MPO | Common Stock | D | 12,439 | 52,157 | ||||||
| 2019-03-11 | 2019-03-07 | 4 | Weatherholt Scott C | MPO | Performance Stock Units | D | 43,428 | 43,428 | ||||||
| 2019-03-11 | 2019-03-07 | 4 | Weatherholt Scott C | MPO | Common Stock | D | 18,612 | 71,953 | ||||||
| 2019-03-11 | 2019-03-07 | 4 | Sambrooks David J. | MPO | Performance Stock Units | D | 72,236 | 72,236 | ||||||
| 2019-03-11 | 2019-03-07 | 4 | Sambrooks David J. | MPO | Common Stock | D | 30,959 | 99,151 | ||||||
| 2019-03-11 | 2019-03-07 | 4 | McCullough Richard Wayne | MPO | Performance Stock Units | D | 20,209 | 20,209 | ||||||
| 2019-03-11 | 2019-03-07 | 4 | McCullough Richard Wayne | MPO | Common Stock | D | 8,661 | 38,890 | ||||||
| 2019-02-25 | 2019-02-13 | 4/A | Avenue Capital Management II, L.P. See footnotes | MPO | Common Stock | I | 10.0000 | -933,539 | -9,335 | 2,561,375 | ||||
| 2019-02-20 | 2019-02-15 | 4 | Douglas Patrice D | MPO | Common Stock | D | 10.0000 | -27 | -0 | 73 | ||||
| 2019-02-20 | 2019-02-15 | 4 | GOLDMAN NEAL P | MPO | Common Stock | D | 10.0000 | -27 | -0 | 73 | ||||
| 2019-02-20 | 2019-02-15 | 4 | Snyder Todd R | MPO | Common Stock | D | 10.0000 | -27 | -0 | 73 | ||||
| 2019-02-20 | 2019-02-15 | 4 | Weatherholt Scott C | MPO | Common Stock | D | 10.0000 | -6,707 | -67 | 53,341 | ||||
| 2019-02-20 | 2019-02-15 | 4 | Harding Amelia Kim | MPO | Common Stock | D | 10.0000 | -5,088 | -51 | 39,718 | ||||
| 2019-02-20 | 2019-02-15 | 4 | McCullough Richard Wayne | MPO | Common Stock | D | 10.0000 | -2,967 | -30 | 30,229 | ||||
| 2019-02-20 | 2019-02-15 | 4 | Sambrooks David J. | MPO | Common Stock | D | 10.0000 | -8,357 | -84 | 68,192 | ||||
| 2019-02-15 | 2019-02-13 | 4 | Avenue Capital Management II, L.P. See footnotes | MPO | Common Stock | I | 10.0000 | -933,142 | -9,331 | 2,561,772 | ||||
| 2019-02-14 | 2019-02-12 | 4 | FIR TREE INC. | MPO | Common Stock, $0.01 par value per share ("Common Stock") | I | 10.0000 | -1,706,949 | -17,069 | 4,686,129 | ||||
| 2019-01-04 | 2019-01-02 | 4 | Carr Alan Jeffrey | MPO | Restricted Stock Unit | D | 26,028 | 26,028 | ||||||
| 2019-01-04 | 2019-01-02 | 4 | GOLDMAN NEAL P | MPO | Restricted Stock Unit | D | 17,352 | 17,352 | ||||||
| 2019-01-04 | 2019-01-02 | 4 | Douglas Patrice D | MPO | Restricted Stock Unit | D | 17,352 | 17,352 | ||||||
| 2019-01-04 | 2019-01-02 | 4 | Snyder Todd R | MPO | Restricted Stock Unit | D | 17,352 | 17,352 | ||||||
| 2019-01-03 | 2018-12-31 | 4 | McCullough Richard Wayne | MPO | Common Stock | D | -1,866 | 33,196 | ||||||
| 2019-01-03 | 2018-12-31 | 4 | Harding Amelia Kim | MPO | Common Stock | D | -1,958 | 44,806 | ||||||
| 2019-01-03 | 2018-12-31 | 4 | Weatherholt Scott C | MPO | Common Stock | D | -2,799 | 60,048 | ||||||
| 2018-11-02 | 2018-11-01 | 4 | Sambrooks David J. | MPO | Common Stock | D | 7.3900 | -6,640 | -49 | 76,549 | ||||
| 2018-10-23 | 2018-10-21 | 4 | McCullough Richard Wayne | MPO | Common Stock | D | 8.2500 | -2,748 | -23 | 35,062 | ||||
| 2018-10-23 | 2018-10-21 | 4 | Harding Amelia Kim | MPO | Common Stock | D | 8.2500 | -4,427 | -37 | 46,764 | ||||
| 2018-10-23 | 2018-10-21 | 4 | Weatherholt Scott C | MPO | Common Stock | D | 8.2500 | -6,256 | -52 | 62,847 | ||||
| 2018-06-12 | 2018-06-08 | 4 | Centerbridge Credit Partners Master AIV IV, L.P. See footnotes | MPO | Common Stock | I | 13.0000 | -5,222 | -68 | 646,632 | ||||
| 2018-06-12 | 2018-06-08 | 4 | Centerbridge Credit Partners Master AIV IV, L.P. | MPO | Common Stock, par value $0.01 ("Common Stock") | D | 13.0000 | -12,952 | -168 | 1,603,841 | ||||
| 2018-06-07 | 2018-06-05 | 4 | Centerbridge Credit Partners Master AIV IV, L.P. See footnotes | MPO | Common Stock | I | 13.0000 | -575 | -7 | 651,854 | ||||
| 2018-06-07 | 2018-06-05 | 4 | Centerbridge Credit Partners Master AIV IV, L.P. | MPO | Common Stock, par value $0.01 ("Common Stock") | D | 13.0000 | -1,425 | -19 | 1,616,793 | ||||
| 2018-05-22 | 2018-05-22 | 4 | Centerbridge Credit Partners Master AIV IV, L.P. See footnotes | MPO | Common Stock | I | 14.1500 | -4,885 | -69 | 652,429 | ||||
| 2018-05-22 | 2018-05-22 | 4 | Centerbridge Credit Partners Master AIV IV, L.P. | MPO | Common Stock | D | 14.1500 | -12,115 | -171 | 1,618,218 | ||||
| 2018-05-22 | 2018-05-18 | 4 | Centerbridge Credit Partners Master AIV IV, L.P. See footnotes | MPO | Common Stock | I | 14.0000 | -44,307 | -620 | 657,314 | ||||
| 2018-05-22 | 2018-05-18 | 4 | Centerbridge Credit Partners Master AIV IV, L.P. | MPO | Common Stock, par value $0.01 ("Common Stock") | D | 14.0000 | -109,893 | -1,539 | 1,630,333 | ||||
| 2018-05-16 | 2018-05-14 | 4/A | Reddin Michael | MPO | Common Stock | D | 13.2000 | 10,000 | 132 | 10,100 | ||||
| 2018-05-16 | 2018-05-14 | 4 | Reddin Michael | MPO | Common Stock | D | 13.2000 | 10,100 | 133 | 10,100 | ||||
| 2018-05-16 | 2018-05-14 | 4 | Sambrooks David J. | MPO | Common Stock | D | 13.2000 | 7,500 | 99 | 83,189 | ||||
| 2018-05-16 | 2018-05-14 | 4 | Sambrooks David J. | MPO | Common Stock | D | 13.1300 | 7,800 | 102 | 75,689 | ||||
| 2018-05-16 | 2018-05-14 | 4 | McCullough Richard Wayne | MPO | Common Stock | D | 12.8400 | -3,170 | -41 | 37,810 | ||||
| 2018-05-14 | 2018-05-10 | 4 | Centerbridge Credit Partners Master AIV IV, L.P. See footnotes | MPO | Common Stock | I | 14.2500 | -29 | -0 | 701,621 | ||||
| 2018-05-14 | 2018-05-10 | 4 | Centerbridge Credit Partners Master AIV IV, L.P. | MPO | Common Stock, par value $0.01 ("Common Stock") | D | 14.2500 | -71 | -1 | 1,740,226 | ||||
| 2018-03-16 | 2018-03-14 | 4 | Centerbridge Credit Partners Master AIV IV, L.P. See footnotes | MPO | Common Stock | I | 13.5000 | -7,183 | -97 | 701,650 | ||||
| 2018-03-16 | 2018-03-14 | 4 | Centerbridge Credit Partners Master AIV IV, L.P. | MPO | Common Stock, par value $0.01 ("Common Stock") | D | 13.5000 | -17,817 | -241 | 1,740,297 | ||||
| 2018-03-07 | 2018-03-05 | 4 | Weatherholt Scott C | MPO | Performance Stock Units | D | 42,916 | 42,916 | ||||||
| 2018-03-07 | 2018-03-05 | 4 | Weatherholt Scott C | MPO | Common Stock | D | 28,610 | 69,103 | ||||||
| 2018-03-07 | 2018-03-05 | 4 | McCullough Richard Wayne | MPO | Performance Stock Units | D | 19,074 | 19,074 | ||||||
| 2018-03-07 | 2018-03-05 | 4 | McCullough Richard Wayne | MPO | Common Stock | D | 19,074 | 44,282 | ||||||
| 2018-03-07 | 2018-03-05 | 4 | Harding Amelia Kim | MPO | Performance Stock Units | D | 20,010 | 20,010 | ||||||
| 2018-03-07 | 2018-03-05 | 4 | Harding Amelia Kim | MPO | Common Stock | D | 20,010 | 51,191 | ||||||
| 2018-02-01 | 2018-01-30 | 4 | Centerbridge Credit Partners Master AIV IV, L.P. See footnotes: | MPO | Warrant | I | 24.00 | 0.7500 | 15,795 | 12 | 94,768 | |||
| 2018-02-01 | 2018-01-30 | 4 | Centerbridge Credit Partners Master AIV IV, L.P. | MPO | Warrant | D | 24.00 | 0.7500 | 34,205 | 26 | 205,232 | |||
| 2018-01-12 | 3 | Centerbridge Credit Partners Master AIV IV, L.P. | MPO | Common Stock, $0.01 par value (the "Common Stock") | D | 4,225,061 | ||||||||
| 2018-01-12 | 3 | Centerbridge Credit Partners Master AIV IV, L.P. | MPO | Common Stock, $0.01 par value (the "Common Stock") | D | 4,225,061 | ||||||||
| 2018-01-12 | 3 | Centerbridge Credit Partners Master AIV IV, L.P. See footnotes | MPO | Common Stock | I | 3,175,780 | ||||||||
| 2018-01-12 | 3 | Centerbridge Credit Partners Master AIV IV, L.P. | MPO | Common Stock, $0.01 par value (the "Common Stock") | D | 4,225,061 | ||||||||
| 2018-01-12 | 3 | Centerbridge Credit Partners Master AIV IV, L.P. See footnotes | MPO | Common Stock | I | 3,175,780 | ||||||||
| 2018-01-12 | 3 | Centerbridge Credit Partners Master AIV IV, L.P. | MPO | Common Stock, $0.01 par value (the "Common Stock") | D | 4,225,061 | ||||||||
| 2018-01-12 | 3 | Centerbridge Credit Partners Master AIV IV, L.P. See footnotes | MPO | Common Stock | I | 3,175,780 | ||||||||
| 2018-01-12 | 3 | Centerbridge Credit Partners Master AIV IV, L.P. | MPO | Common Stock, $0.01 par value (the "Common Stock") | D | 4,225,061 | ||||||||
| 2018-01-12 | 3 | Centerbridge Credit Partners Master AIV IV, L.P. See footnotes | MPO | Common Stock | I | 3,175,780 | ||||||||
| 2018-01-12 | 3 | Centerbridge Credit Partners Master AIV IV, L.P. | MPO | Common Stock, $0.01 par value (the "Common Stock") | D | 4,225,061 | ||||||||
| 2018-01-12 | 3 | Centerbridge Credit Partners Master AIV IV, L.P. See footnotes | MPO | Common Stock | I | 3,175,780 | ||||||||
| 2018-01-12 | 3 | Centerbridge Credit Partners Master AIV IV, L.P. | MPO | Common Stock, $0.01 par value (the "Common Stock") | D | 4,225,061 | ||||||||
| 2018-01-12 | 3 | Centerbridge Credit Partners Master AIV IV, L.P. See footnotes | MPO | Common Stock | I | 3,175,780 | ||||||||
| 2018-01-12 | 3 | Centerbridge Credit Partners Master AIV IV, L.P. See footnotes | MPO | Common Stock | I | 3,175,780 | ||||||||
| 2018-01-12 | 3 | Centerbridge Credit Partners Master AIV IV, L.P. | MPO | Common Stock, $0.01 par value (the "Common Stock") | D | 4,225,061 | ||||||||
| 2018-01-12 | 3 | Centerbridge Credit Partners Master AIV IV, L.P. See footnotes | MPO | Common Stock | I | 3,175,780 | ||||||||
| 2018-01-12 | 3 | Centerbridge Credit Partners Master AIV IV, L.P. | MPO | Common Stock, $0.01 par value (the "Common Stock") | D | 4,225,061 | ||||||||
| 2018-01-12 | 3 | Centerbridge Credit Partners Master AIV IV, L.P. See footnotes | MPO | Common Stock | I | 3,175,780 | ||||||||
| 2018-01-04 | 2018-01-02 | 4 | Carr Alan Jeffrey | MPO | Restricted Stock Unit | D | 13,112 | 13,112 | ||||||
| 2018-01-04 | 2018-01-02 | 4 | VINCENT BRUCE H | MPO | Restricted Stock Unit | D | 8,741 | 8,741 | ||||||
| 2018-01-04 | 2018-01-02 | 4 | Reddin Michael | MPO | Restricted Stock Unit | D | 8,741 | 8,741 | ||||||
| 2018-01-04 | 2018-01-02 | 4 | Snyder Todd R | MPO | Restricted Stock Unit | D | 8,741 | 8,741 | ||||||
| 2018-01-04 | 2018-01-02 | 4 | GOLDMAN NEAL P | MPO | Restricted Stock Unit | D | 8,741 | 8,741 | ||||||
| 2018-01-04 | 2018-01-02 | 4 | BRACE FREDERIC F | MPO | Restricted Stock Unit | D | 8,741 | 8,741 | ||||||
| 2018-01-04 | 2018-01-02 | 4 | Douglas Patrice D | MPO | Restricted Stock Unit | D | 8,741 | 8,741 | ||||||
| 2017-12-12 | 2017-12-08 | 4 | Centerbridge Credit Partners, L.P. See footnotes | MPO | Warrant | I | 24.00 | 0.3100 | -360,928 | -112 | 0 | |||
| 2017-12-12 | 2017-12-08 | 4 | Centerbridge Credit Partners, L.P. See footnotes | MPO | Warrant | I | 24.00 | 0.3100 | -77,838 | -24 | 0 | |||
| 2017-12-12 | 2017-12-08 | 4 | Centerbridge Credit Partners, L.P. See footnotes | MPO | Warrant | I | 24.00 | 0.3100 | -314,836 | -98 | 0 | |||
| 2017-12-12 | 2017-12-08 | 4 | Centerbridge Credit Partners, L.P. | MPO | Warrant | D | 24.00 | 0.3100 | -243,053 | -75 | 0 | |||
| 2017-12-12 | 2017-12-08 | 4 | CSCP II Cayman GP Ltd. See footnotes | MPO | Warrant | I | 24.00 | 0.3100 | -360,928 | -112 | 0 | |||
| 2017-12-12 | 2017-12-08 | 4 | CSCP II Cayman GP Ltd. See footnotes | MPO | Warrant | I | 24.00 | 0.3100 | -77,838 | -24 | 0 | |||
| 2017-12-12 | 2017-12-08 | 4 | CSCP II Cayman GP Ltd. See footnotes | MPO | Warrant | I | 24.00 | 0.3100 | -314,836 | -98 | 0 | |||
| 2017-12-12 | 2017-12-08 | 4 | CSCP II Cayman GP Ltd. | MPO | Warrant | D | 24.00 | 0.3100 | -243,053 | -75 | 0 | |||
| 2017-11-15 | 3 | McCullough Richard Wayne | MPO | Common Stock | D | 50,416 | ||||||||
| 2017-11-15 | 3 | McCullough Richard Wayne | MPO | Common Stock | D | 50,416 | ||||||||
| 2017-11-03 | 2017-11-01 | 4 | Sambrooks David J. | MPO | Performance Stock Units | D | 135,778 | 135,778 | ||||||
| 2017-11-03 | 2017-11-01 | 4 | Sambrooks David J. | MPO | Common Stock | D | 67,889 | 67,889 | ||||||
| 2017-11-03 | 2017-11-03 | 4 | Centerbridge Credit Partners, L.P. See footnotes | MPO | Common Stock | I | 16.5000 | -13,786 | -227 | 1,360,372 | ||||
| 2017-11-03 | 2017-11-03 | 4 | Centerbridge Credit Partners, L.P. See footnotes | MPO | Common Stock | I | 16.5000 | -4,031 | -67 | 397,742 | ||||
| 2017-11-03 | 2017-11-03 | 4 | Centerbridge Credit Partners, L.P. See footnotes | MPO | Common Stock | I | 16.5000 | -7,183 | -119 | 708,833 | ||||
| 2017-11-03 | 2017-11-02 | 4 | Centerbridge Credit Partners, L.P. See footnotes | MPO | Common Stock | I | 16.4032 | -3,860 | -63 | 1,374,158 | ||||
| 2017-11-03 | 2017-11-02 | 4 | Centerbridge Credit Partners, L.P. See footnotes | MPO | Common Stock | I | 16.4032 | -1,129 | -19 | 401,773 | ||||
| 2017-11-03 | 2017-11-02 | 4 | Centerbridge Credit Partners, L.P. See footnotes | MPO | Common Stock | I | 16.4032 | -2,011 | -33 | 716,016 | ||||
| 2017-11-03 | 2017-11-01 | 4 | Centerbridge Credit Partners, L.P. See footnotes | MPO | Common Stock | I | 16.0200 | -13,786 | -221 | 1,378,018 | ||||
| 2017-11-03 | 2017-11-01 | 4 | Centerbridge Credit Partners, L.P. See footnotes | MPO | Common Stock | I | 16.0000 | -55,403 | -886 | 1,391,804 | ||||
| 2017-11-03 | 2017-11-01 | 4 | Centerbridge Credit Partners, L.P. See footnotes | MPO | Common Stock | I | 16.0200 | -4,031 | -65 | 402,902 | ||||
| 2017-11-03 | 2017-11-01 | 4 | Centerbridge Credit Partners, L.P. See footnotes | MPO | Common Stock | I | 16.0000 | -16,199 | -259 | 406,933 | ||||
| 2017-11-03 | 2017-11-01 | 4 | Centerbridge Credit Partners, L.P. See footnotes | MPO | Common Stock | I | 16.0200 | -7,183 | -115 | 718,027 | ||||
| 2017-11-03 | 2017-11-01 | 4 | Centerbridge Credit Partners, L.P. See footnotes | MPO | Common Stock | I | 16.0000 | -28,867 | -462 | 725,210 | ||||
| 2017-11-03 | 2017-11-01 | 4 | Centerbridge Credit Partners, L.P. | MPO | Common Stock, par value $0.01 ("Common Stock") | D | 16.0000 | -149,531 | -2,392 | 0 | ||||
| 2017-11-03 | 2017-11-03 | 4 | CSCP II Cayman GP Ltd. See footnotes | MPO | Common Stock | I | 16.5000 | -13,786 | -227 | 1,360,372 | ||||
| 2017-11-03 | 2017-11-03 | 4 | CSCP II Cayman GP Ltd. See footnotes | MPO | Common Stock | I | 16.5000 | -4,031 | -67 | 397,742 | ||||
| 2017-11-03 | 2017-11-03 | 4 | CSCP II Cayman GP Ltd. See footnotes | MPO | Common Stock | I | 16.5000 | -7,183 | -119 | 708,833 | ||||
| 2017-11-03 | 2017-11-02 | 4 | CSCP II Cayman GP Ltd. See footnotes | MPO | Common Stock | I | 16.4032 | -3,860 | -63 | 1,374,158 | ||||
| 2017-11-03 | 2017-11-02 | 4 | CSCP II Cayman GP Ltd. See footnotes | MPO | Common Stock | I | 16.4032 | -1,129 | -19 | 401,773 | ||||
| 2017-11-03 | 2017-11-02 | 4 | CSCP II Cayman GP Ltd. See footnotes | MPO | Common Stock | I | 16.4032 | -2,011 | -33 | 716,016 | ||||
| 2017-11-03 | 2017-11-01 | 4 | CSCP II Cayman GP Ltd. See footnotes | MPO | Common Stock | I | 16.0200 | -13,786 | -221 | 1,378,018 | ||||
| 2017-11-03 | 2017-11-01 | 4 | CSCP II Cayman GP Ltd. See footnotes | MPO | Common Stock | I | 16.0000 | -55,403 | -886 | 1,391,804 | ||||
| 2017-11-03 | 2017-11-01 | 4 | CSCP II Cayman GP Ltd. See footnotes | MPO | Common Stock | I | 16.0200 | -4,031 | -65 | 402,902 | ||||
| 2017-11-03 | 2017-11-01 | 4 | CSCP II Cayman GP Ltd. See footnotes | MPO | Common Stock | I | 16.0000 | -16,199 | -259 | 406,933 | ||||
| 2017-11-03 | 2017-11-01 | 4 | CSCP II Cayman GP Ltd. See footnotes | MPO | Common Stock | I | 16.0200 | -7,183 | -115 | 718,027 | ||||
| 2017-11-03 | 2017-11-01 | 4 | CSCP II Cayman GP Ltd. See footnotes | MPO | Common Stock | I | 16.0000 | -28,867 | -462 | 725,210 | ||||
| 2017-11-03 | 2017-11-01 | 4 | CSCP II Cayman GP Ltd. | MPO | Common Stock, par value $0.01 ("Common Stock") | D | 16.0000 | -149,531 | -2,392 | 0 | ||||
| 2017-10-23 | 2017-10-21 | 4 | BRACE FREDERIC F | MPO | Common Stock | D | 14.7500 | -41,146 | -607 | 83,900 | ||||
| 2017-10-23 | 2017-10-21 | 4 | BRACE FREDERIC F | MPO | Common Stock | D | 14.7500 | 109,820 | 1,620 | 125,046 | ||||
| 2017-10-23 | 2017-10-21 | 4 | Harding Amelia Kim | MPO | Common Stock | D | 14.7500 | -4,185 | -62 | 6,348 | ||||
| 2017-10-23 | 2017-10-21 | 4 | Harding Amelia Kim | MPO | Common Stock | D | 14.7500 | 6,209 | 92 | 10,533 | ||||
| 2017-10-23 | 2017-10-21 | 4 | Weatherholt Scott C | MPO | Common Stock | D | 14.7500 | -4,628 | -68 | 8,773 | ||||
| 2017-10-23 | 2017-10-21 | 4 | Weatherholt Scott C | MPO | Common Stock | D | 14.7500 | 7,932 | 117 | 13,401 | ||||
| 2017-10-23 | 2017-10-21 | 4 | Elkins Mitchell G. | MPO | Common Stock | D | 14.7500 | -5,476 | -81 | 22,999 | ||||
| 2017-10-23 | 2017-10-21 | 4 | Elkins Mitchell G. | MPO | Common Stock | D | 14.7500 | 16,929 | 250 | 28,475 | ||||
| 2017-10-05 | 2017-10-05 | 4 | Centerbridge Credit Partners, L.P. | MPO | Common Stock | D | 15.5500 | -125,000 | -1,944 | 149,531 | ||||
| 2017-10-05 | 2017-10-03 | 4 | Centerbridge Credit Partners, L.P. | MPO | Common Stock, par value $0.01 ("Common Stock") | D | 15.9000 | -6,700 | -107 | 274,531 | ||||
| 2017-10-05 | 2017-10-05 | 4 | CSCP II Cayman GP Ltd. | MPO | Common Stock | D | 15.5500 | -125,000 | -1,944 | 149,531 | ||||
| 2017-10-05 | 2017-10-03 | 4 | CSCP II Cayman GP Ltd. | MPO | Common Stock, par value $0.01 ("Common Stock") | D | 15.9000 | -6,700 | -107 | 274,531 | ||||
| 2017-09-28 | 2017-09-26 | 4 | Centerbridge Credit Partners, L.P. | MPO | Common Stock, par value $0.01 ("Common Stock") | D | 16.0000 | -150,000 | -2,400 | 281,231 | ||||
| 2017-09-28 | 2017-09-26 | 4 | CSCP II Cayman GP Ltd. | MPO | Common Stock, par value $0.01 ("Common Stock") | D | 16.0000 | -150,000 | -2,400 | 281,231 | ||||
| 2017-09-25 | 2017-09-25 | 4 | Centerbridge Credit Partners, L.P. | MPO | Common Stock | D | 16.0000 | -100,000 | -1,600 | 431,231 | ||||
| 2017-09-25 | 2017-09-21 | 4 | Centerbridge Credit Partners, L.P. | MPO | Common Stock, par value $0.01 ("Common Stock") | D | 16.0000 | -130,000 | -2,080 | 531,231 | ||||
| 2017-09-25 | 2017-09-25 | 4 | CSCP II Cayman GP Ltd. | MPO | Common Stock | D | 16.0000 | -100,000 | -1,600 | 431,231 | ||||
| 2017-09-25 | 2017-09-21 | 4 | CSCP II Cayman GP Ltd. | MPO | Common Stock, par value $0.01 ("Common Stock") | D | 16.0000 | -130,000 | -2,080 | 531,231 | ||||
| 2017-09-14 | 2017-09-14 | 4 | Centerbridge Credit Partners, L.P. | MPO | Common Stock | D | 16.3800 | -150,000 | -2,457 | 661,231 | ||||
| 2017-09-14 | 2017-09-13 | 4 | Centerbridge Credit Partners, L.P. | MPO | Common Stock | D | 16.3000 | -50,000 | -815 | 811,231 | ||||
| 2017-09-14 | 2017-09-12 | 4 | Centerbridge Credit Partners, L.P. | MPO | Common Stock, par value $0.01 ("Common Stock") | D | 16.2000 | -100,000 | -1,620 | 861,231 | ||||
| 2017-09-14 | 2017-09-14 | 4 | CSCP II Cayman GP Ltd. | MPO | Common Stock | D | 16.3800 | -150,000 | -2,457 | 661,231 | ||||
| 2017-09-14 | 2017-09-13 | 4 | CSCP II Cayman GP Ltd. | MPO | Common Stock | D | 16.3000 | -50,000 | -815 | 811,231 | ||||
| 2017-09-14 | 2017-09-12 | 4 | CSCP II Cayman GP Ltd. | MPO | Common Stock, par value $0.01 ("Common Stock") | D | 16.2000 | -100,000 | -1,620 | 861,231 | ||||
| 2017-04-25 | 2017-04-21 | 4/A | Harding Amelia Kim | MPO | Common Stock | D | 18.7500 | -1,981 | -37 | 4,324 | ||||
| 2017-04-25 | 2017-04-21 | 4/A | Harding Amelia Kim | MPO | Common Stock | D | 18.7500 | 6,205 | 116 | 6,305 | ||||
| 2017-04-25 | 2017-04-21 | 4 | HAIGHT NELSON M | MPO | Common Stock | D | 18.7500 | -4,339 | -81 | 11,626 | ||||
| 2017-04-25 | 2017-04-21 | 4 | HAIGHT NELSON M | MPO | Common Stock | D | 18.7500 | 15,865 | 297 | 15,965 | ||||
| 2017-04-25 | 2017-04-21 | 4 | Elkins Mitchell G. | MPO | Common Stock | D | 18.7500 | -5,473 | -103 | 11,546 | ||||
| 2017-04-25 | 2017-04-21 | 4 | Elkins Mitchell G. | MPO | Common Stock | D | 18.7500 | 16,919 | 317 | 17,019 | ||||
| 2017-04-25 | 2017-04-21 | 4 | Weatherholt Scott C | MPO | Common Stock | D | 18.7500 | -2,557 | -48 | 5,469 | ||||
| 2017-04-25 | 2017-04-21 | 4 | Weatherholt Scott C | MPO | Common Stock | D | 18.7500 | 7,926 | 149 | 8,026 | ||||
| 2017-04-25 | 2017-04-21 | 4 | BRACE FREDERIC F | MPO | Common Stock | D | 18.7500 | -6,827 | -128 | 15,226 | ||||
| 2017-04-25 | 2017-04-21 | 4 | BRACE FREDERIC F | MPO | Common Stock | D | 18.7500 | 21,953 | 412 | 22,053 | ||||
| 2017-04-24 | 2017-04-21 | 4 | Harding Amelia Kim | MPO | Common Stock | D | 18.7500 | -1,981 | -37 | 4,224 | ||||
| 2017-04-24 | 2017-04-21 | 4 | Harding Amelia Kim | MPO | Common Stock | D | 18.7500 | 6,205 | 116 | 6,205 | ||||
| 2016-11-25 | 2016-11-23 | 4 | VINCENT BRUCE H | MPO | Restricted Stock Unit | D | 12,716 | 21,617 | ||||||
| 2016-11-25 | 2016-11-23 | 4 | VINCENT BRUCE H | MPO | Restricted Stock Unit | D | 8,901 | 8,901 | ||||||
| 2016-11-25 | 2016-11-23 | 4 | Snyder Todd R | MPO | Restricted Stock Unit | D | 12,716 | 21,617 | ||||||
| 2016-11-25 | 2016-11-23 | 4 | Snyder Todd R | MPO | Restricted Stock Unit | D | 8,901 | 8,901 | ||||||
| 2016-11-25 | 2016-11-23 | 4 | GOLDMAN NEAL P | MPO | Restricted Stock Unit | D | 12,716 | 21,617 | ||||||
| 2016-11-25 | 2016-11-23 | 4 | GOLDMAN NEAL P | MPO | Restricted Stock Unit | D | 8,901 | 8,901 | ||||||
| 2016-11-25 | 2016-11-23 | 4 | Reddin Michael | MPO | Restricted Stock Unit | D | 12,716 | 21,617 | ||||||
| 2016-11-25 | 2016-11-23 | 4 | Reddin Michael | MPO | Restricted Stock Unit | D | 8,901 | 8,901 | ||||||
| 2016-11-25 | 2016-11-23 | 4 | Carr Alan Jeffrey | MPO | Restricted Stock Unit | D | 12,716 | 26,067 | ||||||
| 2016-11-25 | 2016-11-23 | 4 | Carr Alan Jeffrey | MPO | Restricted Stock Unit | D | 13,351 | 13,351 | ||||||
| 2016-11-25 | 2016-11-23 | 4 | Douglas Patrice D | MPO | Restricted Stock Unit | D | 12,716 | 21,617 | ||||||
| 2016-11-25 | 2016-11-23 | 4 | Douglas Patrice D | MPO | Restricted Stock Unit | D | 8,901 | 8,901 | ||||||
| 2016-11-18 | 2016-11-08 | 4 | HAIGHT NELSON M | MPO | Common Stock | D | 100 | 95,328 | ||||||
| 2016-11-18 | 2016-11-08 | 4 | GOLDMAN NEAL P | MPO | Common Stock | D | 100 | 100 | ||||||
| 2016-11-18 | 2016-11-08 | 4 | VINCENT BRUCE H | MPO | Common Stock | D | 100 | 100 | ||||||
| 2016-11-18 | 2016-11-08 | 4 | Snyder Todd R | MPO | Common Stock | D | 100 | 100 | ||||||
| 2016-11-18 | 2016-11-08 | 4 | BRACE FREDERIC F | MPO | Common Stock | D | 100 | 131,873 | ||||||
| 2016-11-18 | 2016-11-08 | 4 | Reddin Michael | MPO | Common Stock | D | 100 | 100 | ||||||
| 2016-11-18 | 2016-11-08 | 4 | Elkins Mitchell G. | MPO | Common Stock | D | 100 | 101,653 | ||||||
| 2016-11-18 | 2016-11-08 | 4 | Carr Alan Jeffrey | MPO | Common Stock | D | 100 | 100 | ||||||
| 2016-11-18 | 2016-11-08 | 4 | Douglas Patrice D | MPO | Common Stock | D | 100 | 100 | ||||||
| 2016-11-18 | 2016-11-08 | 4 | Weatherholt Scott C | MPO | Common Stock | D | 100 | 47,678 | ||||||
| 2016-11-18 | 2016-11-08 | 4 | Harding Amelia Kim | MPO | Common Stock | D | 100 | 37,347 | ||||||
| 2016-11-03 | 3 | LASRY MARC See footnotes | MPO | Common Stock | I | 6,989,828 | ||||||||
| 2016-11-03 | 3 | LASRY MARC See footnotes | MPO | Common Stock | I | 6,989,828 | ||||||||
| 2016-11-03 | 3 | LASRY MARC See footnotes | MPO | Common Stock | I | 6,989,828 | ||||||||
| 2016-11-03 | 3 | LASRY MARC See footnotes | MPO | Common Stock | I | 6,989,828 | ||||||||
| 2016-11-03 | 3 | LASRY MARC See footnotes | MPO | Common Stock | I | 6,989,828 | ||||||||
| 2016-11-03 | 3 | LASRY MARC See footnotes | MPO | Common Stock | I | 6,989,828 | ||||||||
| 2016-11-03 | 3 | LASRY MARC See footnotes | MPO | Common Stock | I | 6,989,828 | ||||||||
| 2016-10-31 | 3 | FIR TREE INC. | MPO | Common Stock, $0.01 par value per share (the "Common Stock") | I | 12,786,156 | ||||||||
| 2016-10-31 | 3 | FIR TREE INC. | MPO | Common Stock, $0.01 par value per share (the "Common Stock") | I | 12,786,156 | ||||||||
| 2016-10-28 | 2016-10-27 | 4 | Centerbridge Credit Partners, L.P. See footnotes | MPO | Common Stock | I | 21.0000 | -1,978 | -42 | 1,447,207 | ||||
| 2016-10-28 | 2016-10-27 | 4 | Centerbridge Credit Partners, L.P. See footnotes | MPO | Common Stock | I | 21.0000 | -578 | -12 | 423,132 | ||||
| 2016-10-28 | 2016-10-27 | 4 | Centerbridge Credit Partners, L.P. See footnotes | MPO | Common Stock | I | 21.0000 | -1,030 | -22 | 754,077 | ||||
| 2016-10-28 | 2016-10-27 | 4 | Centerbridge Credit Partners, L.P. | MPO | Common Stock | D | 21.0000 | -1,314 | -28 | 961,231 | ||||
| 2016-10-28 | 2016-10-25 | 4 | Centerbridge Credit Partners, L.P. See footnotes | MPO | Common Stock | I | 22.6700 | -1,576 | -36 | 1,449,185 | ||||
| 2016-10-28 | 2016-10-25 | 4 | Centerbridge Credit Partners, L.P. See footnotes | MPO | Common Stock | I | 22.6700 | -461 | -10 | 423,710 | ||||
| 2016-10-28 | 2016-10-25 | 4 | Centerbridge Credit Partners, L.P. See footnotes | MPO | Common Stock | I | 22.6700 | -821 | -19 | 755,107 | ||||
| 2016-10-28 | 2016-10-25 | 4 | Centerbridge Credit Partners, L.P. | MPO | Common Stock, par value $0.01 ("Common Stock") | D | 22.6700 | -1,047 | -24 | 962,545 | ||||
| 2016-10-27 | 3 | Aronson Jeffrey | MPO | Common Stock, $0.01 par value (the "Common Stock") | D | 4,558,044 | ||||||||
| 2016-10-27 | 3 | Aronson Jeffrey See footnotes | MPO | Common Stock | I | 5,045,213 | ||||||||
| 2016-10-27 | 3 | Aronson Jeffrey See footnotes | MPO | Common Stock | I | 4,018,623 | ||||||||
| 2016-10-27 | 3 | Aronson Jeffrey See footnotes | MPO | Common Stock | I | 4,350,380 | ||||||||
| 2016-10-27 | 3 | Aronson Jeffrey | MPO | Common Stock, $0.01 par value (the "Common Stock") | D | 4,558,044 | ||||||||
| 2016-10-27 | 3 | Aronson Jeffrey See footnotes | MPO | Common Stock | I | 5,045,213 | ||||||||
| 2016-10-27 | 3 | Aronson Jeffrey See footnotes | MPO | Common Stock | I | 4,350,380 | ||||||||
| 2016-10-27 | 3 | Aronson Jeffrey See footnotes | MPO | Common Stock | I | 4,018,623 | ||||||||
| 2016-10-27 | 3 | Gallogly Mark T See footnotes | MPO | Common Stock | I | 4,018,623 | ||||||||
| 2016-10-27 | 3 | Gallogly Mark T See footnotes | MPO | Common Stock | I | 4,350,380 | ||||||||
| 2016-10-27 | 3 | Gallogly Mark T See footnotes | MPO | Common Stock | I | 4,018,623 | ||||||||
| 2016-10-27 | 3 | Gallogly Mark T See footnotes | MPO | Common Stock | I | 5,045,213 | ||||||||
| 2016-10-27 | 3 | Gallogly Mark T | MPO | Common Stock, $0.01 par value (the "Common Stock") | D | 4,558,044 | ||||||||
| 2016-10-27 | 3 | Gallogly Mark T See footnotes | MPO | Common Stock | I | 5,045,213 | ||||||||
| 2016-10-27 | 3 | Gallogly Mark T See footnotes | MPO | Common Stock | I | 4,350,380 | ||||||||
| 2016-10-27 | 3 | Gallogly Mark T See footnotes | MPO | Common Stock | I | 5,045,213 | ||||||||
| 2016-10-27 | 3 | Gallogly Mark T See footnotes | MPO | Common Stock | I | 4,018,623 | ||||||||
| 2016-10-27 | 3 | Gallogly Mark T See footnotes | MPO | Common Stock | I | 4,350,380 | ||||||||
| 2016-10-27 | 3 | Gallogly Mark T See footnotes | MPO | Common Stock | I | 5,045,213 | ||||||||
| 2016-10-27 | 3 | Gallogly Mark T See footnotes | MPO | Common Stock | I | 4,018,623 | ||||||||
| 2016-10-27 | 3 | Gallogly Mark T See footnotes | MPO | Common Stock | I | 4,350,380 | ||||||||
| 2016-10-27 | 3 | Gallogly Mark T See footnotes | MPO | Common Stock | I | 4,018,623 | ||||||||
| 2016-10-27 | 3 | Gallogly Mark T See footnotes | MPO | Common Stock | I | 4,350,380 | ||||||||
| 2016-10-27 | 3 | Gallogly Mark T | MPO | Common Stock, $0.01 par value (the "Common Stock") | D | 4,558,044 | ||||||||
| 2016-10-27 | 3 | Gallogly Mark T See footnotes | MPO | Common Stock | I | 5,045,213 | ||||||||
| 2016-10-27 | 3 | Gallogly Mark T See footnotes | MPO | Common Stock | I | 4,018,623 | ||||||||
| 2016-10-27 | 3 | Gallogly Mark T See footnotes | MPO | Common Stock | I | 4,350,380 | ||||||||
| 2016-10-27 | 3 | Gallogly Mark T | MPO | Common Stock, $0.01 par value (the "Common Stock") | D | 4,558,044 | ||||||||
| 2016-10-27 | 3 | Gallogly Mark T See footnotes | MPO | Common Stock | I | 5,045,213 | ||||||||
| 2016-10-27 | 3 | Gallogly Mark T | MPO | Common Stock, $0.01 par value (the "Common Stock") | D | 4,558,044 | ||||||||
| 2016-10-27 | 3 | Gallogly Mark T See footnotes | MPO | Common Stock | I | 4,018,623 | ||||||||
| 2016-10-27 | 3 | Gallogly Mark T See footnotes | MPO | Common Stock | I | 5,045,213 | ||||||||
| 2016-10-27 | 3 | Gallogly Mark T See footnotes | MPO | Common Stock | I | 5,045,213 | ||||||||
| 2016-10-27 | 3 | Gallogly Mark T See footnotes | MPO | Common Stock | I | 4,018,623 | ||||||||
| 2016-10-27 | 3 | Gallogly Mark T See footnotes | MPO | Common Stock | I | 4,350,380 | ||||||||
| 2016-10-27 | 3 | Gallogly Mark T | MPO | Common Stock, $0.01 par value (the "Common Stock") | D | 4,558,044 | ||||||||
| 2016-10-27 | 3 | Gallogly Mark T See footnotes | MPO | Common Stock | I | 4,018,623 | ||||||||
| 2016-10-27 | 3 | Gallogly Mark T See footnotes | MPO | Common Stock | I | 5,045,213 | ||||||||
| 2016-10-27 | 3 | Gallogly Mark T | MPO | Common Stock, $0.01 par value (the "Common Stock") | D | 4,558,044 | ||||||||
| 2016-10-27 | 3 | Gallogly Mark T See footnotes | MPO | Common Stock | I | 4,350,380 | ||||||||
| 2016-10-27 | 3 | Gallogly Mark T | MPO | Common Stock, $0.01 par value (the "Common Stock") | D | 4,558,044 | ||||||||
| 2016-10-27 | 3 | Gallogly Mark T See footnotes | MPO | Common Stock | I | 4,350,380 | ||||||||
| 2016-10-27 | 3 | Gallogly Mark T See footnotes | MPO | Common Stock | I | 5,045,213 | ||||||||
| 2016-10-27 | 3 | Gallogly Mark T | MPO | Common Stock, $0.01 par value (the "Common Stock") | D | 4,558,044 | ||||||||
| 2016-10-27 | 3 | Gallogly Mark T See footnotes | MPO | Common Stock | I | 4,350,380 | ||||||||
| 2016-10-27 | 3 | Gallogly Mark T See footnotes | MPO | Common Stock | I | 4,018,623 | ||||||||
| 2016-10-27 | 3 | Gallogly Mark T See footnotes | MPO | Common Stock | I | 5,045,213 | ||||||||
| 2016-10-27 | 3 | Gallogly Mark T | MPO | Common Stock, $0.01 par value (the "Common Stock") | D | 4,558,044 | ||||||||
| 2016-10-27 | 3 | Gallogly Mark T | MPO | Common Stock, $0.01 par value (the "Common Stock") | D | 4,558,044 | ||||||||
| 2016-10-27 | 2016-10-27 | 4 | Aronson Jeffrey See footnotes | MPO | Common Stock | I | 21.0000 | -1,978 | -42 | 1,447,207 | ||||
| 2016-10-27 | 2016-10-27 | 4 | Aronson Jeffrey See footnotes | MPO | Common Stock | I | 21.0000 | -578 | -12 | 423,132 | ||||
| 2016-10-27 | 2016-10-27 | 4 | Aronson Jeffrey See footnotes | MPO | Common Stock | I | 21.0000 | -1,030 | -22 | 754,077 | ||||
| 2016-10-27 | 2016-10-27 | 4 | Aronson Jeffrey | MPO | Common Stock | D | 21.0000 | -1,314 | -28 | 961,231 | ||||
| 2016-10-27 | 2016-10-25 | 4 | Aronson Jeffrey See footnotes | MPO | Common Stock | I | 22.6700 | -1,576 | -36 | 1,449,185 | ||||
| 2016-10-27 | 2016-10-25 | 4 | Aronson Jeffrey See footnotes | MPO | Common Stock | I | 22.6700 | -461 | -10 | 423,710 | ||||
| 2016-10-27 | 2016-10-25 | 4 | Aronson Jeffrey See footnotes | MPO | Common Stock | I | 22.6700 | -821 | -19 | 755,107 | ||||
| 2016-10-27 | 2016-10-25 | 4 | Aronson Jeffrey | MPO | Common Stock, par value $0.01 ("Common Stock") | D | 22.6700 | -1,047 | -24 | 962,545 | ||||
| 2016-10-26 | 2016-10-21 | 4 | Weatherholt Scott C | MPO | Option (Employee Right to Buy) | D | 19.66 | 47,578 | 47,578 | |||||
| 2016-10-26 | 2016-10-21 | 4 | Weatherholt Scott C | MPO | Common Stock | D | 47,578 | 47,578 | ||||||
| 2016-10-26 | 2016-10-21 | 4 | Weatherholt Scott C | MPO | Common Stock | D | -4,000 | 0 | ||||||
| 2016-10-26 | 2016-10-21 | 4 | Weatherholt Scott C | MPO | Common Stock | D | -8,000 | 4,000 | ||||||
| 2016-10-25 | 3 | Harding Amelia Kim | MPO | Common Stock | D | 74,494 | ||||||||
| 2016-10-25 | 3 | Harding Amelia Kim | MPO | Common Stock | D | 74,494 | ||||||||
| 2016-10-25 | 2016-10-21 | 4 | BRACE FREDERIC F | MPO | Option (Employee Right to Buy) | D | 19.66 | 131,773 | 131,773 | |||||
| 2016-10-25 | 2016-10-21 | 4 | BRACE FREDERIC F | MPO | Common Stock | D | 131,773 | 131,773 | ||||||
| 2016-10-25 | 2016-10-21 | 4 | HAIGHT NELSON M | MPO | Option (Employee Right to Buy) | D | 19.66 | 95,228 | 95,228 | |||||
| 2016-10-25 | 2016-10-21 | 4 | HAIGHT NELSON M | MPO | Common Stock | D | 95,228 | 95,228 | ||||||
| 2016-10-25 | 2016-10-21 | 4 | HAIGHT NELSON M | MPO | Common Stock | D | -56,619 | 0 | ||||||
| 2016-10-25 | 2016-10-21 | 4 | Elkins Mitchell G. | MPO | Option (Employee Right to Buy) | D | 19.66 | 101,553 | 101,553 | |||||
| 2016-10-25 | 2016-10-21 | 4 | Elkins Mitchell G. | MPO | Common Stock | D | 101,553 | 101,553 | ||||||
| 2016-10-25 | 2016-10-21 | 4 | Elkins Mitchell G. | MPO | Common Stock | D | -44,567 | 0 | ||||||
| 2016-08-29 | 2016-08-23 | 4 | HAIGHT NELSON M | MPOY | Common Stock | D | 0.1800 | -218 | -0 | 56,619 | ||||
| 2016-06-15 | 2016-06-06 | 4 | Elkins Mitchell G. | MPOY | Common Stock | D | 0.1200 | -531 | -0 | 44,567 | ||||
| 2016-06-10 | 2016-06-06 | 4 | HAIGHT NELSON M | MPOY | Common Stock | D | 0.1200 | -439 | -0 | 56,837 | ||||
| 2016-02-04 | 2016-02-03 | 4 | R/C IV Eagle Holdings, L.P. | MPO | Common Stock | D | 0.7200 | -128,398 | -92 | 1,960,265 | ||||
| 2016-02-04 | 2016-02-02 | 4 | R/C IV Eagle Holdings, L.P. | MPO | Common Stock | D | 0.7700 | -197,376 | -152 | 2,088,663 | ||||
| 2016-02-02 | 2016-02-01 | 4 | R/C IV Eagle Holdings, L.P. | MPO | Common Stock | D | 0.8900 | -38,325 | -34 | 2,286,039 | ||||
| 2016-02-02 | 2016-01-29 | 4 | R/C IV Eagle Holdings, L.P. | MPO | Common Stock | D | 1.0600 | -206,502 | -219 | 2,324,364 | ||||
| 2016-01-29 | 2016-01-28 | 4 | R/C IV Eagle Holdings, L.P. | MPO | Common Stock | D | 0.8300 | -36,667 | -30 | 2,530,866 | ||||
| 2016-01-29 | 2016-01-27 | 4 | R/C IV Eagle Holdings, L.P. | MPO | Common Stock | D | 0.7000 | -31,769 | -22 | 2,567,533 | ||||
| 2016-01-27 | 2016-01-26 | 4 | R/C IV Eagle Holdings, L.P. | MPO | Common Stock | D | 0.6700 | -15,962 | -11 | 2,599,302 | ||||
| 2016-01-27 | 2016-01-25 | 4 | R/C IV Eagle Holdings, L.P. | MPO | Common Stock | D | 0.7200 | -11,422 | -8 | 2,615,264 | ||||
| 2016-01-25 | 2016-01-22 | 4 | R/C IV Eagle Holdings, L.P. | MPO | Common Stock | D | 0.8100 | -34,536 | -28 | 2,626,686 | ||||
| 2016-01-25 | 2016-01-21 | 4 | R/C IV Eagle Holdings, L.P. | MPO | Common Stock | D | 0.8200 | -38,547 | -32 | 2,661,222 | ||||
| 2016-01-21 | 2016-01-20 | 4 | R/C IV Eagle Holdings, L.P. | MPO | Common Stock | D | 0.7100 | -17,542 | -12 | 2,699,769 | ||||
| 2016-01-21 | 2016-01-19 | 4 | R/C IV Eagle Holdings, L.P. | MPO | Common Stock | D | 0.7800 | -24,633 | -19 | 2,717,311 | ||||
| 2016-01-19 | 2016-01-15 | 4 | R/C IV Eagle Holdings, L.P. | MPO | Common Stock | D | 0.8100 | -22,672 | -18 | 2,741,944 | ||||
| 2016-01-19 | 2016-01-14 | 4 | R/C IV Eagle Holdings, L.P. | MPO | Common Stock | D | 0.9300 | -23,790 | -22 | 2,764,616 | ||||
| 2016-01-14 | 2016-01-13 | 4 | R/C IV Eagle Holdings, L.P. | MPO | Common Stock | D | 1.0100 | -29,176 | -29 | 2,788,406 | ||||
| 2016-01-14 | 2016-01-12 | 4 | R/C IV Eagle Holdings, L.P. | MPO | Common Stock | D | 1.0100 | -51,154 | -52 | 2,817,582 | ||||
| 2016-01-12 | 2016-01-11 | 4 | R/C IV Eagle Holdings, L.P. | MPO | Common Stock | D | 1.5400 | -100 | -0 | 2,868,736 | ||||
| 2016-01-12 | 2016-01-08 | 4 | R/C IV Eagle Holdings, L.P. | MPO | Common Stock | D | 1.5500 | -21,210 | -33 | 2,868,836 | ||||
| 2016-01-08 | 2016-01-07 | 4 | R/C IV Eagle Holdings, L.P. | MPO | Common Stock | D | 1.5900 | -9,000 | -14 | 2,890,046 | ||||
| 2016-01-08 | 2016-01-06 | 4 | R/C IV Eagle Holdings, L.P. | MPO | Common Stock | D | 1.8100 | -33,295 | -60 | 2,899,046 | ||||
| 2016-01-05 | 2016-01-01 | 4 | HAIGHT NELSON M | MPO | Common Stock | D | 2.0200 | -15,498 | -31 | 57,276 | ||||
| 2016-01-05 | 2016-01-01 | 4 | HAIGHT NELSON M | MPO | Common Stock | D | 2.0200 | -522 | -1 | 72,774 | ||||
| 2015-12-07 | 2015-12-03 | 4 | R/C IV Eagle Holdings, L.P. | MPO | Common Stock | D | 3.3000 | -400 | -1 | 2,932,341 | ||||
| 2015-12-02 | 2015-12-01 | 4 | R/C IV Eagle Holdings, L.P. | MPO | Common Stock | D | 3.3400 | -1,000 | -3 | 2,932,741 | ||||
| 2015-12-02 | 2015-11-30 | 4 | R/C IV Eagle Holdings, L.P. | MPO | Common Stock | D | 3.3100 | -2,200 | -7 | 2,933,741 | ||||
| 2015-11-30 | 2015-11-27 | 4 | R/C IV Eagle Holdings, L.P. | MPO | Common Stock | D | 3.3100 | -100 | -0 | 2,935,941 | ||||
| 2015-11-30 | 2015-11-25 | 4 | R/C IV Eagle Holdings, L.P. | MPO | Common Stock | D | 3.7800 | -3,891 | -15 | 2,936,041 | ||||
| 2015-11-25 | 3 | Weatherholt Scott C | MPO | Common Stock | D | 24,000 | ||||||||
| 2015-11-25 | 3 | Weatherholt Scott C | MPO | Common Stock | D | 24,000 | ||||||||
| 2015-11-25 | 2015-11-24 | 4 | R/C IV Eagle Holdings, L.P. | MPO | Common Stock | D | 3.3900 | -13,500 | -46 | 2,939,932 | ||||
| 2015-11-25 | 2015-11-23 | 4 | R/C IV Eagle Holdings, L.P. | MPO | Common Stock | D | 3.3300 | -800 | -3 | 2,953,432 | ||||
| 2015-11-23 | 2015-11-20 | 4 | R/C IV Eagle Holdings, L.P. | MPO | Common Stock | D | 3.4400 | -3,932 | -14 | 2,954,232 | ||||
| 2015-11-23 | 2015-11-19 | 4 | R/C IV Eagle Holdings, L.P. | MPO | Common Stock | D | 3.4200 | -7,444 | -25 | 2,958,164 | ||||
| 2015-11-19 | 2015-11-18 | 4 | R/C IV Eagle Holdings, L.P. | MPO | Common Stock | D | 3.6300 | -9,500 | -34 | 2,965,608 | ||||
| 2015-11-19 | 2015-11-17 | 4 | R/C IV Eagle Holdings, L.P. | MPO | Common Stock | D | 3.6800 | -8,400 | -31 | 2,975,108 | ||||
| 2015-11-17 | 2015-11-16 | 4 | R/C IV Eagle Holdings, L.P. | MPO | Common Stock | D | 3.7900 | -17,536 | -66 | 2,983,508 | ||||
| 2015-11-17 | 2015-11-13 | 4 | R/C IV Eagle Holdings, L.P. | MPO | Common Stock | D | 3.6800 | -15,768 | -58 | 3,001,044 | ||||
| 2015-11-12 | 2015-11-10 | 4 | R/C IV Eagle Holdings, L.P. | MPO | Common Stock | D | 4.2800 | -100 | -0 | 3,016,812 | ||||
| 2015-11-12 | 2015-11-09 | 4 | R/C IV Eagle Holdings, L.P. | MPO | Common Stock | D | 4.2500 | -300 | -1 | 3,016,912 | ||||
| 2015-11-09 | 2015-11-06 | 4 | R/C IV Eagle Holdings, L.P. | MPO | Common Stock | D | 4.2500 | -300 | -1 | 3,017,212 | ||||
| 2015-11-09 | 2015-11-05 | 4 | R/C IV Eagle Holdings, L.P. | MPO | Common Stock | D | 4.3000 | -9,476 | -41 | 3,017,512 | ||||
| 2015-11-05 | 2015-11-04 | 4 | R/C IV Eagle Holdings, L.P. | MPO | Common Stock | D | 4.4500 | -50,562 | -225 | 3,026,988 | ||||
| 2015-11-05 | 2015-11-03 | 4 | R/C IV Eagle Holdings, L.P. | MPO | Common Stock | D | 4.2700 | -6,525 | -28 | 3,077,550 | ||||
| 2015-10-30 | 2015-10-29 | 4 | R/C IV Eagle Holdings, L.P. | MPO | Common Stock | D | 4.2500 | -5,100 | -22 | 3,084,075 | ||||
| 2015-10-30 | 2015-10-28 | 4 | R/C IV Eagle Holdings, L.P. | MPO | Common Stock | D | 4.2700 | -7,900 | -34 | 3,089,175 | ||||
| 2015-10-13 | 2015-10-09 | 4 | R/C IV Eagle Holdings, L.P. | MPO | Common Stock | D | 5.9600 | -19,445 | -116 | 3,097,075 | ||||
| 2015-10-09 | 2015-10-08 | 4 | R/C IV Eagle Holdings, L.P. | MPO | Common Stock | D | 5.9600 | -88,103 | -525 | 3,116,520 | ||||
| 2015-10-09 | 2015-10-07 | 4 | R/C IV Eagle Holdings, L.P. | MPO | Common Stock | D | 6.0000 | -50,133 | -301 | 3,204,623 | ||||
| 2015-10-07 | 2015-10-06 | 4 | R/C IV Eagle Holdings, L.P. | MPO | Common Stock | D | 5.9900 | -163,548 | -980 | 3,254,756 | ||||
| 2015-10-07 | 2015-10-05 | 4 | R/C IV Eagle Holdings, L.P. | MPO | Common Stock | D | 5.9100 | -54,072 | -320 | 3,418,304 | ||||
| 2015-10-05 | 2015-10-02 | 4 | R/C IV Eagle Holdings, L.P. | MPO | Common Stock | D | 5.7300 | -38,400 | -220 | 3,472,376 | ||||
| 2015-10-05 | 2015-10-01 | 4 | R/C IV Eagle Holdings, L.P. | MPO | Common Stock | D | 5.9400 | -30,889 | -183 | 3,510,776 | ||||
| 2015-10-01 | 2015-09-30 | 4 | R/C IV Eagle Holdings, L.P. | MPO | Series A Preferred Stock | I | 110.00 | -325,000 | 0 | |||||
| 2015-10-01 | 2015-09-30 | 4 | R/C IV Eagle Holdings, L.P. | MPO | Common Stock | D | 3,541,665 | 3,541,665 | ||||||
| 2015-10-01 | 2015-09-30 | 4 | R/C IV Eagle Holdings, L.P. | MPO | Common Stock | I | -3,738,424 | 0 | ||||||
| 2015-10-01 | 2015-09-30 | 4 | R/C IV Eagle Holdings, L.P. | MPO | Common Stock | I | 110.0000 | 3,738,424 | 411,227 | 3,738,424 | ||||
| 2015-08-25 | 2015-08-23 | 4 | HAIGHT NELSON M | MPO | Common Stock | D | 1.9200 | -122 | -0 | 73,296 | ||||
| 2015-06-08 | 2015-06-06 | 4 | Haight Nelson | MPO | Common Stock | D | 1.1900 | -4,396 | -5 | 734,182 | ||||
| 2015-06-08 | 2015-06-06 | 4 | Elkins Mitchell G. | MPO | Common Stock | D | 1.1900 | -5,240 | -6 | 450,989 | ||||
| 2015-04-30 | 2015-04-25 | 4 | Haight Nelson | MPO | Common Stock | D | 1.0900 | -2,806 | -3 | 738,578 | ||||
| 2015-04-30 | 2015-04-25 | 4 | Elkins Mitchell G. | MPO | Common Stock | D | 1.0900 | -5,226 | -6 | 456,229 | ||||
| 2015-03-13 | 2015-03-11 | 4 | Elkins Mitchell G. | MPO | Common Stock | D | 216,669 | 461,455 | ||||||
| 2015-02-24 | 2015-02-21 | 4 | Haight Nelson | MPO | Common Stock | D | 1.1600 | -13,220 | -15 | 741,384 | ||||
| 2015-02-24 | 2015-02-21 | 4 | Elkins Mitchell G. | MPO | Common Stock | D | 1.1600 | -18,891 | -22 | 244,786 | ||||
| 2015-01-05 | 2015-01-01 | 4 | Haight Nelson | MPO | Common Stock | D | 474,684 | 754,604 | ||||||
| 2015-01-05 | 2015-01-01 | 4 | Haight Nelson | MPO | Common Stock | D | 1.5100 | -4,376 | -7 | 279,920 | ||||
| 2014-12-31 | 2014-12-29 | 4 | Eck Mark E | MPO | Common Stock | D | 266,667 | 266,667 | ||||||
| 2014-12-08 | 3 | Elkins Mitchell G. | MPO | Common Stock | D | 527,354 | ||||||||
| 2014-12-08 | 3 | Elkins Mitchell G. | MPO | Common Stock | D | 527,354 | ||||||||
| 2014-12-03 | 2014-12-01 | 4 | Christ Eric J | MPO | Common Stock | D | 2.0400 | -1,915 | -4 | 149,866 | ||||
| 2014-10-06 | 2014-10-03 | 4 | Christ Eric J | MPO | Common Stock | D | 4.7100 | -2,280 | -11 | 151,781 | ||||
| 2014-10-06 | 2014-10-03 | 4 | Thiele Thomas E | MPO | Common Stock | D | 4.7100 | -2,283 | -11 | 216,328 | ||||
| 2014-08-26 | 2013-08-23 | 4 | Haight Nelson | MPO | Common Stock | D | 6.7500 | -2,188 | -15 | 284,296 | ||||
| 2014-07-02 | 3 | Thiele Thomas E | MPO | Common Stock | D | 437,222 | ||||||||
| 2014-07-02 | 3 | Thiele Thomas E | MPO | Common Stock | D | 437,222 | ||||||||
| 2014-06-09 | 2014-06-06 | 4 | Haight Nelson | MPO | Common Stock | D | 48,216 | 286,484 | ||||||
| 2014-06-09 | 2014-06-06 | 4 | Burleigh Dexter A. | MPO | Common Stock | D | 46,608 | 493,198 | ||||||
| 2014-06-09 | 2014-06-06 | 4 | Hebertson Gregory F | MPO | Common Stock | D | 50,625 | 228,420 | ||||||
| 2014-06-09 | 2014-06-06 | 4 | Christ Eric J | MPO | Common Stock | D | 38,571 | 154,061 | ||||||
| 2014-05-21 | 2014-05-16 | 4 | Newstrom Curtis | MPO | Common Stock | D | 5.9200 | -2,735 | -16 | 540,877 | ||||
| 2014-05-21 | 2014-05-16 | 4 | Burleigh Dexter A. | MPO | Common Stock | D | 5.9200 | -2,188 | -13 | 446,590 | ||||
| 2014-05-21 | 2014-05-16 | 4 | Hebertson Gregory F | MPO | Common Stock | D | 5.9200 | -8,205 | -49 | 177,795 | ||||
| 2014-04-28 | 2014-04-25 | 4 | Haight Nelson | MPO | Common Stock | D | 5.5500 | -2,713 | -15 | 238,268 | ||||
| 2014-04-28 | 2014-04-25 | 4 | Newstrom Curtis | MPO | Common Stock | D | 5.5500 | -2,713 | -15 | 543,612 | ||||
| 2014-02-25 | 2014-02-21 | 4 | Knudson Thomas C | MPO | Common Stock | D | 25,000 | 42,000 | ||||||
| 2014-02-25 | 2014-02-21 | 4 | McDaniel Stephen James | MPO | Common Stock | D | 25,000 | 4,506,242 | ||||||
| 2014-02-25 | 2014-02-21 | 4 | RICCIARDELLO MARY P | MPO | Common Stock | D | 25,000 | 50,615 | ||||||
| 2014-02-25 | 2014-02-21 | 4 | LEIKER LOREN M | MPO | Common Stock | D | 25,000 | 50,615 | ||||||
| 2014-02-25 | 2014-02-21 | 4 | HILL PETER J | MPO | Common Stock | D | -25,000 | 41,000 | ||||||
| 2014-02-25 | 2014-02-21 | 4 | CRUM JOHN A | MPO | Common Stock | D | 4.6000 | -20,836 | -96 | 1,325,465 | ||||
| 2014-02-25 | 2014-02-21 | 4 | Haight Nelson | MPO | Common Stock | D | 120,000 | 240,981 | ||||||
| 2014-02-25 | 2014-02-21 | 4 | Haight Nelson | MPO | Common Stock | D | 4.6000 | -2,721 | -13 | 120,981 | ||||
| 2014-02-25 | 2014-02-21 | 4 | Newstrom Curtis | MPO | Common Stock | D | 129,000 | 546,325 | ||||||
| 2014-02-25 | 2014-02-21 | 4 | Newstrom Curtis | MPO | Common Stock | D | 4.6000 | -5,649 | -26 | 417,325 | ||||
| 2014-02-25 | 2014-02-21 | 4 | Burleigh Dexter A. | MPO | Common Stock | D | 87,000 | 448,778 | ||||||
| 2014-02-25 | 2014-02-21 | 4 | Burleigh Dexter A. | MPO | Common Stock | D | 4.6000 | -3,918 | -18 | 361,778 | ||||
| 2014-02-25 | 2014-02-21 | 4 | Hebertson Gregory F | MPO | Common Stock | D | 96,000 | 186,000 | ||||||
| 2014-02-25 | 2014-02-21 | 4 | Christ Eric J | MPO | Common Stock | D | 60,000 | 115,490 | ||||||
| 2014-02-25 | 2014-02-21 | 4 | Christ Eric J | MPO | Common Stock | D | 4.6000 | -2,177 | -10 | 55,490 | ||||
| 2013-12-16 | 2013-12-16 | 4 | Haight Nelson | MPO | Common Stock | D | 48,000 | 123,702 | ||||||
| 2013-12-02 | 2013-12-01 | 4 | Christ Eric J | MPO | Common Stock | D | 21,000 | 57,667 | ||||||
| 2013-11-20 | 3 | Christ Eric J | MPO | Common Stock | D | 36,667 | ||||||||
| 2013-11-18 | 2013-11-14 | 4 | CRUM JOHN A | MPO | Common Stock | D | 5.9940 | 10,000 | 60 | 1,346,301 | ||||
| 2013-10-15 | 2013-10-15 | 4 | CRUM JOHN A | MPO | Common Stock | D | 5.2600 | 10,000 | 53 | 1,336,301 | ||||
| 2013-09-17 | 2013-09-17 | 4 | CRUM JOHN A | MPO | Common Stock | D | 5.3400 | 10,000 | 53 | 1,326,301 | ||||
| 2013-08-27 | 2013-08-23 | 4 | Haight Nelson | MPO | Common Stock | D | 24,000 | 75,702 | ||||||
| 2013-08-16 | 2013-08-15 | 4 | CRUM JOHN A | MPO | Common Stock | D | 4.4900 | 10,000 | 45 | 1,316,301 | ||||
| 2013-08-13 | 2013-08-13 | 4 | CRUM JOHN A | MPO | Common Stock | D | 4.5200 | 25,000 | 113 | 1,306,301 | ||||
| 2013-07-16 | 2013-07-16 | 4 | CRUM JOHN A | MPO | Common Stock | D | 6.0500 | 10,000 | 60 | 1,281,301 | ||||
| 2013-06-14 | 2013-06-13 | 4 | CRUM JOHN A | MPO | Common Stock | D | 6.1740 | 10,000 | 62 | 1,271,301 | ||||
| 2013-05-29 | 2013-05-28 | 4 | CRUM JOHN A | MPO | Common Stock | D | 6.6180 | 25,000 | 165 | 1,261,301 | ||||
| 2013-05-29 | 2013-05-16 | 4 | Hebertson Gregory F | MPO | Common Stock | D | 90,000 | 90,000 | ||||||
| 2013-05-16 | 2013-05-16 | 4 | Knudson Thomas C | MPO | Common Stock | D | 16,000 | 17,000 | ||||||
| 2013-05-16 | 3 | Knudson Thomas C | MPO | Common Stock | D | 1,000 | ||||||||
| 2013-05-16 | 2013-05-16 | 4 | Newstrom Curtis | MPO | Common Stock | D | 30,000 | 422,974 | ||||||
| 2013-05-16 | 2013-05-16 | 4 | Newstrom Curtis | MPO | Common Stock | D | 30,000 | 422,974 | ||||||
| 2013-05-16 | 2013-05-16 | 4 | Burleigh Dexter A. | MPO | Common Stock | D | 24,000 | 365,696 | ||||||
| 2013-04-29 | 2013-04-25 | 4 | Pugh Stephen C | MPO | Common Stock | D | 6.1100 | -22,528 | -138 | 356,717 | ||||
| 2013-04-29 | 2013-04-25 | 4 | MITCHELL THOMAS L | MPO | Common Stock | D | 6.1100 | -29,024 | -177 | 430,375 | ||||
| 2013-04-29 | 2013-04-25 | 4 | Haight Nelson | MPO | Common Stock | D | 6.1100 | -4,067 | -25 | 51,702 | ||||
| 2013-04-29 | 2013-04-25 | 4 | Newstrom Curtis | MPO | Common Stock | D | 6.1100 | -4,315 | -26 | 392,974 | ||||
| 2013-04-29 | 3 | Burleigh Dexter A. | MPO | Common Stock | D | 341,696 | ||||||||
| 2013-04-03 | 2013-04-01 | 4/A | HILL PETER J | MPO | Common Stock | D | 16,000 | 16,000 | ||||||
| 2013-04-03 | 2013-04-01 | 4 | HILL PETER J | MPO | Common Stock | D | 16,000 | 16,000 | ||||||
| 2013-03-04 | 2013-03-01 | 4 | Zwahlen Clifford G | MPO | Common Stock | D | 45,000 | 45,000 | ||||||
| 2013-02-25 | 2013-02-21 | 4 | McDaniel Stephen James | MPO | Common Stock | D | 16,000 | 4,481,242 | ||||||
| 2013-02-25 | 2013-02-21 | 4 | RICCIARDELLO MARY P | MPO | Common Stock | D | 16,000 | 25,615 | ||||||
| 2013-02-25 | 2013-02-21 | 4 | LEIKER LOREN M | MPO | Common Stock | D | 16,000 | 25,615 | ||||||
| 2013-02-25 | 2013-02-21 | 4 | CRUM JOHN A | MPO | Common Stock | D | 225,000 | 1,236,301 | ||||||
| 2013-02-25 | 2013-02-21 | 4 | Pugh Stephen C | MPO | Common Stock | D | 135,000 | 379,245 | ||||||
| 2013-02-25 | 2013-02-21 | 4 | MITCHELL THOMAS L | MPO | Common Stock | D | 169,000 | 459,399 | ||||||
| 2013-02-25 | 2013-02-21 | 4 | Hart James R. | MPO | Common Stock | D | 38,000 | 146,599 | ||||||
| 2013-02-25 | 2013-02-21 | 4 | Foley John P. | MPO | Common Stock | D | 36,000 | 638,737 | ||||||
| 2013-02-25 | 2013-02-21 | 4 | Haight Nelson | MPO | Common Stock | D | 25,000 | 55,769 | ||||||
| 2013-02-25 | 2013-02-21 | 4 | David Matthew G. | MPO | Common Stock | D | 38,000 | 325,631 | ||||||
| 2013-02-25 | 2013-02-21 | 4 | Newstrom Curtis | MPO | Common Stock | D | 52,000 | 397,289 | ||||||
| 2013-02-25 | 2013-02-21 | 4 | Burleigh Dexter A. | MPO | Common Stock | D | 36,000 | 341,696 | ||||||
| 2013-02-25 | 2013-02-21 | 4 | Elkins Mitchell G. | MPO | Common Stock | D | 43,000 | 101,076 | ||||||
| 2012-12-21 | 2012-12-21 | 4 | McDaniel Stephen James | MPO | Common Stock | D | 9,615 | 4,465,242 | ||||||
| 2012-11-20 | 2012-11-19 | 4 | CRUM JOHN A | MPO | Common Stock | D | 5.5190 | 50,000 | 276 | 1,011,301 | ||||
| 2012-11-19 | 2012-11-15 | 4 | Hart James R. | MPO | Common Stock | D | 5.0800 | 6,000 | 30 | 108,599 | ||||
| 2012-11-15 | 2012-11-15 | 4 | CRUM JOHN A | MPO | Common Stock | D | 5.1434 | 50,000 | 257 | 961,301 | ||||
| 2012-11-13 | 2012-11-13 | 4 | CRUM JOHN A | MPO | Common Stock | D | 5.3530 | 50,000 | 268 | 911,301 | ||||
| 2012-08-29 | 2012-08-29 | 4 | CRUM JOHN A | MPO | Common Stock | D | 8.0255 | 25,000 | 201 | 861,301 | ||||
| 2012-08-22 | 2012-08-22 | 4 | CRUM JOHN A | MPO | Common Stock | D | 8.0400 | 25,000 | 201 | 836,301 | ||||
| 2012-08-21 | 2012-08-21 | 4 | Hart James R. | MPO | Common Stock | D | 8.0200 | 3,000 | 24 | 102,599 | ||||
| 2012-08-21 | 2012-04-25 | 4 | Hart James R. | MPO | Common Stock | D | 13.0000 | 6,000 | 78 | 99,599 | ||||
| 2012-08-20 | 2012-08-16 | 4 | Elkins Mitchell G. | MPO | Common Stock | D | 7.5700 | 10,000 | 76 | 58,076 | ||||
| 2012-08-16 | 2012-08-16 | 4 | CRUM JOHN A | MPO | Common Stock | D | 7.5200 | 25,000 | 188 | 811,301 | ||||
| 2012-08-16 | 2012-08-16 | 4 | Foley John P. | MPO | Common Stock | D | 7.5200 | 13,000 | 98 | 602,737 | ||||
| 2012-04-26 | 2012-04-25 | 4 | MITCHELL THOMAS L | MPO | Common Stock | D | 207,692 | 290,399 | ||||||
| 2012-04-26 | 2012-04-24 | 4 | MITCHELL THOMAS L | MPO | Common Stock | D | 82,707 | 82,707 | ||||||
| 2012-04-26 | 2012-04-24 | 4 | McDaniel Stephen James | MPO | Common Stock | D | 4,455,627 | 4,455,627 | ||||||
| 2012-04-26 | 2012-04-25 | 4 | Pugh Stephen C | MPO | Common Stock | D | 161,538 | 244,245 | ||||||
| 2012-04-26 | 2012-04-24 | 4 | Pugh Stephen C | MPO | Common Stock | D | 82,707 | 82,707 | ||||||
| 2012-04-26 | 2012-04-25 | 4 | RICCIARDELLO MARY P | MPO | Common Stock | D | 9,615 | 9,615 | ||||||
| 2012-04-26 | 2012-04-25 | 4 | LEIKER LOREN M | MPO | Common Stock | D | 9,615 | 9,615 | ||||||
| 2012-04-26 | 2012-04-24 | 4 | CRUM JOHN A | MPO | Common Stock | D | 786,301 | 786,301 | ||||||
| 2012-04-26 | 2012-04-25 | 4 | Hart James R. | MPO | Common Stock | D | 38,461 | 93,599 | ||||||
| 2012-04-26 | 2012-04-24 | 4 | Hart James R. | MPO | Common Stock | D | 55,138 | 55,138 | ||||||
| 2012-04-26 | 2012-04-24 | 4 | Foley John P. | MPO | Common Stock | D | 589,737 | 589,737 | ||||||
| 2012-04-26 | 2012-04-25 | 4 | Haight Nelson | MPO | Common Stock | D | 30,769 | 30,769 | ||||||
| 2012-04-26 | 2012-04-25 | 4 | David Matthew G. | MPO | Common Stock | D | 12.2200 | -26,889 | -329 | 287,631 | ||||
| 2012-04-26 | 2012-04-24 | 4 | David Matthew G. | MPO | Common Stock | D | 314,520 | 314,520 | ||||||
| 2012-04-26 | 2012-04-25 | 4 | Newstrom Curtis | MPO | Common Stock | D | 30,769 | 345,289 | ||||||
| 2012-04-26 | 2012-04-24 | 4 | Newstrom Curtis | MPO | Common Stock | D | 314,520 | 314,520 | ||||||
| 2012-04-26 | 2012-04-25 | 4 | Burleigh Dexter A. | MPO | Common Stock | D | 12.2200 | -8,824 | -108 | 305,696 | ||||
| 2012-04-26 | 2012-04-24 | 4 | Burleigh Dexter A. | MPO | Common Stock | D | 314,520 | 314,520 | ||||||
| 2012-04-26 | 2012-04-25 | 4 | Elkins Mitchell G. | MPO | Common Stock | D | 48,076 | 48,076 | ||||||
| 2012-04-26 | 2012-04-25 | 4 | First Reserve GP XII Ltd D | MPO | Common Stock | I | 12.2200 | -9,402,470 | -114,898 | 27,147,651 | ||||
| 2012-04-24 | 3 | MACAULAY WILLIAM E See Footnotes | MPO | Common Stock | I | 36,550,121 |
P
Compra de mercado aberto ou privada de ativo não-derivativo ou derivativo
S
Venda de mercado aberto ou privada de ativo não-derivativo ou derivativo
A
Concessão, premiação, ou outra aquisição de ativos da empresa (como uma opção)
C
Conversão de derivativo
D
Venda ou transferência de ativos de volta para a empresa
F
Pagamento do preço de exercício ou responsabilidade fiscal utilizando parte dos ativos recebidos da empresa
G
Doação de ativos pelo ou para o insider
K
Swaps de capital e transações de hedge similares
M
Exercício ou conversão de ativo derivativo recebido da empresa (como uma opção)
V
Uma transação voluntariamente reportada no Formulário 4
J
Outro (acompanhado de uma nota explicativa descrevendo a transação)