Estatísticas Básicas
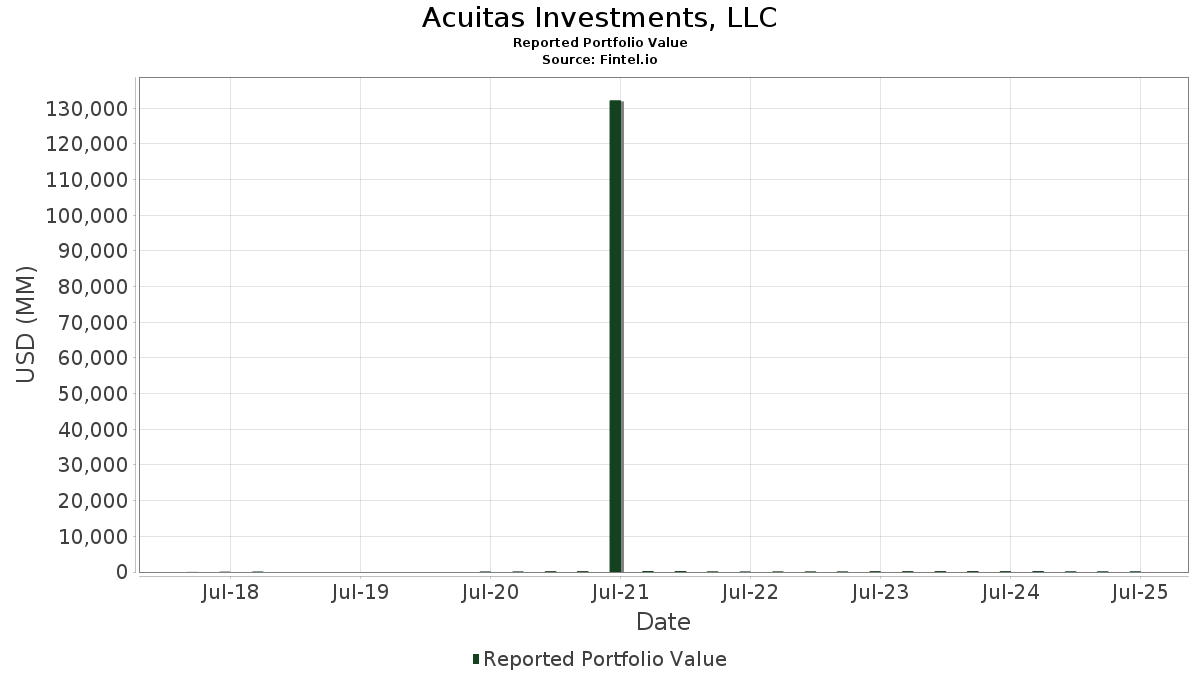
| Valor do Portfólio | $ 155,769,736 |
| Posições Atuais | 52 |
Últimas Participações, Desempenho, AUM (de 13F, 13D)
Acuitas Investments, LLC divulgou 52 participações totais em seus últimos arquivamentos da SEC. O valor mais recente da carteira é calculado como $ 155,769,736 USD. O Ativo Total Sob Gestão (AUM) é esse valor mais o caixa (que não é divulgado). As principais posições de Acuitas Investments, LLC são Solaris Oilfield Infrastructure, Inc. (US:SOI) , Alpha and Omega Semiconductor Limited (US:AOSL) , Mistras Group, Inc. (US:MG) , Natural Gas Services Group, Inc. (US:NGS) , and AngioDynamics, Inc. (US:ANGO) . As novas posições de Acuitas Investments, LLC incluem Green Dot Corporation (US:GDOT) , Gold Royalty Corp. (US:GROY) , Treace Medical Concepts, Inc. (US:TMCI) , M-tron Industries, Inc. (US:MPTI) , and Grupo Financiero Galicia S.A. - Depositary Receipt (Common Stock) (US:GGAL) . As principais indústrias de Acuitas Investments, LLC são "Holding And Other Investment Offices" (sic 67) , "Rubber And Miscellaneous Plastics Products" (sic 30) , and "Miscellaneous Retail " (sic 59) .
Maiores Aumentos Este Trimestre
Usamos a mudança na alocação do portfólio porque esta é a métrica mais significativa. As mudanças podem ser devido a operações ou mudanças nos preços das ações.
| Ativo | Ações (MM) |
Valor (MM$) |
% do Portfólio | Δ% do Portfólio |
|---|---|---|---|---|
| 0.74 | 4.23 | 2.7175 | 2.7175 | |
| 0.27 | 3.65 | 2.3417 | 2.3417 | |
| 0.77 | 5.28 | 3.3891 | 2.0738 | |
| 0.78 | 3.01 | 1.9349 | 1.9349 | |
| 0.64 | 6.33 | 4.0649 | 1.3619 | |
| 0.30 | 2.02 | 1.2970 | 1.2970 | |
| 1.17 | 5.04 | 3.2373 | 1.2221 | |
| 2.39 | 3.99 | 2.5646 | 1.0100 | |
| 0.68 | 4.47 | 2.8705 | 0.8048 | |
| 0.18 | 3.08 | 1.9755 | 0.8008 |
Maiores Diminuições Este Trimestre
Usamos a mudança na alocação do portfólio porque esta é a métrica mais significativa. As mudanças podem ser devido a operações ou mudanças nos preços das ações.
| Ativo | Ações (MM) |
Valor (MM$) |
% do Portfólio | Δ% do Portfólio |
|---|---|---|---|---|
| 0.05 | 0.66 | 0.4231 | -1.9050 | |
| 0.10 | 3.41 | 2.1863 | -1.6153 | |
| 0.00 | 0.00 | -1.2329 | ||
| 0.20 | 2.97 | 1.9071 | -1.1625 | |
| 0.03 | 0.49 | 0.3121 | -1.1008 | |
| 0.51 | 4.23 | 2.7140 | -0.9534 | |
| 0.42 | 5.07 | 3.2577 | -0.8477 | |
| 0.37 | 3.97 | 2.5495 | -0.7874 | |
| 0.12 | 2.33 | 1.4950 | -0.7523 | |
| 0.10 | 2.35 | 1.5095 | -0.7345 |
Arquivamentos 13D/G
Esta é uma lista de arquivamentos 13D e 13G feitos no último ano (se houver). Clique no ícone de link para ver o histórico completo da transação. Linhas verdes indicam novas posições. Linhas vermelhas indicam posições fechadas.
| Data do Arquivo | Formulário | Ativo | Ações Anteriores |
Ações Atuais |
ΔAções % | % de Propriedade |
% Δde Propriedade | |
|---|---|---|---|---|---|---|---|---|
| 2025-05-02 | RRGB / Red Robin Gourmet Burgers, Inc. | 845,156 | 877,606 | 3.84 | 5.02 | 3.29 | ||
| 2025-05-02 | OESX / Orion Energy Systems, Inc. | 1,715,349 | 1,017,701 | -40.67 | 3.09 | -40.69 |
Arquivamentos 13F e Fundo
Este formulário foi arquivado em 2025-11-18 para o período de relatório 2025-09-30. Clique no ícone de link para ver o histórico completo da transação.
Atualize para desbloquear dados premium e exportar para Excel ![]() .
.
| Ativo | Tipo | Preço Médio por Ação | Ações (MM) |
ΔAções (%) |
Valor ($MM) |
ΔAções (%) |
Portfólio (%) |
ΔPortfólio (%) |
|
|---|---|---|---|---|---|---|---|---|---|
| SOI / Solaris Oilfield Infrastructure, Inc. | 0.18 | -3.24 | 7.31 | 36.69 | 4.6928 | 0.4377 | |||
| AOSL / Alpha and Omega Semiconductor Limited | 0.24 | 38.60 | 6.74 | 51.03 | 4.3244 | 0.7752 | |||
| MG / Mistras Group, Inc. | 0.64 | 51.74 | 6.33 | 86.43 | 4.0649 | 1.3619 | |||
| NGS / Natural Gas Services Group, Inc. | 0.22 | 8.24 | 6.07 | 17.38 | 3.8938 | -0.2179 | |||
| ANGO / AngioDynamics, Inc. | 0.50 | 12.73 | 5.57 | 26.95 | 3.5749 | 0.0840 | |||
| OPRT / Oportun Financial Corporation | 0.89 | 20.37 | 5.51 | 3.73 | 3.5350 | -0.6894 | |||
| TLS / Telos Corporation | 0.77 | 48.02 | 5.28 | 219.55 | 3.3891 | 2.0738 | |||
| MCHB / Mechanics Bancorp | 0.38 | 0.00 | 5.10 | 1.84 | 3.2752 | -0.7113 | |||
| GLDD / Great Lakes Dredge & Dock Corporation | 0.42 | 0.00 | 5.07 | -1.65 | 3.2577 | -0.8477 | |||
| UROY / Uranium Royalty Corp. | 1.17 | 15.77 | 5.04 | 99.13 | 3.2373 | 1.2221 | |||
| HLX / Helix Energy Solutions Group, Inc. | 0.68 | 63.85 | 4.47 | 72.29 | 2.8705 | 0.8048 | |||
| TTI / TETRA Technologies, Inc. | 0.74 | 4.23 | 2.7175 | 2.7175 | |||||
| ORN / Orion Group Holdings, Inc. | 0.51 | 0.00 | 4.23 | -8.27 | 2.7140 | -0.9534 | |||
| URG / Ur-Energy Inc. | 2.24 | 0.00 | 4.01 | 70.50 | 2.5711 | 0.7017 | |||
| ARAY / Accuray Incorporated | 2.39 | 67.75 | 3.99 | 104.51 | 2.5646 | 1.0100 | |||
| ARHS / Arhaus, Inc. | 0.37 | -22.76 | 3.97 | -5.29 | 2.5495 | -0.7874 | |||
| RRGB / Red Robin Gourmet Burgers, Inc. | 0.56 | 0.00 | 3.84 | 18.48 | 2.4662 | -0.1139 | |||
| TGB / Taseko Mines Limited | 0.89 | -24.47 | 3.77 | 1.43 | 2.4212 | -0.5377 | |||
| YTRA / Yatra Online, Inc. | 2.67 | 10.42 | 3.74 | 58.68 | 2.4010 | 0.5253 | |||
| OR / OR Royalties Inc. | 0.09 | -11.24 | 3.72 | 38.36 | 2.3854 | 0.2486 | |||
| GDOT / Green Dot Corporation | 0.27 | 3.65 | 2.3417 | 2.3417 | |||||
| INVX / Innovex International, Inc. | 0.19 | 0.00 | 3.44 | 18.69 | 2.2061 | -0.0978 | |||
| METC / Ramaco Resources, Inc. | 0.10 | -71.78 | 3.41 | -28.72 | 2.1863 | -1.6153 | |||
| HZO / MarineMax, Inc. | 0.13 | 24.94 | 3.33 | 25.89 | 2.1390 | 0.0328 | |||
| RNGR / Ranger Energy Services, Inc. | 0.23 | 52.80 | 3.18 | 79.71 | 2.0413 | 0.6330 | |||
| METCB / Ramaco Resources, Inc. | 0.18 | 1.20 | 3.08 | 108.47 | 1.9755 | 0.8008 | |||
| GROY / Gold Royalty Corp. | 0.78 | 3.01 | 1.9349 | 1.9349 | |||||
| FTK / Flotek Industries, Inc. | 0.20 | -22.14 | 2.97 | -23.00 | 1.9071 | -1.1625 | |||
| PUBM / PubMatic, Inc. | 0.36 | 142.78 | 2.94 | 61.58 | 1.8905 | 0.4403 | |||
| KRMD / KORU Medical Systems, Inc. | 0.76 | 89.59 | 2.92 | 102.92 | 1.8762 | 0.7296 | |||
| PGNY / Progyny, Inc. | 0.13 | 0.00 | 2.83 | -2.17 | 1.8198 | -0.4862 | |||
| VPG / Vishay Precision Group, Inc. | 0.09 | 20.92 | 2.77 | 37.91 | 1.7753 | 0.1797 | |||
| CRAI / CRA International, Inc. | 0.01 | 20.75 | 2.67 | 34.39 | 1.7135 | 0.1331 | |||
| LGND / Ligand Pharmaceuticals Incorporated | 0.01 | -32.18 | 2.39 | 5.71 | 1.5345 | -0.2654 | |||
| INBK / First Internet Bancorp | 0.10 | 0.00 | 2.35 | -16.60 | 1.5095 | -0.7345 | |||
| HCKT / The Hackett Group, Inc. | 0.12 | 10.26 | 2.33 | -17.56 | 1.4950 | -0.7523 | |||
| AMRK / Gold.com, Inc. | 0.08 | 34.32 | 2.19 | 56.65 | 1.4061 | 0.2936 | |||
| CTLP / Cantaloupe, Inc. | 0.21 | 29.38 | 2.17 | 24.46 | 1.3954 | 0.0054 | |||
| TMCI / Treace Medical Concepts, Inc. | 0.30 | 2.02 | 1.2970 | 1.2970 | |||||
| AVNW / Aviat Networks, Inc. | 0.06 | 100.07 | 1.45 | 90.93 | 0.9329 | 0.3267 | |||
| RDCM / RADCOM Ltd. | 0.05 | -78.87 | 0.66 | -77.47 | 0.4231 | -1.9050 | |||
| SILC / Silicom Ltd. | 0.03 | -75.77 | 0.49 | -72.62 | 0.3121 | -1.1008 | |||
| YEXT / Yext, Inc. | 0.04 | 82.66 | 0.31 | 82.84 | 0.1988 | 0.0642 | |||
| HBIO / Harvard Bioscience, Inc. | 0.49 | 0.00 | 0.22 | -0.92 | 0.1382 | -0.0352 | |||
| ALLT / Allot Ltd. | 0.02 | -75.88 | 0.17 | -70.25 | 0.1070 | -0.3373 | |||
| AIP / Arteris, Inc. | 0.02 | -82.37 | 0.16 | -81.33 | 0.1029 | -0.5796 | |||
| TTGT / TechTarget, Inc. | 0.03 | -73.00 | 0.16 | -79.92 | 0.1007 | -0.5176 | |||
| MPTI / M-tron Industries, Inc. | 0.00 | 0.14 | 0.0901 | 0.0901 | |||||
| GGAL / Grupo Financiero Galicia S.A. - Depositary Receipt (Common Stock) | 0.00 | 0.11 | 0.0708 | 0.0708 | |||||
| BBD / Banco Bradesco S.A. - Depositary Receipt (Common Stock) | 0.03 | 0.10 | 0.0638 | 0.0638 | |||||
| MCHX / Marchex, Inc. | 0.05 | -24.21 | 0.09 | -37.59 | 0.0566 | -0.0557 | |||
| CAF / Morgan Stanley China A Share Fund, Inc. | 0.00 | 0.08 | 0.0520 | 0.0520 | |||||
| IWM / iShares Trust - iShares Russell 2000 ETF | 0.00 | -100.00 | 0.00 | 0.0000 | |||||
| TRC / Tejon Ranch Co. | 0.00 | -100.00 | 0.00 | 0.0000 | |||||
| VTMX / Corporación Inmobiliaria Vesta, S.A.B. de C.V. - Depositary Receipt (Common Stock) | 0.00 | -100.00 | 0.00 | 0.0000 | |||||
| EWZ / iShares, Inc. - iShares MSCI Brazil ETF | 0.00 | -100.00 | 0.00 | 0.0000 | |||||
| ITRN / Ituran Location and Control Ltd. | 0.00 | -100.00 | 0.00 | 0.0000 | |||||
| SBSW / Sibanye Stillwater Limited - Depositary Receipt (Common Stock) | 0.00 | -100.00 | 0.00 | 0.0000 | |||||
| SBH / Sally Beauty Holdings, Inc. | 0.00 | -100.00 | 0.00 | 0.0000 | |||||
| EQX / Equinox Gold Corp. | 0.00 | -100.00 | 0.00 | -100.00 | -1.2329 | ||||
| VLRS / Controladora Vuela Compañía de Aviación, S.A.B. de C.V. - Depositary Receipt (Common Stock) | 0.00 | -100.00 | 0.00 | 0.0000 |