Estatísticas Básicas
| Perfil do Insider | Fosun International Ltd |
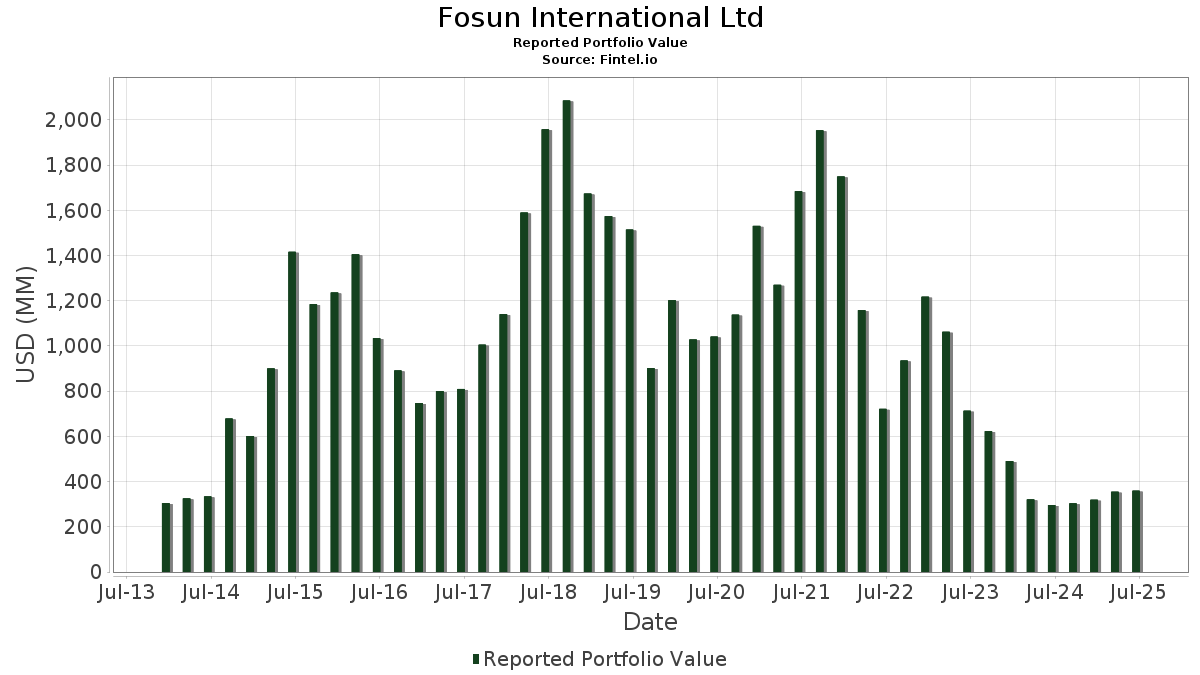
| Valor do Portfólio | $ 267,417,475 |
| Posições Atuais | 46 |
Últimas Participações, Desempenho, AUM (de 13F, 13D)
Fosun International Ltd divulgou 46 participações totais em seus últimos arquivamentos da SEC. O valor mais recente da carteira é calculado como $ 267,417,475 USD. O Ativo Total Sob Gestão (AUM) é esse valor mais o caixa (que não é divulgado). As principais posições de Fosun International Ltd são Lanvin Group Holdings Limited (US:LANV) , Butterfly Network, Inc. (US:BFLY) , DBX ETF Trust - Xtrackers Harvest CSI 300 China A-Shares ETF (US:ASHR) , Alphabet Inc. (US:GOOGL) , and Aurora Mobile Limited - Depositary Receipt (Common Stock) (US:JG) . As novas posições de Fosun International Ltd incluem Hesai Group - Depositary Receipt (Common Stock) (US:HSAI) , . As principais indústrias de Fosun International Ltd são "Health Services" (sic 80) , "Water Transportation" (sic 44) , and "Holding And Other Investment Offices" (sic 67) .
Maiores Aumentos Este Trimestre
Usamos a mudança na alocação do portfólio porque esta é a métrica mais significativa. As mudanças podem ser devido a operações ou mudanças nos preços das ações.
| Ativo | Ações (MM) |
Valor (MM$) |
% do Portfólio | Δ% do Portfólio |
|---|---|---|---|---|
| 90.33 | 187.90 | 69.1829 | 14.1738 | |
| 0.52 | 17.16 | 6.3178 | 2.3336 | |
| 10.72 | 20.68 | 7.6155 | 1.6558 | |
| 0.11 | 3.14 | 1.1728 | 1.1728 | |
| 1.74 | 2.53 | 0.9300 | 0.5813 | |
| 0.02 | 3.78 | 1.3905 | 0.4928 | |
| 0.01 | 2.41 | 0.8886 | 0.3204 | |
| 0.01 | 2.82 | 1.0394 | 0.2856 | |
| 0.01 | 2.46 | 0.9066 | 0.2528 | |
| 0.00 | 0.64 | 0.2380 | 0.2380 |
Maiores Diminuições Este Trimestre
Usamos a mudança na alocação do portfólio porque esta é a métrica mais significativa. As mudanças podem ser devido a operações ou mudanças nos preços das ações.
| Ativo | Ações (MM) |
Valor (MM$) |
% do Portfólio | Δ% do Portfólio |
|---|---|---|---|---|
| 0.00 | 0.00 | -10.2840 | ||
| 0.00 | 0.00 | -1.6240 | ||
| 0.00 | 0.51 | 0.1893 | -1.2474 | |
| 0.00 | 0.21 | 0.0776 | -0.1305 | |
| 0.04 | 0.64 | 0.2376 | -0.0364 | |
| 0.01 | 0.22 | 0.0819 | -0.0319 | |
| 0.74 | 1.05 | 0.3862 | -0.0192 | |
| 0.00 | 0.95 | 0.3568 | -0.0055 |
Arquivamentos 13D/G
Esta é uma lista de arquivamentos 13D e 13G feitos no último ano (se houver). Clique no ícone de link para ver o histórico completo da transação. Linhas verdes indicam novas posições. Linhas vermelhas indicam posições fechadas.
| Data do Arquivo | Formulário | Ativo | Ações Anteriores |
Ações Atuais |
ΔAções % | % de Propriedade |
% Δde Propriedade | |
|---|---|---|---|---|---|---|---|---|
| 2025-08-14 | CHA / Chagee Holdings Limited - Depositary Receipt (Common Stock) | 7,446,439 | 6.20 | |||||
| 2025-07-01 | LANV / Lanvin Group Holdings Limited | 90,334,215 | 90,334,215 | 0.00 | 71.92 | 12.30 |
Arquivamentos 13F e Fundo
Este formulário foi arquivado em 2025-11-14 para o período de relatório 2025-09-30. Clique no ícone de link para ver o histórico completo da transação.
Atualize para desbloquear dados premium e exportar para Excel ![]() .
.
| Ativo | Tipo | Preço Médio por Ação | Ações (MM) |
ΔAções (%) |
Valor ($MM) |
ΔAções (%) |
Portfólio (%) |
ΔPortfólio (%) |
|
|---|---|---|---|---|---|---|---|---|---|
| LANV / Lanvin Group Holdings Limited | 90.33 | 0.00 | 187.90 | -5.02 | 69.1829 | 14.1738 | |||
| BFLY / Butterfly Network, Inc. | 10.72 | 0.00 | 20.68 | -3.50 | 7.6155 | 1.6558 | |||
| ASHR / DBX ETF Trust - Xtrackers Harvest CSI 300 China A-Shares ETF | 0.52 | 0.00 | 17.16 | 19.75 | 6.3178 | 2.3336 | |||
| GOOGL / Alphabet Inc. | 0.02 | -15.21 | 3.78 | 16.98 | 1.3905 | 0.4928 | |||
| JG / Aurora Mobile Limited - Depositary Receipt (Common Stock) | 0.41 | 0.00 | 3.34 | -23.49 | 1.2294 | 0.0159 | |||
| HSAI / Hesai Group - Depositary Receipt (Common Stock) | 0.11 | 3.14 | 1.1728 | 1.1728 | |||||
| MSFT / Microsoft Corporation | 0.01 | 0.00 | 2.82 | 4.13 | 1.0394 | 0.2856 | |||
| HYPR / Hyperfine, Inc. | 1.74 | 0.00 | 2.53 | 101.36 | 0.9300 | 0.5813 | |||
| UNH / UnitedHealth Group Incorporated | 0.01 | -5.39 | 2.46 | 4.72 | 0.9066 | 0.2528 | |||
| NVDA / NVIDIA Corporation | 0.01 | 0.00 | 2.41 | 18.11 | 0.8886 | 0.3204 | |||
| GLOBAL PMTS INC / NOTE 1.500% 3/0 (37940XAU6) | 2.00 | 1.83 | 0.0000 | ||||||
| ADBE / Adobe Inc. | 0.00 | 0.00 | 1.64 | -8.82 | 0.6148 | 0.1134 | |||
| QSI / Quantum-Si incorporated | 0.74 | 0.00 | 1.05 | -28.12 | 0.3862 | -0.0192 | |||
| SNPS / Synopsys, Inc. | 0.00 | 37.61 | 0.99 | 32.57 | 0.3699 | 0.1622 | |||
| V / Visa Inc. | 0.00 | -23.84 | 0.95 | -26.78 | 0.3568 | -0.0055 | |||
| TMO / Thermo Fisher Scientific Inc. | 0.00 | 0.00 | 0.84 | 19.74 | 0.3130 | 0.1184 | |||
| AMZN / Amazon.com, Inc. | 0.00 | 0.00 | 0.81 | 0.00 | 0.3021 | 0.0776 | |||
| NATR / Nature's Sunshine Products, Inc. | 0.05 | -25.57 | 0.74 | -21.92 | 0.2729 | 0.0090 | |||
| LOW / Lowe's Companies, Inc. | 0.00 | 0.00 | 0.64 | 13.18 | 0.2411 | 0.0828 | |||
| MRVL / Marvell Technology, Inc. | 0.01 | 105.14 | 0.64 | 123.26 | 0.2408 | 0.1605 | |||
| AJG / Arthur J. Gallagher & Co. | 0.00 | 0.00 | 0.64 | -3.31 | 0.2403 | 0.0556 | |||
| AAPL / Apple Inc. | 0.00 | 0.64 | 0.2380 | 0.2380 | |||||
| CHA / Chagee Holdings Limited - Depositary Receipt (Common Stock) | 0.04 | 1.72 | 0.64 | -35.53 | 0.2376 | -0.0364 | |||
| AON / Aon plc | 0.00 | 0.00 | 0.60 | -0.17 | 0.2202 | 0.0538 | |||
| BABA / Alibaba Group Holding Limited - Depositary Receipt (Common Stock) | 0.00 | -40.52 | 0.58 | -6.18 | 0.2126 | 0.0413 | |||
| CB / Chubb Limited | 0.00 | 0.00 | 0.55 | -2.65 | 0.2031 | 0.0457 | |||
| AS / Amer Sports, Inc. | 0.02 | 0.00 | 0.54 | -10.33 | 0.1983 | 0.0313 | |||
| WM / Waste Management, Inc. | 0.00 | 0.00 | 0.53 | -3.46 | 0.1952 | 0.0425 | |||
| META / Meta Platforms, Inc. | 0.00 | 0.00 | 0.51 | -90.05 | 0.1893 | -1.2474 | |||
| SYY / Sysco Corporation | 0.01 | 0.00 | 0.51 | 9.40 | 0.1887 | 0.0585 | |||
| AVGO / Broadcom Inc. | 0.00 | 0.00 | 0.50 | 19.81 | 0.1850 | 0.0683 | |||
| SPGI / S&P Global Inc. | 0.00 | 0.00 | 0.48 | -7.71 | 0.1793 | 0.0349 | |||
| BDX / Becton, Dickinson and Company | 0.00 | 0.00 | 0.47 | 8.53 | 0.1764 | 0.0557 | |||
| ABBV / AbbVie Inc. | 0.00 | 51.27 | 0.47 | 90.65 | 0.1728 | 0.1042 | |||
| OXY / Occidental Petroleum Corporation | 0.01 | 0.00 | 0.42 | 12.47 | 0.1530 | 0.0503 | |||
| LIN / Linde plc | 0.00 | 0.00 | 0.41 | 1.24 | 0.1528 | 0.0406 | |||
| ADI / Analog Devices, Inc. | 0.00 | 0.00 | 0.33 | 3.15 | 0.1206 | 0.0324 | |||
| TMUS / T-Mobile US, Inc. | 0.00 | 0.00 | 0.32 | 0.63 | 0.1184 | 0.0294 | |||
| CRM / Salesforce, Inc. | 0.00 | 0.00 | 0.31 | -13.24 | 0.1136 | 0.0149 | |||
| IFF / International Flavors & Fragrances Inc. | 0.00 | 0.00 | 0.27 | -16.30 | 0.0985 | 0.0096 | |||
| DE / Deere & Company | 0.00 | 0.00 | 0.25 | -10.07 | 0.0921 | 0.0148 | |||
| TSM / Taiwan Semiconductor Manufacturing Company Limited - Depositary Receipt (Common Stock) | 0.00 | -33.98 | 0.24 | -18.77 | 0.0879 | 0.0064 | |||
| DHR / Danaher Corporation | 0.00 | 0.00 | 0.24 | 0.00 | 0.0876 | 0.0217 | |||
| TECK / Teck Resources Limited | 0.01 | -50.00 | 0.22 | -45.72 | 0.0819 | -0.0319 | |||
| NEE / NextEra Energy, Inc. | 0.00 | -74.50 | 0.21 | -72.33 | 0.0776 | -0.1305 | |||
| KO / The Coca-Cola Company | 0.00 | 0.00 | 0.20 | -6.10 | 0.0748 | 0.0155 | |||
| IJH / iShares Trust - iShares Core S&P Mid-Cap ETF | 0.00 | -100.00 | 0.00 | -100.00 | -10.2840 | ||||
| BBJP / J.P. Morgan Exchange-Traded Fund Trust - JPMorgan BetaBuilders Japan ETF | 0.00 | -100.00 | 0.00 | 0.0000 | |||||
| KUAIX / Krane UBS China A Share Fund | 0.00 | -100.00 | 0.00 | 0.0000 | |||||
| XEL / Xcel Energy Inc. | 0.00 | -100.00 | 0.00 | 0.0000 | |||||
| ULY / Urgent.ly Inc. | 0.00 | -100.00 | 0.00 | 0.0000 | |||||
| TPR / Tapestry, Inc. | 0.00 | -100.00 | 0.00 | 0.0000 | |||||
| MCHI / iShares Trust - iShares MSCI China ETF | 0.00 | -100.00 | 0.00 | -100.00 | -1.6240 | ||||
| INDA / iShares Trust - iShares MSCI India ETF | 0.00 | -100.00 | 0.00 | 0.0000 | |||||
| ARES.PRB / Ares Management Corporation - Preferred Security | 0.00 | -100.00 | 0.00 | 0.0000 | |||||
| KKR.PRD / KKR & Co. Inc. - Preferred Stock | 0.00 | -100.00 | 0.00 | 0.0000 |