Estatísticas Básicas
| Valor do Portfólio | $ 394,366,923 |
| Posições Atuais | 76 |
Últimas Participações, Desempenho, AUM (de 13F, 13D)
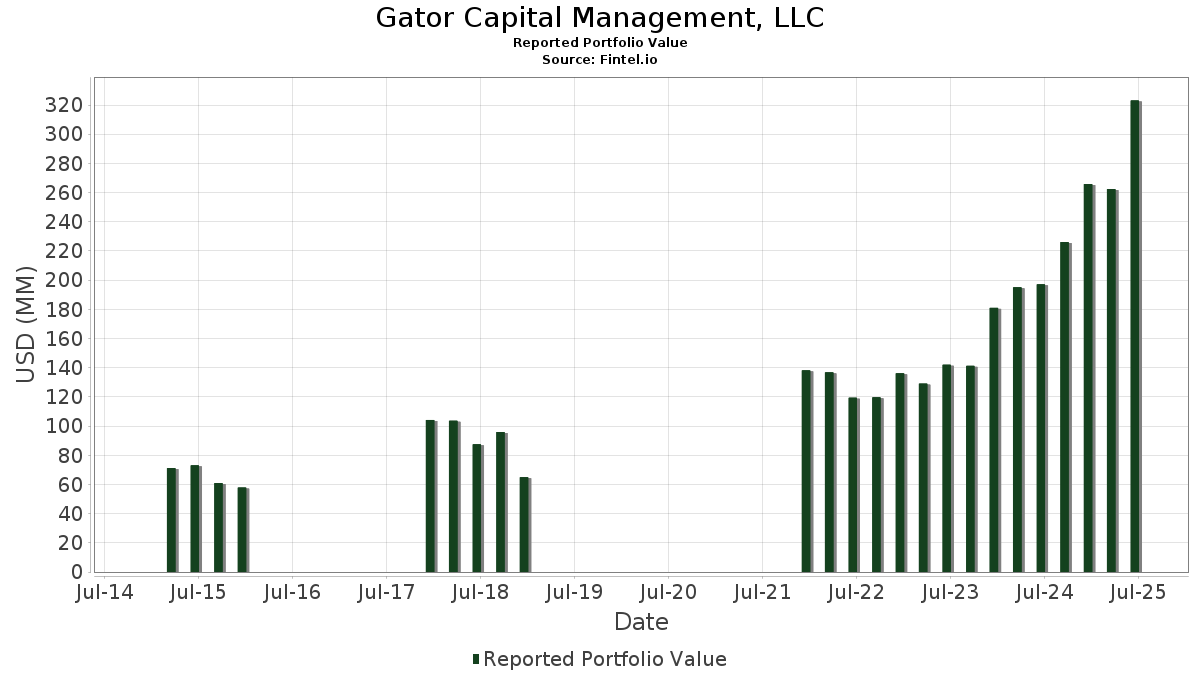
Gator Capital Management, LLC divulgou 76 participações totais em seus últimos arquivamentos da SEC. O valor mais recente da carteira é calculado como $ 394,366,923 USD. O Ativo Total Sob Gestão (AUM) é esse valor mais o caixa (que não é divulgado). As principais posições de Gator Capital Management, LLC são Robinhood Markets, Inc. (US:HOOD) , Anywhere Real Estate Inc. (US:HOUS) , First Citizens BancShares, Inc. (US:FCNCA) , Axos Financial, Inc. (US:AX) , and UMB Financial Corporation (US:UMBF) . As novas posições de Gator Capital Management, LLC incluem First Financial Bancorp. (US:FFBC) , Alerus Financial Corporation (US:ALRS) , Robinhood Markets, Inc. (US:HOOD) , Fiserv, Inc. (US:FI) , and Pathward Financial, Inc. (US:CASH) . As principais indústrias de Gator Capital Management, LLC são "Printing, Publishing, And Allied Industries" (sic 27) , "Primary Metal Industries" (sic 33) , and "Measuring, Analyzing, And Controlling Instruments; Photographic, Medical And Optical Goods; Watches And Clocks" (sic 38) .
Maiores Aumentos Este Trimestre
Usamos a mudança na alocação do portfólio porque esta é a métrica mais significativa. As mudanças podem ser devido a operações ou mudanças nos preços das ações.
| Ativo | Ações (MM) |
Valor (MM$) |
% do Portfólio | Δ% do Portfólio |
|---|---|---|---|---|
| HOUS / Anywhere Real Estate Inc. | 2.56 | 27.15 | 6.8849 | 4.0256 |
| HOOD / Robinhood Markets, Inc. | 0.54 | 76.63 | 19.4317 | 3.2854 |
| FFBC / First Financial Bancorp. | 0.22 | 5.60 | 1.4209 | 1.4209 |
| GPN / Global Payments Inc. | 0.14 | 11.77 | 2.9851 | 0.8389 |
| ALRS / Alerus Financial Corporation | 0.06 | 1.44 | 0.3644 | 0.3644 |
| UBS / UBS Group AG (Call) | 0.00 | 3.16 | 0.8009 | 0.3225 |
| HOOD / Robinhood Markets, Inc. (Put) | 0.00 | 1.23 | 0.3106 | 0.3106 |
| FI / Fiserv, Inc. | 0.01 | 0.66 | 0.1685 | 0.1685 |
| CASH / Pathward Financial, Inc. | 0.01 | 0.62 | 0.1571 | 0.1571 |
| WAL / Western Alliance Bancorporation | 0.10 | 9.04 | 2.2915 | 0.0835 |
Maiores Diminuições Este Trimestre
Usamos a mudança na alocação do portfólio porque esta é a métrica mais significativa. As mudanças podem ser devido a operações ou mudanças nos preços das ações.
| Ativo | Ações (MM) |
Valor (MM$) |
% do Portfólio | Δ% do Portfólio |
|---|---|---|---|---|
| SLM / SLM Corporation | 0.41 | 11.28 | 2.8595 | -1.2452 |
| FCNCA / First Citizens BancShares, Inc. | 0.01 | 16.99 | 4.3077 | -0.9909 |
| CRBG / Corebridge Financial, Inc. | 0.25 | 8.03 | 2.0358 | -0.6949 |
| VRTS / Virtus Investment Partners, Inc. | 0.06 | 11.62 | 2.9477 | -0.4612 |
| VCTR / Victory Capital Holdings, Inc. | 0.13 | 8.47 | 2.1471 | -0.4186 |
| XYZ / Block, Inc. | 0.01 | 1.05 | 0.2659 | -0.3944 |
| CUBI / Customers Bancorp, Inc. | 0.16 | 10.58 | 2.6817 | -0.3775 |
| JXN / Jackson Financial Inc. | 0.10 | 10.51 | 2.6659 | -0.3753 |
| OSBC / Old Second Bancorp, Inc. | 0.34 | 5.80 | 1.4698 | -0.3586 |
| WEX / WEX Inc. | 0.07 | 10.39 | 2.6348 | -0.3416 |
Arquivamentos 13D/G
Esta é uma lista de arquivamentos 13D e 13G feitos no último ano (se houver). Clique no ícone de link para ver o histórico completo da transação. Linhas verdes indicam novas posições. Linhas vermelhas indicam posições fechadas.
| Data do Arquivo | Formulário | Ativo | Ações Anteriores |
Ações Atuais |
ΔAções % | % de Propriedade |
% Δde Propriedade | |
|---|---|---|---|---|---|---|---|---|
| 2025-08-05 | GROW / U.S. Global Investors, Inc. | 596,734 | 684,223 | 14.66 | 6.18 | 18.62 | ||
| 2025-08-05 | SOHO / Sotherly Hotels Inc. | 1,000,187 | 1,002,962 | 0.28 | 4.89 | -2.98 |
Arquivamentos 13F e Fundo
Este formulário foi arquivado em 2025-11-13 para o período de relatório 2025-09-30. Clique no ícone de link para ver o histórico completo da transação.
Atualize para desbloquear dados premium e exportar para Excel ![]() .
.
| Ativo | Tipo | Preço Médio por Ação | Ações (MM) |
ΔAções (%) |
Valor ($MM) |
ΔAções (%) |
Portfólio (%) |
ΔPortfólio (%) |
|
|---|---|---|---|---|---|---|---|---|---|
| HOOD / Robinhood Markets, Inc. | 0.54 | -3.93 | 76.63 | 46.91 | 19.4317 | 3.2854 | |||
| HOUS / Anywhere Real Estate Inc. | 2.56 | 0.48 | 27.15 | 193.97 | 6.8849 | 4.0256 | |||
| FCNCA / First Citizens BancShares, Inc. | 0.01 | 8.53 | 16.99 | -0.75 | 4.3077 | -0.9909 | |||
| AX / Axos Financial, Inc. | 0.15 | 0.54 | 13.04 | 11.92 | 3.3068 | -0.3000 | |||
| UMBF / UMB Financial Corporation | 0.10 | 0.47 | 12.03 | 13.07 | 3.0505 | -0.2429 | |||
| GPN / Global Payments Inc. | 0.14 | 63.58 | 11.77 | 69.80 | 2.9851 | 0.8389 | |||
| VRTS / Virtus Investment Partners, Inc. | 0.06 | 0.76 | 11.62 | 5.56 | 2.9477 | -0.4612 | |||
| SLM / SLM Corporation | 0.41 | 0.74 | 11.28 | -14.96 | 2.8595 | -1.2452 | |||
| BCS / Barclays PLC - Depositary Receipt (Common Stock) | 0.52 | 0.78 | 10.70 | 12.06 | 2.7120 | -0.2425 | |||
| CUBI / Customers Bancorp, Inc. | 0.16 | -3.84 | 10.58 | 7.00 | 2.6817 | -0.3775 | |||
| JXN / Jackson Financial Inc. | 0.10 | -6.14 | 10.51 | 7.01 | 2.6659 | -0.3753 | |||
| WEX / WEX Inc. | 0.07 | 0.76 | 10.39 | 8.06 | 2.6348 | -0.3416 | |||
| CG / The Carlyle Group Inc. | 0.16 | 0.76 | 10.21 | 22.92 | 2.5878 | 0.0177 | |||
| OFG / OFG Bancorp | 0.23 | 15.19 | 10.14 | 17.04 | 2.5714 | -0.1106 | |||
| ESQ / Esquire Financial Holdings, Inc. | 0.09 | 0.32 | 9.53 | 8.15 | 2.4159 | -0.3110 | |||
| WAL / Western Alliance Bancorporation | 0.10 | 13.92 | 9.04 | 26.69 | 2.2915 | 0.0835 | |||
| PYPL / PayPal Holdings, Inc. | 0.13 | 20.49 | 8.85 | 8.72 | 2.2447 | -0.2757 | |||
| VCTR / Victory Capital Holdings, Inc. | 0.13 | 0.44 | 8.47 | 2.16 | 2.1471 | -0.4186 | |||
| CRBG / Corebridge Financial, Inc. | 0.25 | 0.80 | 8.03 | -8.99 | 2.0358 | -0.6949 | |||
| CNOB / ConnectOne Bancorp, Inc. | 0.31 | 8.57 | 7.60 | 16.30 | 1.9266 | -0.0955 | |||
| NBN / Northeast Bank | 0.07 | 0.89 | 7.42 | 13.56 | 1.8815 | -0.1413 | |||
| CBNA / Chain Bridge Bancorp, Inc. | 0.20 | 0.80 | 6.68 | 28.02 | 1.6940 | 0.0786 | |||
| OSBC / Old Second Bancorp, Inc. | 0.34 | 0.72 | 5.80 | -1.86 | 1.4698 | -0.3586 | |||
| FFBC / First Financial Bancorp. | 0.22 | 5.60 | 1.4209 | 1.4209 | |||||
| BANC / Banc of California, Inc. | 0.33 | 0.82 | 5.38 | 18.75 | 1.3654 | -0.0381 | |||
| WBS / Webster Financial Corporation | 0.07 | 0.80 | 4.46 | 9.72 | 1.1303 | -0.1271 | |||
| KINS / Kingstone Companies, Inc. | 0.30 | 9.94 | 4.36 | 4.88 | 1.1061 | -0.1815 | |||
| RSP / Invesco Exchange-Traded Fund Trust - Invesco S&P 500 Equal Weight ETF | 0.02 | 0.25 | 4.20 | 4.66 | 1.0660 | -0.1776 | |||
| OPBK / OP Bancorp | 0.26 | 0.85 | 3.57 | 8.05 | 0.9051 | -0.1173 | |||
| DCOM / Dime Community Bancshares, Inc. | 0.11 | 16.90 | 3.26 | 29.44 | 0.8262 | 0.0470 | |||
| MCHB / Mechanics Bancorp | 0.24 | 10.17 | 3.24 | 12.21 | 0.8206 | -0.0723 | |||
| UBS / UBS Group AG | Call | 0.00 | 0.00 | 3.16 | 104.40 | 0.8009 | 0.3225 | ||
| CBNK / Capital Bancorp, Inc. | 0.09 | 0.66 | 2.86 | -4.39 | 0.7241 | -0.2003 | |||
| IBKR / Interactive Brokers Group, Inc. | 0.04 | 0.00 | 2.81 | 24.20 | 0.7119 | 0.0121 | |||
| TFC / Truist Financial Corporation | 0.06 | 1.00 | 2.68 | 7.42 | 0.6791 | -0.0927 | |||
| UBS / UBS Group AG | 0.05 | 4.73 | 2.04 | 26.97 | 0.5183 | 0.0199 | |||
| GROW / U.S. Global Investors, Inc. | 0.70 | 2.44 | 1.93 | 8.38 | 0.4887 | -0.0619 | |||
| BWB / Bridgewater Bancshares, Inc. | 0.10 | 0.68 | 1.78 | 11.34 | 0.4508 | -0.0433 | |||
| IVZ / Invesco Ltd. | 0.07 | 0.00 | 1.72 | 45.52 | 0.4363 | 0.0702 | |||
| GNW / Genworth Financial, Inc. | 0.18 | 0.00 | 1.64 | 14.43 | 0.4165 | -0.0280 | |||
| UNTY / Unity Bancorp, Inc. | 0.03 | 0.84 | 1.64 | 4.66 | 0.4156 | -0.0691 | |||
| BFST / Business First Bancshares, Inc. | 0.07 | 52.74 | 1.54 | 46.26 | 0.3914 | 0.0648 | |||
| META / Meta Platforms, Inc. | 0.00 | 0.00 | 1.53 | -0.52 | 0.3873 | -0.0879 | |||
| ALRS / Alerus Financial Corporation | 0.06 | 1.44 | 0.3644 | 0.3644 | |||||
| SF / Stifel Financial Corp. | 0.01 | 0.00 | 1.36 | 9.32 | 0.3453 | -0.0402 | |||
| AMP / Ameriprise Financial, Inc. | 0.00 | 0.00 | 1.28 | -7.93 | 0.3239 | -0.1057 | |||
| HOOD / Robinhood Markets, Inc. | Put | 0.00 | 1.23 | 0.3106 | 0.3106 | ||||
| FBIZ / First Business Financial Services, Inc. | 0.02 | 0.63 | 1.22 | 1.75 | 0.3094 | -0.0615 | |||
| PKW / Invesco Exchange-Traded Fund Trust - Invesco BuyBack Achievers ETF | 0.01 | 0.00 | 1.08 | 7.14 | 0.2740 | -0.0381 | |||
| MDY / SPDR S&P MidCap 400 ETF Trust | 0.00 | 11.27 | 1.08 | 17.19 | 0.2731 | -0.0117 | |||
| XYZ / Block, Inc. | 0.01 | -53.79 | 1.05 | -50.87 | 0.2659 | -0.3944 | |||
| INBK / First Internet Bancorp | 0.05 | 0.69 | 1.04 | -16.05 | 0.2641 | -0.1199 | |||
| 1SYF / Synchrony Financial | 0.01 | 0.00 | 0.90 | 6.55 | 0.2270 | -0.0333 | |||
| V / Visa Inc. | 0.00 | 0.00 | 0.82 | -3.77 | 0.2070 | -0.0558 | |||
| FI / Fiserv, Inc. | 0.01 | 0.66 | 0.1685 | 0.1685 | |||||
| CASH / Pathward Financial, Inc. | 0.01 | 0.62 | 0.1571 | 0.1571 | |||||
| SOHO / Sotherly Hotels Inc. | 0.73 | -26.94 | 0.59 | -38.45 | 0.1487 | -0.1463 | |||
| DELL / Dell Technologies Inc. | 0.00 | 0.00 | 0.57 | 15.71 | 0.1438 | -0.0080 | |||
| PBFS / Pioneer Bancorp, Inc. | 0.04 | 1.72 | 0.54 | 10.59 | 0.1378 | -0.0145 | |||
| NAVI / Navient Corporation | 0.04 | 23.37 | 0.52 | 15.23 | 0.1324 | -0.0081 | |||
| OBT / Orange County Bancorp, Inc. | 0.02 | 0.90 | 0.51 | -1.55 | 0.1290 | -0.0310 | |||
| VTRS / Viatris Inc. | 0.05 | -7.46 | 0.50 | 2.70 | 0.1256 | -0.0239 | |||
| IWN / iShares Trust - iShares Russell 2000 Value ETF | 0.00 | -18.52 | 0.42 | -8.71 | 0.1065 | -0.0359 | |||
| WT / WisdomTree, Inc. | 0.02 | 0.00 | 0.33 | 20.58 | 0.0849 | -0.0009 | |||
| GPI / Group 1 Automotive, Inc. | 0.00 | 0.00 | 0.27 | 0.37 | 0.0686 | -0.0150 | |||
| AAPL / Apple Inc. | 0.00 | 0.00 | 0.27 | 24.19 | 0.0679 | 0.0011 | |||
| VTI / Vanguard Index Funds - Vanguard Total Stock Market ETF | 0.00 | 0.00 | 0.26 | 7.98 | 0.0653 | -0.0085 | |||
| GIPR / Generation Income Properties, Inc. | 0.27 | 17.11 | 0.25 | -26.13 | 0.0625 | -0.0408 | |||
| GHY / PGIM Global High Yield Fund, Inc | 0.02 | 0.00 | 0.24 | -3.94 | 0.0621 | -0.0168 | |||
| CZR / Caesars Entertainment, Inc. | 0.01 | 0.00 | 0.24 | -4.71 | 0.0617 | -0.0174 | |||
| HIPO / Hippo Holdings Inc. | 0.01 | 0.24 | 0.0606 | 0.0606 | |||||
| JPM / JPMorgan Chase & Co. | 0.00 | -18.23 | 0.23 | -11.07 | 0.0592 | -0.0220 | |||
| MSFT / Microsoft Corporation | 0.00 | 0.00 | 0.23 | 4.07 | 0.0584 | -0.0101 | |||
| PRI / Primerica, Inc. | 0.00 | 0.00 | 0.22 | 1.39 | 0.0556 | -0.0113 | |||
| AMBC / Octave Specialty Group, Inc. | 0.02 | 0.00 | 0.18 | 17.11 | 0.0453 | -0.0018 | |||
| KIO / KKR Income Opportunities Fund | 0.01 | -13.88 | 0.15 | -13.87 | 0.0380 | -0.0157 | |||
| HPE / Hewlett Packard Enterprise Company | 0.00 | -100.00 | 0.00 | 0.0000 | |||||
| ROBINHOOD MKTS INC / PUT (770700952) | Put | 0.00 | -100.00 | 0.00 | 0.0000 | ||||
| OMF / OneMain Holdings, Inc. | 0.00 | -100.00 | 0.00 | 0.0000 |