Estatísticas Básicas
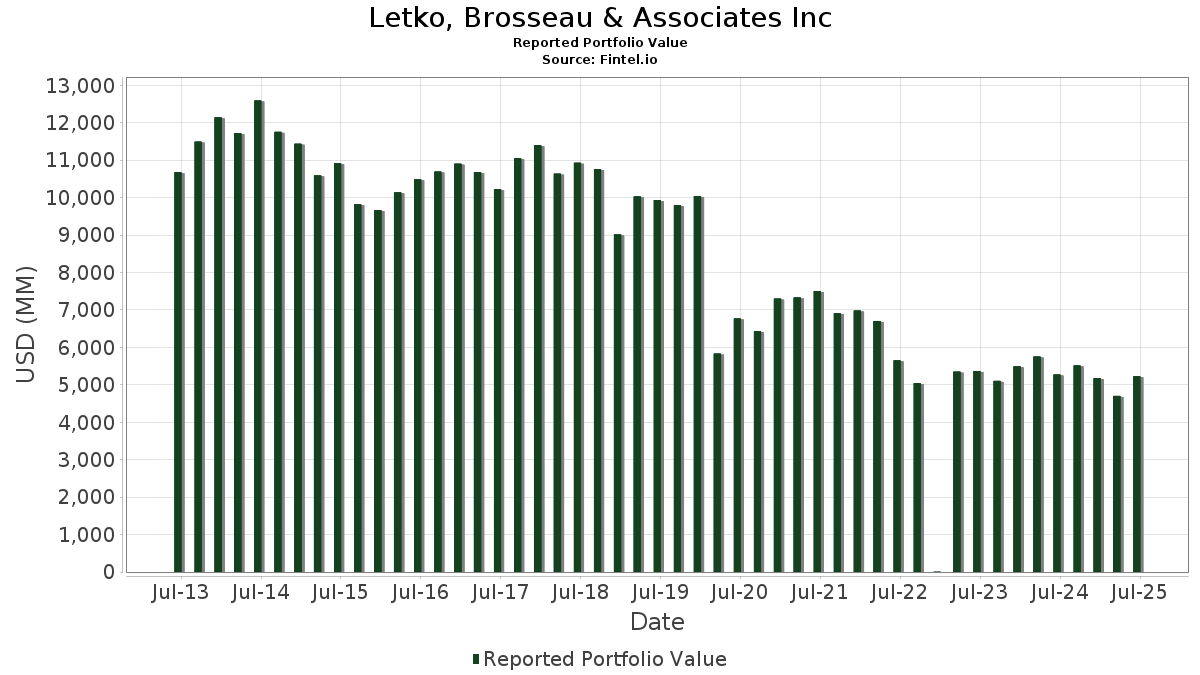
| Valor do Portfólio | $ 5,822,191,581 |
| Posições Atuais | 98 |
Últimas Participações, Desempenho, AUM (de 13F, 13D)
Letko, Brosseau & Associates Inc divulgou 98 participações totais em seus últimos arquivamentos da SEC. O valor mais recente da carteira é calculado como $ 5,822,191,581 USD. O Ativo Total Sob Gestão (AUM) é esse valor mais o caixa (que não é divulgado). As principais posições de Letko, Brosseau & Associates Inc são The Bank of Nova Scotia (US:BNS) , The Toronto-Dominion Bank (GB:0VL8) , Bank of Montreal (US:BMO) , Rogers Communications Inc. (US:RCI) , and Royal Bank of Canada (US:RY) . As novas posições de Letko, Brosseau & Associates Inc incluem NVIDIA Corporation (US:NVDA) , Palvella Therapeutics, Inc. (US:PVLA) , Gossamer Bio, Inc. (US:GOSS) , ProKidney Corp. (MX:PROK) , and . As principais indústrias de Letko, Brosseau & Associates Inc são "Paper And Allied Products" (sic 26) , "Security And Commodity Brokers, Dealers, Exchanges, And Services" (sic 62) , and "Transportation By Air" (sic 45) .
Maiores Aumentos Este Trimestre
Usamos a mudança na alocação do portfólio porque esta é a métrica mais significativa. As mudanças podem ser devido a operações ou mudanças nos preços das ações.
| Ativo | Ações (MM) |
Valor (MM$) |
% do Portfólio | Δ% do Portfólio |
|---|---|---|---|---|
| 4.90 | 160.98 | 2.7649 | 0.7712 | |
| 0.86 | 208.87 | 3.5875 | 0.6457 | |
| 5.65 | 211.36 | 3.6302 | 0.4785 | |
| 0.34 | 28.41 | 0.4879 | 0.4760 | |
| 3.02 | 101.46 | 1.7427 | 0.4651 | |
| 7.05 | 164.67 | 2.8284 | 0.4371 | |
| 4.12 | 195.44 | 3.3569 | 0.3670 | |
| 0.13 | 20.72 | 0.3559 | 0.3559 | |
| 0.19 | 34.45 | 0.5918 | 0.2905 | |
| 0.24 | 83.29 | 1.4305 | 0.1927 |
Maiores Diminuições Este Trimestre
Usamos a mudança na alocação do portfólio porque esta é a métrica mais significativa. As mudanças podem ser devido a operações ou mudanças nos preços das ações.
| Ativo | Ações (MM) |
Valor (MM$) |
% do Portfólio | Δ% do Portfólio |
|---|---|---|---|---|
| 3.53 | 53.51 | 0.9190 | -0.7143 | |
| 6.21 | 193.66 | 3.3262 | -0.4914 | |
| 0.20 | 145.84 | 2.5050 | -0.4636 | |
| 2.92 | 171.23 | 2.9410 | -0.3327 | |
| 0.42 | 47.01 | 0.8074 | -0.3241 | |
| 4.10 | 115.88 | 1.9904 | -0.3188 | |
| 3.03 | 242.49 | 4.1650 | -0.3069 | |
| 0.01 | 0.26 | 0.0044 | -0.2564 | |
| 6.63 | 104.40 | 1.7932 | -0.2290 | |
| 1.15 | 78.14 | 1.3421 | -0.2243 |
Arquivamentos 13D/G
Esta é uma lista de arquivamentos 13D e 13G feitos no último ano (se houver). Clique no ícone de link para ver o histórico completo da transação. Linhas verdes indicam novas posições. Linhas vermelhas indicam posições fechadas.
| Data do Arquivo | Formulário | Ativo | Ações Anteriores |
Ações Atuais |
ΔAções % | % de Propriedade |
% Δde Propriedade | |
|---|---|---|---|---|---|---|---|---|
| 2025-04-09 | EFXT / Enerflex Ltd. | 5,049,686 |
Arquivamentos 13F e Fundo
Este formulário foi arquivado em 2025-11-12 para o período de relatório 2025-09-30. Clique no ícone de link para ver o histórico completo da transação.
Atualize para desbloquear dados premium e exportar para Excel ![]() .
.
| Ativo | Tipo | Preço Médio por Ação | Ações (MM) |
ΔAções (%) |
Valor ($MM) |
ΔAções (%) |
Portfólio (%) |
ΔPortfólio (%) |
|
|---|---|---|---|---|---|---|---|---|---|
| BNS / The Bank of Nova Scotia | 3.98 | -1.78 | 257.41 | 15.11 | 4.4213 | 0.1436 | |||
| 0VL8 / The Toronto-Dominion Bank | 3.03 | -4.79 | 242.49 | 3.73 | 4.1650 | -0.3069 | |||
| BMO / Bank of Montreal | 1.77 | -1.90 | 231.33 | 15.60 | 3.9732 | 0.1453 | |||
| RCI / Rogers Communications Inc. | 6.69 | -0.93 | 230.39 | 15.24 | 3.9571 | 0.1327 | |||
| RY / Royal Bank of Canada | 1.50 | -1.79 | 221.31 | 10.08 | 3.8011 | -0.0449 | |||
| OTEX / Open Text Corporation | 5.65 | 0.06 | 211.36 | 28.29 | 3.6302 | 0.4785 | |||
| GOOG / Alphabet Inc. | 0.86 | -1.07 | 208.87 | 35.82 | 3.5875 | 0.6457 | |||
| MGA / Magna International Inc. | 4.12 | 1.79 | 195.44 | 25.05 | 3.3569 | 0.3670 | |||
| MFC / Manulife Financial Corporation | 6.21 | -0.64 | 193.66 | -2.96 | 3.3262 | -0.4914 | |||
| SLF / Sun Life Financial Inc. | 3.20 | 16.23 | 191.90 | 5.13 | 3.2960 | -0.1958 | |||
| NTR / Nutrien Ltd. | 2.92 | -0.94 | 171.23 | 0.06 | 2.9410 | -0.3327 | |||
| BCE / BCE Inc. | 7.05 | 24.75 | 164.67 | 31.74 | 2.8284 | 0.4371 | |||
| B / Barrick Mining Corporation | 4.90 | -2.31 | 160.98 | 54.46 | 2.7649 | 0.7712 | |||
| CAI / Canadian Imperial Bank of Commerce | 1.89 | -3.17 | 151.19 | 9.25 | 2.5968 | -0.0506 | |||
| META / Meta Platforms, Inc. | 0.20 | -5.54 | 145.84 | -6.02 | 2.5050 | -0.4636 | |||
| T / AT&T Inc. | 4.10 | -1.62 | 115.88 | -4.00 | 1.9904 | -0.3188 | |||
| TU / TELUS Corporation | 6.63 | 0.48 | 104.40 | -1.24 | 1.7932 | -0.2290 | |||
| PFE / Pfizer Inc. | 4.04 | 1.32 | 102.90 | 6.50 | 1.7674 | -0.0809 | |||
| CVE / Cenovus Energy Inc. | 6.01 | -0.86 | 101.99 | 23.99 | 1.7517 | 0.1782 | |||
| INTC / Intel Corporation | 3.02 | 1.43 | 101.46 | 51.92 | 1.7427 | 0.4651 | |||
| CAE / CAE Inc. | 3.25 | -2.19 | 96.29 | -0.95 | 1.6539 | -0.2058 | |||
| SM3 / Suncor Energy Inc. | 2.07 | -0.86 | 86.53 | 11.01 | 1.4863 | -0.0049 | |||
| CVS / CVS Health Corporation | 1.12 | 0.31 | 84.10 | 9.64 | 1.4445 | -0.0229 | |||
| C / Citigroup Inc. | 0.82 | -15.70 | 83.38 | 0.52 | 1.4321 | -0.1546 | |||
| ADBE / Adobe Inc. | 0.24 | 41.17 | 83.29 | 28.71 | 1.4305 | 0.1927 | |||
| ILMN / Illumina, Inc. | 0.85 | 0.09 | 81.13 | -0.37 | 1.3935 | -0.1644 | |||
| STT / State Street Corporation | 0.68 | -1.29 | 79.13 | 7.68 | 1.3592 | -0.0466 | |||
| WFG / West Fraser Timber Co. Ltd. | 1.15 | 2.71 | 78.14 | -4.57 | 1.3421 | -0.2243 | |||
| TFC / Truist Financial Corporation | 1.66 | -0.47 | 76.10 | 5.85 | 1.3071 | -0.0683 | |||
| VZ / Verizon Communications Inc. | 1.66 | 0.43 | 72.86 | 2.01 | 1.2514 | -0.1149 | |||
| GSK / GSK plc - Depositary Receipt (Common Stock) | 1.68 | 0.88 | 72.33 | 13.39 | 1.2424 | 0.0221 | |||
| EMN / Eastman Chemical Company | 1.13 | 33.14 | 71.40 | 12.44 | 1.2264 | 0.0115 | |||
| CMCSA / Comcast Corporation | 2.16 | 18.37 | 67.97 | 4.21 | 1.1674 | -0.0803 | |||
| ABBV / AbbVie Inc. | 0.29 | -2.05 | 67.36 | 22.19 | 1.1569 | 0.1024 | |||
| ELP / Companhia Paranaense de Energia - COPEL - Depositary Receipt (Common Stock) | 6.70 | -0.13 | 65.62 | 7.20 | 1.1271 | -0.0439 | |||
| TECK / Teck Resources Limited | 1.44 | -0.81 | 63.11 | 7.83 | 1.0840 | -0.0356 | |||
| SWKS / Skyworks Solutions, Inc. | 0.78 | 1.57 | 60.18 | 4.92 | 1.0335 | -0.0636 | |||
| WFC / Wells Fargo & Company | 0.68 | -1.82 | 57.12 | 2.71 | 0.9811 | -0.0828 | |||
| CRUS / Cirrus Logic, Inc. | 0.45 | 0.67 | 56.64 | 20.98 | 0.9728 | 0.0773 | |||
| SBS / Companhia de Saneamento Básico do Estado de São Paulo - SABESP - Depositary Receipt (Common Stock) | 2.25 | -0.25 | 55.95 | 13.01 | 0.9610 | 0.0139 | |||
| EFXT / Enerflex Ltd. | 4.97 | -1.61 | 53.66 | 34.72 | 0.9217 | 0.1597 | |||
| HBM / Hudbay Minerals Inc. | 3.53 | -56.20 | 53.51 | -37.33 | 0.9190 | -0.7143 | |||
| FDX / FedEx Corporation | 0.22 | 3.71 | 51.11 | 7.59 | 0.8778 | -0.0309 | |||
| BAC / Bank of America Corporation | 0.99 | -0.21 | 50.82 | 8.79 | 0.8730 | -0.0207 | |||
| GILD / Gilead Sciences, Inc. | 0.42 | -20.62 | 47.01 | -20.53 | 0.8074 | -0.3241 | |||
| SHEL / Shell plc - Depositary Receipt (Common Stock) | 0.63 | -0.14 | 45.42 | 1.45 | 0.7801 | -0.0763 | |||
| WMT / Walmart Inc. | 0.40 | -2.37 | 40.86 | 2.91 | 0.7019 | -0.0578 | |||
| GPK / Graphic Packaging Holding Company | 2.07 | 33.63 | 40.61 | 24.12 | 0.6974 | 0.0716 | |||
| COP / ConocoPhillips | 0.43 | -0.12 | 40.22 | 5.29 | 0.6908 | -0.0400 | |||
| QSR / Restaurant Brands International Inc. | 0.60 | 26.98 | 38.53 | 23.08 | 0.6618 | 0.0629 | |||
| IVZ / Invesco Ltd. | 1.60 | -0.08 | 36.73 | 45.35 | 0.6309 | 0.1474 | |||
| ADNT / Adient plc | 1.50 | 1.00 | 36.04 | 24.98 | 0.6191 | 0.0674 | |||
| LULU / lululemon athletica inc. | 0.19 | 192.13 | 34.45 | 118.79 | 0.5918 | 0.2905 | |||
| MAC / The Macerich Company | 1.84 | 9.99 | 33.44 | 23.72 | 0.5743 | 0.0573 | |||
| CX / CEMEX, S.A.B. de C.V. - Depositary Receipt (Common Stock) | 3.70 | -0.88 | 33.24 | 28.59 | 0.5709 | 0.0764 | |||
| MRK / Merck & Co., Inc. | 0.35 | 1.93 | 29.71 | 8.07 | 0.5103 | -0.0156 | |||
| UPS / United Parcel Service, Inc. | 0.34 | 5,429.67 | 28.41 | 4,481.61 | 0.4879 | 0.4760 | |||
| BAP / Credicorp Ltd. | 0.10 | 0.34 | 25.90 | 19.53 | 0.4449 | 0.0303 | |||
| MRNA / Moderna, Inc. | 0.91 | -0.52 | 23.59 | -6.87 | 0.4052 | -0.0794 | |||
| CPA / Copa Holdings, S.A. | 0.19 | 0.51 | 22.31 | 8.60 | 0.3832 | -0.0098 | |||
| CVX / Chevron Corporation | 0.13 | 20.72 | 0.3559 | 0.3559 | |||||
| BIIB / Biogen Inc. | 0.12 | 2.52 | 16.90 | 14.35 | 0.2902 | 0.0075 | |||
| IBN / ICICI Bank Limited - Depositary Receipt (Common Stock) | 0.44 | -6.28 | 13.23 | -15.78 | 0.2273 | -0.0733 | |||
| CXM / Sprinklr, Inc. | 1.70 | -3.46 | 13.12 | -11.90 | 0.2254 | -0.0596 | |||
| PROF / Profound Medical Corp. | 0.99 | -18.10 | 4.82 | -32.50 | 0.0829 | -0.0539 | |||
| HDB / HDFC Bank Limited - Depositary Receipt (Common Stock) | 0.13 | 120.85 | 4.45 | -1.59 | 0.0764 | -0.0101 | |||
| SW / Smurfit Westrock Plc | 0.09 | 1.14 | 3.89 | -0.21 | 0.0669 | -0.0078 | |||
| XBI / SPDR Series Trust - State Street SPDR S&P Biotech ETF | 0.04 | -7.83 | 3.54 | 11.36 | 0.0608 | -0.0000 | |||
| SCHW / The Charles Schwab Corporation | 0.02 | 0.00 | 1.89 | 4.66 | 0.0324 | -0.0021 | |||
| ING / ING Groep N.V. - Depositary Receipt (Common Stock) | 0.05 | -0.68 | 1.28 | 18.50 | 0.0220 | 0.0013 | |||
| NVDA / NVIDIA Corporation | 0.01 | 1.17 | 0.0200 | 0.0200 | |||||
| FLIN / Franklin Templeton ETF Trust - Franklin FTSE India ETF | 0.02 | 5.72 | 0.83 | -1.08 | 0.0142 | -0.0018 | |||
| ORCL / Oracle Corporation | 0.00 | -21.81 | 0.68 | 0.59 | 0.0117 | -0.0013 | |||
| PBA / Pembina Pipeline Corporation | 0.01 | 13.79 | 0.59 | 22.82 | 0.0102 | 0.0009 | |||
| ELP / Companhia Paranaense de Energia - COPEL - Depositary Receipt (Common Stock) | 0.07 | -3.45 | 0.59 | 1.55 | 0.0101 | -0.0010 | |||
| EMA / Emera Incorporated | 0.01 | 0.00 | 0.41 | 5.17 | 0.0070 | -0.0004 | |||
| NXPI / NXP Semiconductors N.V. | 0.00 | 0.00 | 0.40 | 4.39 | 0.0069 | -0.0005 | |||
| FTS / Fortis Inc. | 0.01 | -7.06 | 0.40 | -1.23 | 0.0069 | -0.0009 | |||
| VALE / Vale S.A. - Depositary Receipt (Common Stock) | 0.04 | 0.00 | 0.40 | 12.11 | 0.0068 | 0.0000 | |||
| ERO / Ero Copper Corp. | 0.02 | 24.14 | 0.36 | 49.18 | 0.0063 | 0.0016 | |||
| NAMS / NewAmsterdam Pharma Company N.V. | 0.01 | 0.00 | 0.33 | 56.81 | 0.0058 | 0.0017 | |||
| MSFT / Microsoft Corporation | 0.00 | 0.00 | 0.33 | 4.10 | 0.0057 | -0.0004 | |||
| PVLA / Palvella Therapeutics, Inc. | 0.01 | 0.33 | 0.0056 | 0.0056 | |||||
| FCX / Freeport-McMoRan Inc. | 0.01 | 0.00 | 0.27 | -9.67 | 0.0047 | -0.0011 | |||
| GOOGL / Alphabet Inc. | 0.00 | 0.27 | 0.0046 | 0.0046 | |||||
| MGTX / MeiraGTx Holdings plc | 0.03 | -29.36 | 0.26 | -10.85 | 0.0045 | -0.0011 | |||
| AMRZ / Amrize AG | 0.01 | -98.06 | 0.26 | -98.12 | 0.0044 | -0.2564 | |||
| SPRY / ARS Pharmaceuticals, Inc. | 0.02 | 0.00 | 0.25 | -42.46 | 0.0043 | -0.0040 | |||
| MLYS / Mineralys Therapeutics, Inc. | 0.01 | -66.82 | 0.21 | -7.17 | 0.0036 | -0.0007 | |||
| ALB / Albemarle Corporation | 0.00 | 0.20 | 0.0034 | 0.0034 | |||||
| AURA / Aura Biosciences, Inc. | 0.03 | 33.49 | 0.17 | 31.82 | 0.0030 | 0.0005 | |||
| TCRX / TScan Therapeutics, Inc. | 0.10 | 0.00 | 0.17 | 25.18 | 0.0030 | 0.0003 | |||
| ETNB / 89bio, Inc. | 0.01 | 0.00 | 0.16 | 49.52 | 0.0027 | 0.0007 | |||
| GOSS / Gossamer Bio, Inc. | 0.04 | 0.10 | 0.0018 | 0.0018 | |||||
| ALDX / Aldeyra Therapeutics, Inc. | 0.02 | 0.00 | 0.09 | 36.36 | 0.0016 | 0.0003 | |||
| HUMA / Humacyte, Inc. | 0.05 | 0.00 | 0.08 | -17.71 | 0.0014 | -0.0005 | |||
| REPL / Replimune Group, Inc. | 0.01 | 0.00 | 0.05 | -55.00 | 0.0008 | -0.0011 | |||
| PROK / ProKidney Corp. | 0.02 | 0.04 | 0.0007 | 0.0007 | |||||
| HES / Hess Corporation | 0.00 | -100.00 | 0.00 | 0.0000 | |||||
| SKX / Skechers U.S.A., Inc. | 0.00 | -100.00 | 0.00 | 0.0000 |