Estatísticas Básicas
| Valor do Portfólio | $ 43,913,742,883 |
| Posições Atuais | 63 |
Últimas Participações, Desempenho, AUM (de 13F, 13D)
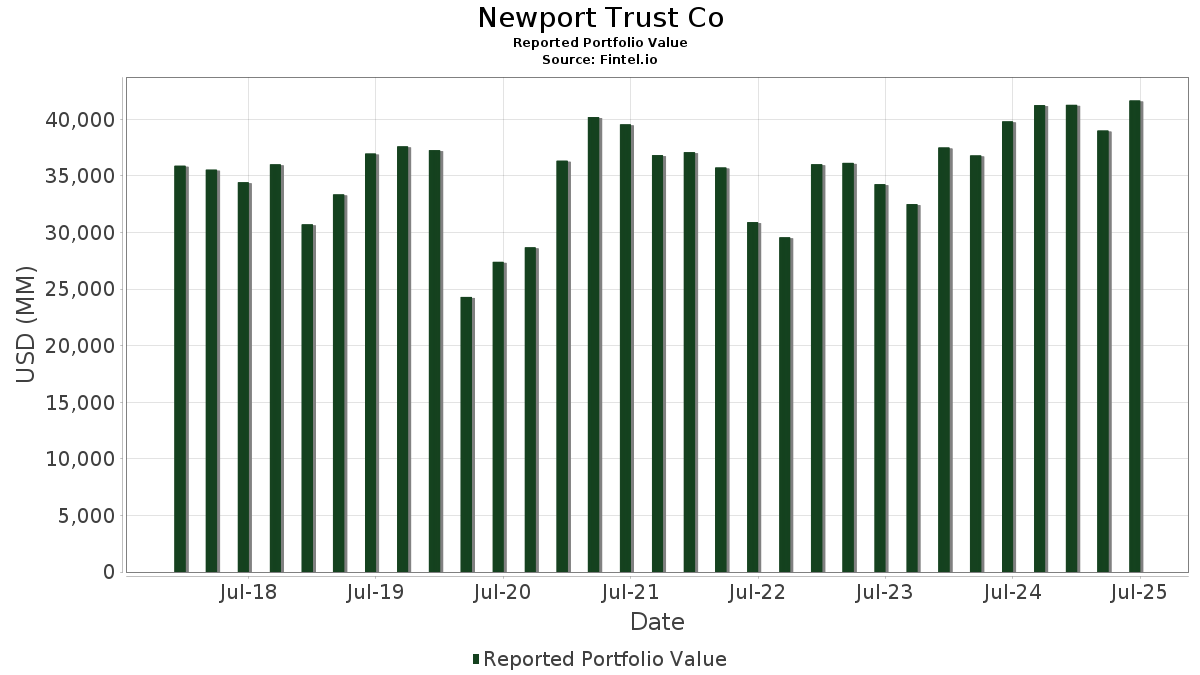
Newport Trust Co divulgou 63 participações totais em seus últimos arquivamentos da SEC. O valor mais recente da carteira é calculado como $ 43,913,742,883 USD. O Ativo Total Sob Gestão (AUM) é esse valor mais o caixa (que não é divulgado). As principais posições de Newport Trust Co são The Boeing Company (US:BA) , AT&T Inc. (US:T) , General Dynamics Corporation (US:GD) , Parsons Corporation (US:PSN) , and General Electric Company (US:GE) . As principais indústrias de Newport Trust Co são "Transportation Equipment" (sic 37) , and "General Merchandise Stores" (sic 53) .
Maiores Aumentos Este Trimestre
Usamos a mudança na alocação do portfólio porque esta é a métrica mais significativa. As mudanças podem ser devido a operações ou mudanças nos preços das ações.
| Ativo | Ações (MM) |
Valor (MM$) |
% do Portfólio | Δ% do Portfólio |
|---|---|---|---|---|
| 4.52 | 2,774.98 | 6.3192 | 1.6335 | |
| 13.96 | 4,760.03 | 10.8395 | 0.7443 | |
| 51.01 | 4,229.68 | 9.6318 | 0.6500 | |
| 9.96 | 2,995.56 | 6.8215 | 0.5919 | |
| 1.69 | 1,039.84 | 2.3679 | 0.1922 | |
| 12.21 | 1,098.47 | 2.5014 | 0.1679 | |
| 8.18 | 159.72 | 0.3637 | 0.1274 | |
| 9.22 | 523.03 | 1.1910 | 0.1029 | |
| 7.17 | 128.48 | 0.2926 | 0.0872 | |
| 3.33 | 321.43 | 0.7320 | 0.0791 |
Maiores Diminuições Este Trimestre
Usamos a mudança na alocação do portfólio porque esta é a métrica mais significativa. As mudanças podem ser devido a operações ou mudanças nos preços das ações.
| Ativo | Ações (MM) |
Valor (MM$) |
% do Portfólio | Δ% do Portfólio |
|---|---|---|---|---|
| 13.80 | 2,904.71 | 6.6146 | -1.3560 | |
| 185.32 | 5,233.45 | 11.9176 | -1.0811 | |
| 11.08 | 1,269.22 | 2.8903 | -0.4609 | |
| 1.02 | 330.88 | 0.7535 | -0.2233 | |
| 1.08 | 526.13 | 1.1981 | -0.1745 | |
| 1.86 | 354.24 | 0.8067 | -0.1689 | |
| 3.97 | 179.87 | 0.4096 | -0.1402 | |
| 4.63 | 607.38 | 1.3831 | -0.1399 | |
| 5.97 | 926.75 | 2.1104 | -0.1393 | |
| 2.17 | 170.54 | 0.3883 | -0.1125 |
Arquivamentos 13D/G
Esta é uma lista de arquivamentos 13D e 13G feitos no último ano (se houver). Clique no ícone de link para ver o histórico completo da transação. Linhas verdes indicam novas posições. Linhas vermelhas indicam posições fechadas.
| Data do Arquivo | Formulário | Ativo | Ações Anteriores |
Ações Atuais |
ΔAções % | % de Propriedade |
% Δde Propriedade | |
|---|---|---|---|---|---|---|---|---|
| 2025-11-12 | PSN / Parsons Corporation | 52,128,190 | 51,009,167 | -2.15 | 47.76 | -2.07 | ||
| 2025-11-12 | DDS / Dillard's, Inc. | 5,002,223 | 4,515,977 | -9.72 | 38.84 | -4.99 | ||
| 2025-02-06 | BA / The Boeing Company | 32,395,589 | 30,700,732 | -5.23 | 4.10 | -23.36 |
Arquivamentos 13F e Fundo
Este formulário foi arquivado em 2025-10-31 para o período de relatório 2025-09-30. Clique no ícone de link para ver o histórico completo da transação.
Atualize para desbloquear dados premium e exportar para Excel ![]() .
.
| Ativo | Tipo | Preço Médio por Ação | Ações (MM) |
ΔAções (%) |
Valor ($MM) |
ΔAções (%) |
Portfólio (%) |
ΔPortfólio (%) |
|
|---|---|---|---|---|---|---|---|---|---|
| BA / The Boeing Company | 29.20 | 2.48 | 6,301.90 | 5.56 | 14.3506 | 0.0189 | |||
| T / AT&T Inc. | 185.32 | -0.95 | 5,233.45 | -3.34 | 11.9176 | -1.0811 | |||
| GD / General Dynamics Corporation | 13.96 | -3.18 | 4,760.03 | 13.20 | 10.8395 | 0.7443 | |||
| PSN / Parsons Corporation | 51.01 | -2.15 | 4,229.68 | 13.06 | 9.6318 | 0.6500 | |||
| GE / General Electric Company | 9.96 | -1.22 | 2,995.56 | 15.44 | 6.8215 | 0.5919 | |||
| HON / Honeywell International Inc. | 13.80 | -3.21 | 2,904.71 | -12.51 | 6.6146 | -1.3560 | |||
| DDS / Dillard's, Inc. | 4.52 | -3.32 | 2,774.98 | 42.18 | 6.3192 | 1.6335 | |||
| F / Ford Motor Company | 144.56 | -2.62 | 1,728.91 | 7.34 | 3.9371 | 0.0703 | |||
| DIS / The Walt Disney Company | 11.08 | -1.52 | 1,269.22 | -9.07 | 2.8903 | -0.4609 | |||
| SRE / Sempra | 12.21 | -4.84 | 1,098.47 | 13.01 | 2.5014 | 0.1679 | |||
| GEV / GE Vernova Inc. | 1.69 | -1.26 | 1,039.84 | 14.74 | 2.3679 | 0.1922 | |||
| MMM / 3M Company | 5.97 | -2.98 | 926.75 | -1.10 | 2.1104 | -0.1393 | |||
| EMR / Emerson Electric Co. | 4.63 | -2.69 | 607.38 | -4.26 | 1.3831 | -0.1399 | |||
| COF / Capital One Financial Corporation | 2.55 | -0.52 | 541.98 | -0.61 | 1.2342 | -0.0749 | |||
| SPGI / S&P Global Inc. | 1.08 | -0.31 | 526.13 | -7.98 | 1.1981 | -0.1745 | |||
| WWD / Woodward, Inc. | 2.08 | -2.05 | 525.69 | 1.00 | 1.1971 | -0.0525 | |||
| DAL / Delta Air Lines, Inc. | 9.22 | 0.00 | 523.03 | 15.39 | 1.1910 | 0.1029 | |||
| ETR / Entergy Corporation | 5.39 | -1.47 | 501.86 | 10.47 | 1.1428 | 0.0521 | |||
| JCI / Johnson Controls International plc | 4.41 | -1.39 | 484.38 | 2.66 | 1.1030 | -0.0298 | |||
| NKE_KZ / NIKE, Inc. | 5.69 | -1.27 | 396.45 | -3.09 | 0.9028 | -0.0794 | |||
| DRI / Darden Restaurants, Inc. | 1.86 | -0.18 | 354.24 | -12.82 | 0.8067 | -0.1689 | |||
| HIG / The Hartford Insurance Group, Inc. | 2.53 | -1.51 | 337.79 | 3.55 | 0.7692 | -0.0139 | |||
| ELV / Elevance Health, Inc. | 1.02 | -2.11 | 330.88 | -18.68 | 0.7535 | -0.2233 | |||
| UAL / United Airlines Holdings, Inc. | 3.33 | -2.47 | 321.43 | 18.19 | 0.7320 | 0.0791 | |||
| XEL / Xcel Energy Inc. | 3.85 | -1.52 | 310.69 | 16.63 | 0.7075 | 0.0680 | |||
| HUM / Humana Inc. | 1.07 | -2.29 | 277.48 | 3.98 | 0.6319 | -0.0088 | |||
| NI / NiSource Inc. | 5.74 | -3.36 | 248.41 | 3.73 | 0.5657 | -0.0092 | |||
| HWM / Howmet Aerospace Inc. | 0.97 | -9.23 | 190.90 | -4.31 | 0.4347 | -0.0442 | |||
| HBAN / Huntington Bancshares Incorporated | 10.63 | -0.40 | 183.60 | 2.63 | 0.4181 | -0.0114 | |||
| LTM / LATAM Airlines Group S.A. - Depositary Receipt (Common Stock) | 3.97 | -29.46 | 179.87 | -21.46 | 0.4096 | -0.1402 | |||
| STT / State Street Corporation | 1.51 | -4.19 | 174.67 | 4.52 | 0.3978 | -0.0034 | |||
| BMO / Bank of Montreal | 1.32 | -1.78 | 172.18 | 15.64 | 0.3921 | 0.0346 | |||
| WHR / Whirlpool Corporation | 2.17 | 5.47 | 170.54 | -18.26 | 0.3883 | -0.1125 | |||
| WBD / Warner Bros. Discovery, Inc. | 8.18 | -4.80 | 159.72 | 62.24 | 0.3637 | 0.1274 | |||
| BTI / British American Tobacco p.l.c. - Depositary Receipt (Common Stock) | 2.60 | -5.01 | 138.12 | 6.53 | 0.3145 | 0.0033 | |||
| MCO / Moody's Corporation | 0.28 | -3.30 | 135.12 | -8.14 | 0.3077 | -0.0455 | |||
| M / Macy's, Inc. | 7.17 | -2.34 | 128.48 | 50.18 | 0.2926 | 0.0872 | |||
| BBY / Best Buy Co., Inc. | 1.16 | 0.18 | 87.70 | 12.85 | 0.1997 | 0.0131 | |||
| PM / Philip Morris International Inc. | 0.49 | -1.93 | 78.68 | -12.66 | 0.1792 | -0.0371 | |||
| KHC / The Kraft Heinz Company | 2.52 | -1.51 | 65.55 | -0.68 | 0.1493 | -0.0092 | |||
| WAT / Waters Corporation | 0.18 | 1.17 | 55.29 | -13.10 | 0.1259 | -0.0268 | |||
| VVV / Valvoline Inc. | 1.47 | -2.72 | 52.85 | -7.76 | 0.1204 | -0.0172 | |||
| ED / Consolidated Edison, Inc. | 0.50 | -1.97 | 50.58 | -1.80 | 0.1152 | -0.0085 | |||
| PNW / Pinnacle West Capital Corporation | 0.49 | -3.00 | 43.55 | -2.79 | 0.0992 | -0.0084 | |||
| BDC / Belden Inc. | 0.33 | 1.01 | 39.90 | 4.91 | 0.0909 | -0.0004 | |||
| DD / DuPont de Nemours, Inc. | 0.50 | -11.75 | 39.03 | 0.23 | 0.0889 | -0.0046 | |||
| OZK / Bank OZK | 0.59 | -13.05 | 30.22 | -5.81 | 0.0688 | -0.0082 | |||
| GT / The Goodyear Tire & Rubber Company | 3.72 | 4.49 | 27.84 | -24.63 | 0.0634 | -0.0253 | |||
| ASH / Ashland Inc. | 0.52 | -3.13 | 24.84 | -7.69 | 0.0566 | -0.0080 | |||
| BOH / Bank of Hawaii Corporation | 0.36 | -1.18 | 23.65 | -3.94 | 0.0539 | -0.0053 | |||
| MOS / The Mosaic Company | 0.56 | -1.47 | 19.28 | -6.33 | 0.0439 | -0.0055 | |||
| RAMP / LiveRamp Holdings, Inc. | 0.62 | -2.56 | 17.38 | -15.88 | 0.0396 | -0.0100 | |||
| TRMK / Trustmark Corporation | 0.43 | -6.79 | 17.02 | 1.23 | 0.0388 | -0.0016 | |||
| SFNC / Simmons First National Corporation | 0.54 | -8.33 | 10.45 | -7.32 | 0.0238 | -0.0033 | |||
| GNW / Genworth Financial, Inc. | 1.02 | -2.88 | 9.05 | 11.10 | 0.0206 | 0.0011 | |||
| SOLV / Solventum Corporation | 0.12 | -2.66 | 9.02 | -6.30 | 0.0206 | -0.0026 | |||
| MO / Altria Group, Inc. | 0.12 | -3.52 | 8.19 | 8.71 | 0.0187 | 0.0006 | |||
| BBWI / Bath & Body Works, Inc. | 0.29 | -4.49 | 7.38 | -23.47 | 0.0168 | -0.0064 | |||
| UIS / Unisys Corporation | 1.20 | -1.26 | 4.68 | -15.01 | 0.0107 | -0.0026 | |||
| MDLZ / Mondelez International, Inc. | 0.05 | -4.14 | 3.29 | -11.21 | 0.0075 | -0.0014 | |||
| VSCO / Victoria's Secret & Co. | 0.10 | -4.36 | 2.63 | 32.86 | 0.0060 | 0.0012 | |||
| MCB / Metropolitan Bank Holding Corp. | 0.01 | -8.34 | 0.69 | -2.14 | 0.0016 | -0.0001 | |||
| FTS / Fortis Inc. | 0.01 | 2.78 | 0.49 | 9.07 | 0.0011 | 0.0000 | |||
| WBA / Walgreens Boots Alliance, Inc. | 0.00 | -100.00 | 0.00 | 0.0000 |