Estatísticas Básicas
| Perfil do Insider | Senvest Management, LLC |
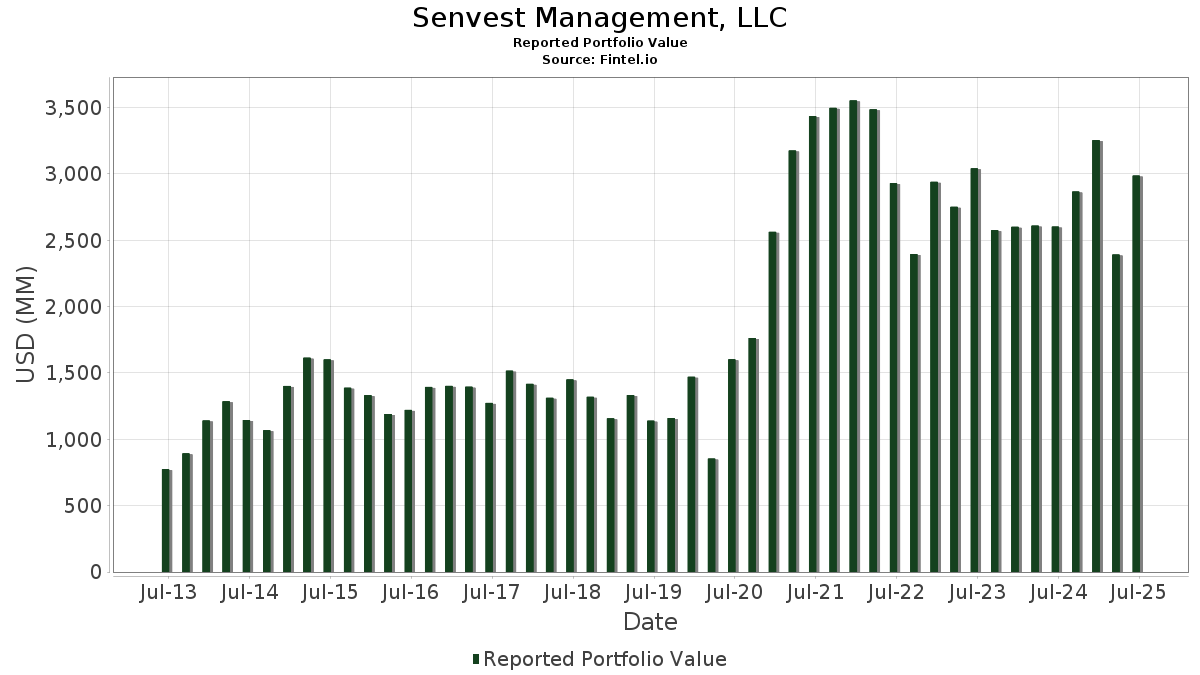
| Valor do Portfólio | $ 3,116,029,202 |
| Posições Atuais | 52 |
Últimas Participações, Desempenho, AUM (de 13F, 13D)
Senvest Management, LLC divulgou 52 participações totais em seus últimos arquivamentos da SEC. O valor mais recente da carteira é calculado como $ 3,116,029,202 USD. O Ativo Total Sob Gestão (AUM) é esse valor mais o caixa (que não é divulgado). As principais posições de Senvest Management, LLC são Wix.com Ltd. (US:WIX) , Tower Semiconductor Ltd. (US:TSEM) , EPAM Systems, Inc. (US:EPAM) , UiPath, Inc. (US:PATH) , and Illumina, Inc. (US:ILMN) . As novas posições de Senvest Management, LLC incluem AAON, Inc. (US:AAON) , monday.com Ltd. (US:MNDY) , Sportradar Group AG (US:SRAD) , Antero Resources Corporation (US:AR) , and Telesat Corporation (US:TSAT) . As principais indústrias de Senvest Management, LLC são "Food And Kindred Products" (sic 20) , "Engineering, Accounting, Research, Management, And Related Services" (sic 87) , and "Water Transportation" (sic 44) .
Maiores Aumentos Este Trimestre
Usamos a mudança na alocação do portfólio porque esta é a métrica mais significativa. As mudanças podem ser devido a operações ou mudanças nos preços das ações.
| Ativo | Ações (MM) |
Valor (MM$) |
% do Portfólio | Δ% do Portfólio |
|---|---|---|---|---|
| 2.49 | 442.06 | 14.1868 | 3.3592 | |
| 0.97 | 146.03 | 4.6863 | 2.0601 | |
| 2.42 | 65.59 | 2.1049 | 2.0441 | |
| 2.58 | 97.06 | 3.1148 | 1.2387 | |
| 5.60 | 405.02 | 12.9978 | 1.2002 | |
| 0.45 | 41.55 | 1.3334 | 1.1828 | |
| 0.26 | 57.14 | 1.8338 | 0.7552 | |
| 1.80 | 36.66 | 1.1764 | 0.7015 | |
| 8.27 | 102.44 | 3.2877 | 0.5672 | |
| 10.86 | 145.34 | 4.6642 | 0.4246 |
Maiores Diminuições Este Trimestre
Usamos a mudança na alocação do portfólio porque esta é a métrica mais significativa. As mudanças podem ser devido a operações ou mudanças nos preços das ações.
| Ativo | Ações (MM) |
Valor (MM$) |
% do Portfólio | Δ% do Portfólio |
|---|---|---|---|---|
| 0.55 | 40.57 | 1.3020 | -2.9998 | |
| 0.82 | 103.21 | 3.3122 | -1.1245 | |
| 1.01 | 53.29 | 1.7102 | -1.1208 | |
| 2.53 | 81.43 | 2.6131 | -1.0568 | |
| 3.98 | 53.72 | 1.7240 | -0.9239 | |
| 3.02 | 89.96 | 2.8869 | -0.8131 | |
| 0.00 | 0.00 | -0.7183 | ||
| 4.05 | 107.19 | 3.4401 | -0.5485 | |
| 0.00 | 0.00 | -0.4608 | ||
| 0.87 | 126.34 | 4.0546 | -0.4519 |
Arquivamentos 13D/G
Esta é uma lista de arquivamentos 13D e 13G feitos no último ano (se houver). Clique no ícone de link para ver o histórico completo da transação. Linhas verdes indicam novas posições. Linhas vermelhas indicam posições fechadas.
| Data do Arquivo | Formulário | Ativo | Ações Anteriores |
Ações Atuais |
ΔAções % | % de Propriedade |
% Δde Propriedade | |
|---|---|---|---|---|---|---|---|---|
| 2025-12-02 | WIX / Wix.com Ltd. | 2,834,280 | 5.20 | |||||
| 2025-11-13 | TSEM / Tower Semiconductor Ltd. | 7,174,598 | 5,601,887 | -21.92 | 5.00 | -23.08 | ||
| 2025-11-13 | CEVA / CEVA, Inc. | 1,894,223 | 2,209,771 | 16.66 | 9.30 | 16.25 | ||
| 2025-08-11 | AUDC / AudioCodes Ltd. | 2,543,368 | 1,904,209 | -25.13 | 6.50 | -20.73 | ||
| 2025-08-11 | VOYG / Voyager Technologies, Inc. | 2,815,648 | 5.40 | |||||
| 2025-08-11 | CRTO / Criteo S.A. - Depositary Receipt (Common Stock) | 3,639,479 | 4,071,880 | 11.88 | 7.70 | 16.67 | ||
| 2025-08-11 | LASR / nLIGHT, Inc. | 2,469,077 | 1,810,257 | -26.68 | 3.70 | -27.45 | ||
| 2025-08-11 | SATX / Satixfy Communications Ltd. | 4,268,562 | 0 | -100.00 | 0.00 | -100.00 | ||
| 2025-06-17 | LC / LendingClub Corporation | 5,748,093 | 5.00 | |||||
| 2025-05-14 | LOVE / The Lovesac Company | 1,106,767 | 1,272,634 | 14.99 | 8.20 | 13.89 | ||
| 2025-05-14 | MKFG / Markforged Holding Corporation | 15,930,998 | 640,819 | -95.98 | 3.10 | -61.25 | ||
| 2025-02-13 | AVDX / AvidXchange Holdings, Inc. | 10,384,164 | 4,886,655 | -52.94 | 2.40 | -52.00 |
Arquivamentos 13F e Fundo
Este formulário foi arquivado em 2025-11-14 para o período de relatório 2025-09-30. Clique no ícone de link para ver o histórico completo da transação.
Atualize para desbloquear dados premium e exportar para Excel ![]() .
.
| Ativo | Tipo | Preço Médio por Ação | Ações (MM) |
ΔAções (%) |
Valor ($MM) |
ΔAções (%) |
Portfólio (%) |
ΔPortfólio (%) |
|
|---|---|---|---|---|---|---|---|---|---|
| WIX / Wix.com Ltd. | 2.49 | 21.94 | 442.06 | 36.69 | 14.1868 | 3.3592 | |||
| TSEM / Tower Semiconductor Ltd. | 5.60 | -31.08 | 405.02 | 14.94 | 12.9978 | 1.2002 | |||
| EPAM / EPAM Systems, Inc. | 0.97 | 118.30 | 146.03 | 86.17 | 4.6863 | 2.0601 | |||
| PATH / UiPath, Inc. | 10.86 | 9.80 | 145.34 | 14.77 | 4.6642 | 0.4246 | |||
| ILMN / Illumina, Inc. | 1.41 | 2.08 | 134.04 | 1.61 | 4.3016 | -0.1149 | |||
| RH / RH | 0.65 | -11.73 | 131.61 | -5.12 | 4.2236 | -0.4206 | |||
| VAC / Marriott Vacations Worldwide Corporation | 1.91 | 5.17 | 127.13 | -3.19 | 4.0798 | -0.3167 | |||
| CIEN / Ciena Corporation | 0.87 | -47.59 | 126.34 | -6.14 | 4.0546 | -0.4519 | |||
| RDWR / Radware Ltd. | 4.05 | 0.00 | 107.19 | -10.02 | 3.4401 | -0.5485 | |||
| ALGN / Align Technology, Inc. | 0.82 | 17.76 | 103.21 | -22.12 | 3.3122 | -1.1245 | |||
| GENI / Genius Sports Limited | 8.27 | 5.91 | 102.44 | 26.08 | 3.2877 | 0.5672 | |||
| UNFI / United Natural Foods, Inc. | 2.58 | 7.32 | 97.06 | 73.21 | 3.1148 | 1.2387 | |||
| CRTO / Criteo S.A. - Depositary Receipt (Common Stock) | 4.23 | 3.82 | 95.54 | -2.08 | 3.0660 | -0.2004 | |||
| VOYG / Voyager Technologies, Inc. | 3.02 | 7.28 | 89.96 | -18.60 | 2.8869 | -0.8131 | |||
| LC / LendingClub Corporation | 5.42 | -7.89 | 82.29 | 16.31 | 2.6408 | 0.2720 | |||
| PINS / Pinterest, Inc. | 2.53 | -17.20 | 81.43 | -25.72 | 2.6131 | -1.0568 | |||
| NCNO / nCino, Inc. | 2.42 | 3,622.17 | 65.59 | 3,507.81 | 2.1049 | 2.0441 | |||
| CEVA / CEVA, Inc. | 2.21 | 2.70 | 58.36 | 23.40 | 1.8729 | 0.2895 | |||
| BA / The Boeing Company | 0.26 | 72.20 | 57.14 | 77.37 | 1.8338 | 0.7552 | |||
| KRNT / Kornit Digital Ltd. | 3.98 | 0.18 | 53.72 | -32.08 | 1.7240 | -0.9239 | |||
| BILL / BILL Holdings, Inc. | 1.01 | -44.96 | 53.29 | -36.98 | 1.7102 | -1.1208 | |||
| PFSI / PennyMac Financial Services, Inc. | 0.42 | 0.00 | 51.70 | 24.33 | 1.6591 | 0.2669 | |||
| OKTA / Okta, Inc. | 0.45 | 906.92 | 41.55 | 823.74 | 1.3334 | 1.1828 | |||
| BXP / Boston Properties, Inc. | 0.55 | -71.34 | 40.57 | -68.43 | 1.3020 | -2.9998 | |||
| AAT / American Assets Trust, Inc. | 1.80 | 151.19 | 36.66 | 158.45 | 1.1764 | 0.7015 | |||
| GSAT / Globalstar, Inc. | 0.87 | -34.79 | 31.57 | 0.76 | 1.0133 | -0.0358 | |||
| LASR / nLIGHT, Inc. | 0.90 | -50.25 | 26.68 | -25.10 | 0.8563 | -0.3364 | |||
| ACVA / ACV Auctions Inc. | 2.64 | 56.02 | 26.12 | -4.68 | 0.8382 | -0.0791 | |||
| CHKP / Check Point Software Technologies Ltd. | 0.11 | 114.71 | 23.23 | 100.80 | 0.7456 | 0.3582 | |||
| LOVE / The Lovesac Company | 1.17 | -8.87 | 19.79 | -15.23 | 0.6351 | -0.1465 | |||
| AUDC / AudioCodes Ltd. | 1.71 | -9.97 | 16.32 | -12.72 | 0.5237 | -0.1023 | |||
| DKS / DICK'S Sporting Goods, Inc. | 0.07 | 66.47 | 14.80 | 87.02 | 0.4749 | 0.2100 | |||
| EB2 / Elbit Systems Ltd. | 0.02 | 0.16 | 11.08 | 13.59 | 0.3556 | 0.0290 | |||
| EVLV / Evolv Technologies Holdings, Inc. | 1.05 | 0.00 | 7.91 | 20.99 | 0.2540 | 0.0350 | |||
| AMWL / American Well Corporation | 1.27 | -3.22 | 7.81 | -33.06 | 0.2508 | -0.1400 | |||
| CERS / Cerus Corporation | 3.97 | -1.01 | 6.30 | 11.63 | 0.2023 | 0.0132 | |||
| AAON / AAON, Inc. | 0.07 | 6.20 | 0.1991 | 0.1991 | |||||
| INTC / Intel Corporation | 0.18 | 6.04 | 0.1938 | 0.1938 | |||||
| MBLY / Mobileye Global Inc. | 0.39 | 410.99 | 5.50 | 301.39 | 0.1764 | 0.1305 | |||
| VRNS / Varonis Systems, Inc. | 0.08 | 0.00 | 4.70 | 13.23 | 0.1508 | 0.0119 | |||
| COMP / Compass, Inc. | 0.53 | 4.22 | 0.1353 | 0.1353 | |||||
| GOOG / Alphabet Inc. | 0.02 | 63.29 | 3.98 | 124.25 | 0.1276 | 0.0682 | |||
| MAPS / WM Technology, Inc. | 3.20 | 0.00 | 3.71 | 29.47 | 0.1190 | 0.0231 | |||
| TER / Teradyne, Inc. | 0.02 | -48.07 | 2.97 | -20.53 | 0.0954 | -0.0298 | |||
| MNDY / monday.com Ltd. | 0.01 | 2.91 | 0.0932 | 0.0932 | |||||
| SRAD / Sportradar Group AG | Put | 0.09 | 2.42 | 0.0777 | 0.0777 | ||||
| AR / Antero Resources Corporation | 0.05 | 1.68 | 0.0539 | 0.0539 | |||||
| DOUG / Douglas Elliman Inc. | 0.47 | 46.97 | 1.34 | 81.35 | 0.0431 | 0.0183 | |||
| CGNT / Cognyte Software Ltd. | 0.15 | 0.00 | 1.26 | -9.06 | 0.0403 | -0.0059 | |||
| TSAT / Telesat Corporation | 0.04 | 0.99 | 0.0317 | 0.0317 | |||||
| ASTL / Algoma Steel Group Inc. | 0.28 | 0.00 | 0.98 | -48.44 | 0.0314 | -0.0321 | |||
| RNTX / Rein Therapeutics Inc. | 0.23 | 0.00 | 0.26 | -18.27 | 0.0085 | -0.0023 | |||
| UNFI / United Natural Foods, Inc. | Call | 0.00 | -100.00 | 0.00 | -100.00 | -0.1834 | |||
| OZK / Bank OZK | 0.00 | -100.00 | 0.00 | 0.0000 | |||||
| LYFT / Lyft, Inc. | 0.00 | -100.00 | 0.00 | 0.0000 | |||||
| VRNT / Verint Systems Inc. | 0.00 | -100.00 | 0.00 | -100.00 | -0.7183 | ||||
| BX / Blackstone Inc. | 0.00 | -100.00 | 0.00 | 0.0000 | |||||
| GES / Guess?, Inc. | 0.00 | -100.00 | 0.00 | 0.0000 | |||||
| QRVO / Qorvo, Inc. | 0.00 | -100.00 | 0.00 | -100.00 | -0.4608 | ||||
| ARE / Alexandria Real Estate Equities, Inc. | 0.00 | -100.00 | 0.00 | 0.0000 |