Estatísticas Básicas
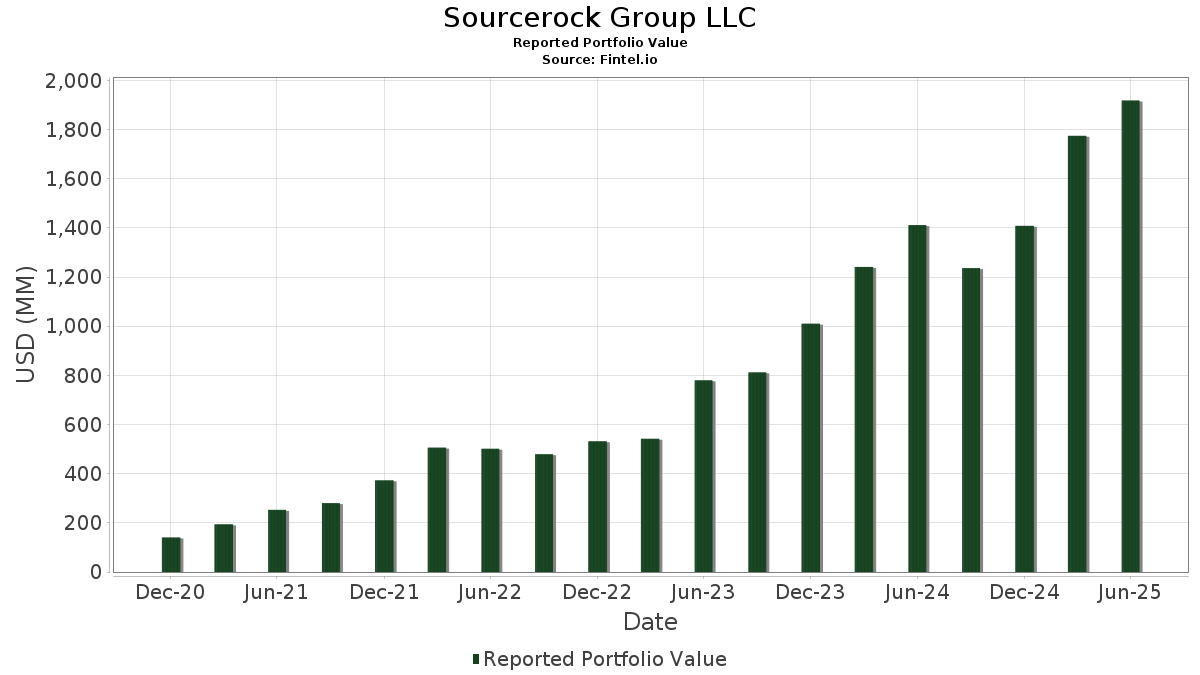
| Valor do Portfólio | $ 1,470,870,057 |
| Posições Atuais | 35 |
Últimas Participações, Desempenho, AUM (de 13F, 13D)
Sourcerock Group LLC divulgou 35 participações totais em seus últimos arquivamentos da SEC. O valor mais recente da carteira é calculado como $ 1,470,870,057 USD. O Ativo Total Sob Gestão (AUM) é esse valor mais o caixa (que não é divulgado). As principais posições de Sourcerock Group LLC são Antero Resources Corporation (US:AR) , California Resources Corporation (US:CRC) , Noble Corporation plc (US:NE) , Talos Energy Inc. (US:TALO) , and Chord Energy Corporation (US:CHRD) . As novas posições de Sourcerock Group LLC incluem Weatherford International plc (US:WFRD) , Generac Holdings Inc. (US:GNRC) , TMC the metals company Inc. (US:TMC) , The Andersons, Inc. (US:ANDE) , and MDU Resources Group, Inc. (US:MDU) . As principais indústrias de Sourcerock Group LLC são "Engineering, Accounting, Research, Management, And Related Services" (sic 87) , "Amusement And Recreation Services" (sic 79) , and "Heavy Construction Other Than Building Construction Contractors" (sic 16) .
Maiores Aumentos Este Trimestre
Usamos a mudança na alocação do portfólio porque esta é a métrica mais significativa. As mudanças podem ser devido a operações ou mudanças nos preços das ações.
| Ativo | Ações (MM) |
Valor (MM$) |
% do Portfólio | Δ% do Portfólio |
|---|---|---|---|---|
| 3.18 | 169.14 | 11.4992 | 6.7353 | |
| 2.64 | 77.52 | 5.2706 | 3.9326 | |
| 0.73 | 49.91 | 3.3931 | 3.3931 | |
| 0.88 | 42.93 | 2.9186 | 2.9186 | |
| 2.41 | 63.85 | 4.3413 | 2.8766 | |
| 10.70 | 102.63 | 6.9777 | 2.0287 | |
| 1.12 | 27.60 | 1.8765 | 1.6640 | |
| 0.11 | 18.09 | 1.2298 | 1.2298 | |
| 0.94 | 93.67 | 6.3685 | 1.1573 | |
| 2.53 | 16.13 | 1.0969 | 1.0969 |
Maiores Diminuições Este Trimestre
Usamos a mudança na alocação do portfólio porque esta é a métrica mais significativa. As mudanças podem ser devido a operações ou mudanças nos preços das ações.
| Ativo | Ações (MM) |
Valor (MM$) |
% do Portfólio | Δ% do Portfólio |
|---|---|---|---|---|
| 0.53 | 22.42 | 1.5242 | -2.9247 | |
| 1.22 | 40.03 | 2.7218 | -1.7913 | |
| 0.00 | 0.00 | -1.2333 | ||
| 5.42 | 28.41 | 1.9317 | -0.6856 | |
| 0.00 | 0.00 | -0.3238 | ||
| 0.07 | 16.69 | 1.1350 | -0.1539 | |
| 0.10 | 7.79 | 0.5296 | -0.1507 | |
| 0.00 | 0.00 | -0.1182 | ||
| 0.00 | 0.00 | -0.1177 |
Arquivamentos 13D/G
Esta é uma lista de arquivamentos 13D e 13G feitos no último ano (se houver). Clique no ícone de link para ver o histórico completo da transação. Linhas verdes indicam novas posições. Linhas vermelhas indicam posições fechadas.
| Data do Arquivo | Formulário | Ativo | Ações Anteriores |
Ações Atuais |
ΔAções % | % de Propriedade |
% Δde Propriedade | |
|---|---|---|---|---|---|---|---|---|
| 2025-11-14 | PUMP / ProPetro Holding Corp. | 8,408,391 | 5,422,407 | -35.51 | 5.20 | -35.80 | ||
| 2025-08-15 | TALO / Talos Energy Inc. | 7,465,773 | 11,193,177 | 49.93 | 6.30 | 5.00 |
Arquivamentos 13F e Fundo
Este formulário foi arquivado em 2025-11-14 para o período de relatório 2025-09-30. Clique no ícone de link para ver o histórico completo da transação.
Atualize para desbloquear dados premium e exportar para Excel ![]() .
.
| Ativo | Tipo | Preço Médio por Ação | Ações (MM) |
ΔAções (%) |
Valor ($MM) |
ΔAções (%) |
Portfólio (%) |
ΔPortfólio (%) |
|
|---|---|---|---|---|---|---|---|---|---|
| AR / Antero Resources Corporation | 7.79 | -4.54 | 261.30 | -20.46 | 17.7652 | 0.6359 | |||
| CRC / California Resources Corporation | 3.18 | 58.97 | 169.14 | 85.12 | 11.4992 | 6.7353 | |||
| NE / Noble Corporation plc | 4.25 | -17.97 | 120.27 | -12.63 | 8.1766 | 0.9999 | |||
| TALO / Talos Energy Inc. | 10.70 | -4.39 | 102.63 | 8.13 | 6.9777 | 2.0287 | |||
| CHRD / Chord Energy Corporation | 0.94 | -8.65 | 93.67 | -6.28 | 6.3685 | 1.1573 | |||
| CENX / Century Aluminum Company | 2.64 | 85.41 | 77.52 | 202.10 | 5.2706 | 3.9326 | |||
| PTEN / Patterson-UTI Energy, Inc. | 13.13 | -4.89 | 68.01 | -16.92 | 4.6236 | 0.3557 | |||
| PBE / Peabody Energy Corporation | 2.41 | 15.02 | 63.85 | 127.31 | 4.3413 | 2.8766 | |||
| WFRD / Weatherford International plc | 0.73 | 49.91 | 3.3931 | 3.3931 | |||||
| OKE / ONEOK, Inc. | 0.64 | 17.97 | 46.87 | 5.46 | 3.1867 | 0.8693 | |||
| VAL / Valaris Limited | 0.88 | 42.93 | 2.9186 | 2.9186 | |||||
| AA / Alcoa Corporation | 1.22 | -58.50 | 40.03 | -53.75 | 2.7218 | -1.7913 | |||
| PCG / PG&E Corporation | 2.45 | 7.31 | 36.98 | 16.09 | 2.5139 | 0.8532 | |||
| PUMP / ProPetro Holding Corp. | 5.42 | -35.51 | 28.41 | -43.40 | 1.9317 | -0.6856 | |||
| HAL / Halliburton Company | 1.12 | 461.00 | 27.60 | 577.16 | 1.8765 | 1.6640 | |||
| UGI / UGI Corporation | 0.72 | 26.83 | 23.82 | 15.83 | 1.6192 | 0.5471 | |||
| FLR / Fluor Corporation | 0.53 | -67.98 | 22.42 | -73.73 | 1.5242 | -2.9247 | |||
| XEL / Xcel Energy Inc. | 0.24 | 67.73 | 19.16 | 98.66 | 1.3028 | 0.7999 | |||
| TRP / TC Energy Corporation | 0.35 | 11.93 | 18.84 | 24.82 | 1.2811 | 0.4940 | |||
| GNRC / Generac Holdings Inc. | 0.11 | 18.09 | 1.2298 | 1.2298 | |||||
| LNG / Cheniere Energy, Inc. | 0.07 | -30.01 | 16.69 | -32.46 | 1.1350 | -0.1539 | |||
| TMC / TMC the metals company Inc. | 2.53 | 16.13 | 1.0969 | 1.0969 | |||||
| SWX / Southwest Gas Holdings, Inc. | 0.20 | 66.19 | 15.65 | 75.02 | 1.0640 | 0.5978 | |||
| SDRL / Seadrill Limited | 0.39 | 11.81 | 0.8029 | 0.8029 | |||||
| CMS / CMS Energy Corporation | 0.16 | 115.65 | 11.49 | 128.06 | 0.7809 | 0.5183 | |||
| LNT / Alliant Energy Corporation | 0.15 | 10.11 | 0.6875 | 0.6875 | |||||
| ANDE / The Andersons, Inc. | 0.24 | 9.55 | 0.6496 | 0.6496 | |||||
| EE / Excelerate Energy, Inc. | 0.38 | 838.09 | 9.45 | 706.48 | 0.6426 | 0.5815 | |||
| SR / Spire Inc. | 0.10 | -46.54 | 7.79 | -40.29 | 0.5296 | -0.1507 | |||
| APA / APA Corporation | 0.30 | 7.28 | 0.4952 | 0.4952 | |||||
| GLNG / Golar LNG Limited | 0.17 | -5.77 | 6.78 | -7.55 | 0.4612 | 0.0786 | |||
| MDU / MDU Resources Group, Inc. | 0.30 | 5.35 | 0.3638 | 0.3638 | |||||
| HOND / HCM II Acquisition Corp. | 0.26 | 4.23 | 0.2877 | 0.2877 | |||||
| WTRG / Essential Utilities, Inc. | 0.10 | 3.96 | 0.2689 | 0.2689 | |||||
| RIG / Transocean Ltd. | 1.00 | 3.12 | 0.2121 | 0.2121 | |||||
| DTM / DT Midstream, Inc. | 0.00 | -100.00 | 0.00 | 0.0000 | |||||
| EQT / EQT Corporation | 0.00 | -100.00 | 0.00 | 0.0000 | |||||
| KGS / Kodiak Gas Services, Inc. | 0.00 | -100.00 | 0.00 | -100.00 | -0.3238 | ||||
| XOP / SPDR Series Trust - State Street SPDR S&P Oil & Gas Exploration & Production ETF | 0.00 | -100.00 | 0.00 | -100.00 | -0.1177 | ||||
| RRC / Range Resources Corporation | 0.00 | -100.00 | 0.00 | 0.0000 | |||||
| CIVI / Civitas Resources, Inc. | 0.00 | -100.00 | 0.00 | 0.0000 | |||||
| LBRT / Liberty Energy Inc. | 0.00 | -100.00 | 0.00 | -100.00 | -1.2333 | ||||
| CCJ / Cameco Corporation | 0.00 | -100.00 | 0.00 | 0.0000 | |||||
| DVN / Devon Energy Corporation | 0.00 | -100.00 | 0.00 | 0.0000 | |||||
| HLX / Helix Energy Solutions Group, Inc. | 0.00 | -100.00 | 0.00 | -100.00 | -0.1182 | ||||
| KMI / Kinder Morgan, Inc. | 0.00 | -100.00 | 0.00 | 0.0000 | |||||
| VG / Venture Global, Inc. | 0.00 | -100.00 | 0.00 | 0.0000 | |||||
| CTRA / Coterra Energy Inc. | 0.00 | -100.00 | 0.00 | 0.0000 | |||||
| FCX / Freeport-McMoRan Inc. | 0.00 | -100.00 | 0.00 | 0.0000 | |||||
| PR / Permian Resources Corporation | 0.00 | -100.00 | 0.00 | 0.0000 | |||||
| TS / Tenaris S.A. - Depositary Receipt (Common Stock) | 0.00 | -100.00 | 0.00 | 0.0000 |