Estatísticas Básicas
| Perfil do Insider | TORTOISE CAPITAL ADVISORS, L.L.C. |
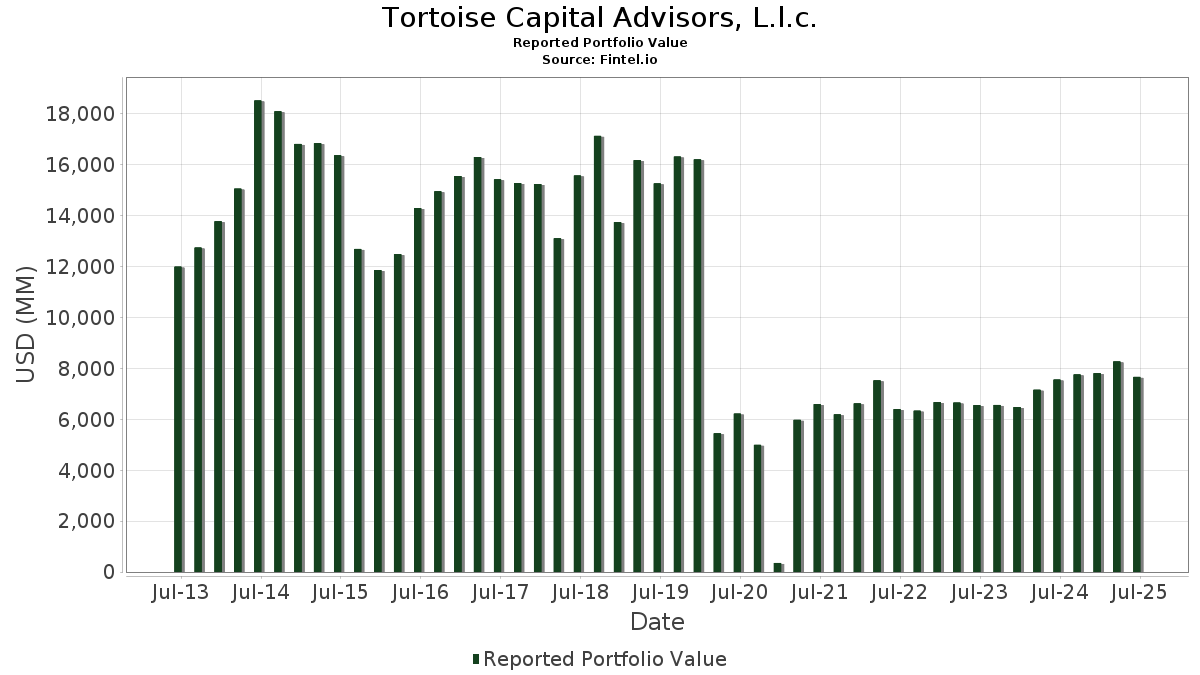
| Valor do Portfólio | $ 7,753,884,164 |
| Posições Atuais | 82 |
Últimas Participações, Desempenho, AUM (de 13F, 13D)
Tortoise Capital Advisors, L.l.c. divulgou 82 participações totais em seus últimos arquivamentos da SEC. O valor mais recente da carteira é calculado como $ 7,753,884,164 USD. O Ativo Total Sob Gestão (AUM) é esse valor mais o caixa (que não é divulgado). As principais posições de Tortoise Capital Advisors, L.l.c. são The Williams Companies, Inc. (US:WMB) , MPLX LP - Limited Partnership (US:MPLX) , Energy Transfer LP - Limited Partnership (US:ET) , Cheniere Energy, Inc. (US:LNG) , and TC Energy Corporation (US:TRP) . As novas posições de Tortoise Capital Advisors, L.l.c. incluem Talen Energy Corporation (US:TLN) , Vertiv Holdings Co (US:VRT) , Dell Technologies Inc. (US:DELL) , Quanta Services, Inc. (US:PWR) , and Digital Realty Trust, Inc. (US:DLR) . As principais indústrias de Tortoise Capital Advisors, L.l.c. são "Business Services" (sic 73) , "Wholesale Trade-durable Goods" (sic 50) , and "Engineering, Accounting, Research, Management, And Related Services" (sic 87) .
Maiores Aumentos Este Trimestre
Usamos a mudança na alocação do portfólio porque esta é a métrica mais significativa. As mudanças podem ser devido a operações ou mudanças nos preços das ações.
| Ativo | Ações (MM) |
Valor (MM$) |
% do Portfólio | Δ% do Portfólio |
|---|---|---|---|---|
| 0.10 | 42.79 | 0.5519 | 0.5519 | |
| 7.48 | 377.56 | 4.8693 | 0.4528 | |
| 1.51 | 136.31 | 1.7580 | 0.3502 | |
| 0.25 | 40.55 | 0.2920 | 0.2920 | |
| 0.27 | 29.06 | 0.3748 | 0.2482 | |
| 0.38 | 30.78 | 0.3970 | 0.1644 | |
| 1.29 | 98.01 | 1.2641 | 0.1229 | |
| 10.99 | 696.06 | 8.9769 | 0.0818 | |
| 0.03 | 5.78 | 0.0746 | 0.0746 | |
| 0.24 | 9.64 | 0.1243 | 0.0723 |
Maiores Diminuições Este Trimestre
Usamos a mudança na alocação do portfólio porque esta é a métrica mais significativa. As mudanças podem ser devido a operações ou mudanças nos preços das ações.
| Ativo | Ações (MM) |
Valor (MM$) |
% do Portfólio | Δ% do Portfólio |
|---|---|---|---|---|
| 14.65 | 458.17 | 3.2995 | -2.7265 | |
| 5.29 | 385.98 | 2.7797 | -2.6828 | |
| 9.15 | 497.92 | 3.5858 | -2.0598 | |
| 7.38 | 289.77 | 2.0868 | -1.6574 | |
| 4.70 | 162.22 | 2.0921 | -1.5003 | |
| 2.70 | 304.72 | 2.1944 | -1.4788 | |
| 11.38 | 221.16 | 1.5927 | -1.1071 | |
| 3.98 | 160.95 | 1.1591 | -0.7368 | |
| 2.62 | 74.15 | 0.5340 | -0.6557 | |
| 2.67 | 626.93 | 8.0854 | -0.5654 |
Arquivamentos 13D/G
Esta é uma lista de arquivamentos 13D e 13G feitos no último ano (se houver). Clique no ícone de link para ver o histórico completo da transação. Linhas verdes indicam novas posições. Linhas vermelhas indicam posições fechadas.
| Data do Arquivo | Formulário | Ativo | Ações Anteriores |
Ações Atuais |
ΔAções % | % de Propriedade |
% Δde Propriedade | |
|---|---|---|---|---|---|---|---|---|
| 2025-11-14 | HES / Hess Corporation | 4,390,759 | 4,827,169 | 9.94 | 3.70 | -42.19 |
Arquivamentos 13F e Fundo
Este formulário foi arquivado em 2025-11-13 para o período de relatório 2025-09-30. Clique no ícone de link para ver o histórico completo da transação.
Atualize para desbloquear dados premium e exportar para Excel ![]() .
.
| Ativo | Tipo | Preço Médio por Ação | Ações (MM) |
ΔAções (%) |
Valor ($MM) |
ΔAções (%) |
Portfólio (%) |
ΔPortfólio (%) |
|
|---|---|---|---|---|---|---|---|---|---|
| WMB / The Williams Companies, Inc. | 10.99 | 1.21 | 696.06 | 2.08 | 8.9769 | 0.0818 | |||
| MPLX / MPLX LP - Limited Partnership | 13.52 | 2.50 | 675.35 | -0.61 | 8.7098 | -0.1536 | |||
| ET / Energy Transfer LP - Limited Partnership | 38.57 | 3.48 | 661.91 | -2.06 | 8.5364 | -0.2792 | |||
| LNG / Cheniere Energy, Inc. | 2.67 | -2.03 | 626.93 | -5.46 | 8.0854 | -0.5654 | |||
| TRP / TC Energy Corporation | 9.15 | 3.17 | 497.92 | 15.05 | 3.5858 | -2.0598 | |||
| TRGP / Targa Resources Corp. | 2.82 | -1.06 | 471.87 | -4.78 | 6.0856 | -0.3786 | |||
| EPD / Enterprise Products Partners L.P. - Limited Partnership | 14.65 | -1.64 | 458.17 | -0.82 | 3.2995 | -2.7265 | |||
| OKE / ONEOK, Inc. | 5.29 | 3.11 | 385.98 | -7.83 | 2.7797 | -2.6828 | |||
| EBGEF / Enbridge Inc. - Preferred Stock | 7.48 | 0.16 | 377.56 | 11.52 | 4.8693 | 0.4528 | |||
| DTM / DT Midstream, Inc. | 2.70 | 5.20 | 304.72 | 8.21 | 2.1944 | -1.4788 | |||
| WES / Western Midstream Partners, LP - Limited Partnership | 7.38 | -0.56 | 289.77 | 0.96 | 2.0868 | -1.6574 | |||
| KMI / Kinder Morgan, Inc. | 8.97 | -4.28 | 253.85 | -7.83 | 3.2739 | -0.3188 | |||
| AM / Antero Midstream Corporation | 11.38 | 4.17 | 221.16 | 6.86 | 1.5927 | -1.1071 | |||
| PAGP / Plains GP Holdings, L.P. - Limited Partnership | 11.82 | 1.56 | 215.59 | -4.66 | 2.7804 | -0.1692 | |||
| HESM / Hess Midstream LP | 4.70 | -34.34 | 162.22 | -41.09 | 2.0921 | -1.5003 | |||
| PBA / Pembina Pipeline Corporation | 3.98 | 2.79 | 160.95 | 10.74 | 1.1591 | -0.7368 | |||
| PAA / Plains All American Pipeline, L.P. - Limited Partnership | 9.28 | -2.22 | 158.26 | -8.95 | 2.0410 | -0.2263 | |||
| SRE / Sempra | 1.51 | 6.36 | 136.31 | 26.31 | 1.7580 | 0.3502 | |||
| EVRG / Evergy, Inc. | 1.29 | 1.60 | 98.01 | 12.05 | 1.2641 | 0.1229 | |||
| CWEN / Clearway Energy, Inc. | 2.62 | -7.90 | 74.15 | -18.69 | 0.5340 | -0.6557 | |||
| SUN / Sunoco LP - Limited Partnership | 1.46 | 3.71 | 72.86 | -3.21 | 0.5247 | -0.4573 | |||
| VST / Vistra Corp. | 0.36 | 4.29 | 71.01 | 5.43 | 0.5114 | -0.3673 | |||
| CEG / Constellation Energy Corporation | 0.19 | 22.45 | 64.06 | 24.85 | 0.4613 | -0.2080 | |||
| TLN / Talen Energy Corporation | 0.10 | 42.79 | 0.5519 | 0.5519 | |||||
| CQP / Cheniere Energy Partners, L.P. - Limited Partnership | 0.79 | -1.09 | 42.75 | -5.02 | 0.5513 | -0.0358 | |||
| NRG / NRG Energy, Inc. | 0.25 | 40.55 | 0.2920 | 0.2920 | |||||
| VG / Venture Global, Inc. | 2.66 | 0.42 | 37.77 | -8.54 | 0.4871 | -0.0516 | |||
| EQT / EQT Corporation | 0.66 | 11.94 | 35.92 | 4.48 | 0.2587 | -0.1898 | |||
| XEL / Xcel Energy Inc. | 0.38 | 45.82 | 30.78 | 72.69 | 0.3970 | 0.1644 | |||
| EE / Excelerate Energy, Inc. | 1.21 | 0.25 | 30.55 | -13.87 | 0.3940 | -0.0687 | |||
| ETR / Entergy Corporation | 0.32 | 18.53 | 29.37 | 32.89 | 0.2115 | -0.0768 | |||
| EXE / Expand Energy Corporation | 0.27 | 229.60 | 29.06 | 199.44 | 0.3748 | 0.2482 | |||
| KGS / Kodiak Gas Services, Inc. | 0.73 | -1.08 | 26.90 | 6.71 | 0.1937 | -0.1351 | |||
| SOBO / South Bow Corporation | 0.94 | 1.21 | 26.67 | 10.51 | 0.1921 | -0.1228 | |||
| NI / NiSource Inc. | 0.59 | -0.15 | 25.69 | 7.18 | 0.3313 | 0.0186 | |||
| CNP / CenterPoint Energy, Inc. | 0.65 | -0.16 | 25.18 | 5.44 | 0.1813 | -0.1302 | |||
| WEC / WEC Energy Group, Inc. | 0.17 | -0.23 | 19.73 | 9.72 | 0.1421 | -0.0925 | |||
| CMS / CMS Energy Corporation | 0.22 | -24.28 | 16.15 | -19.93 | 0.2083 | -0.0548 | |||
| PSX / Phillips 66 | 0.12 | -2.91 | 15.74 | 10.70 | 0.1133 | -0.0721 | |||
| XOM / Exxon Mobil Corporation | 0.14 | -17.09 | 15.56 | -13.28 | 0.2007 | -0.0334 | |||
| KNTK / Kinetik Holdings Inc. | 0.36 | 0.25 | 15.52 | -2.73 | 0.1117 | -0.0963 | |||
| DTE / DTE Energy Company | 0.11 | -25.42 | 15.37 | -20.37 | 0.1107 | -0.1411 | |||
| AR / Antero Resources Corporation | 0.39 | 67.68 | 13.09 | 39.71 | 0.1689 | 0.0466 | |||
| OVV / Ovintiv Inc. | 0.24 | 127.73 | 9.64 | 141.69 | 0.1243 | 0.0723 | |||
| CTRA / Coterra Energy Inc. | 0.38 | -3.28 | 8.90 | -9.88 | 0.1148 | -0.0140 | |||
| DVN / Devon Energy Corporation | 0.22 | -3.61 | 7.86 | 6.23 | 0.1013 | 0.0049 | |||
| VLO / Valero Energy Corporation | 0.03 | 5.78 | 0.0746 | 0.0746 | |||||
| MPC / Marathon Petroleum Corporation | 0.03 | -3.12 | 5.54 | 12.43 | 0.0714 | 0.0072 | |||
| SO / The Southern Company | 0.04 | -1.39 | 3.66 | 1.75 | 0.0472 | 0.0003 | |||
| VRT / Vertiv Holdings Co | 0.02 | 3.65 | 0.0471 | 0.0471 | |||||
| DELL / Dell Technologies Inc. | 0.02 | 2.90 | 0.0374 | 0.0374 | |||||
| PWR / Quanta Services, Inc. | 0.01 | 2.46 | 0.0318 | 0.0318 | |||||
| NVT / nVent Electric plc | 0.02 | 2.19 | 0.0158 | 0.0158 | |||||
| DLR / Digital Realty Trust, Inc. | 0.01 | 2.02 | 0.0260 | 0.0260 | |||||
| ANET / Arista Networks, Inc. | 0.01 | 1.99 | 0.0256 | 0.0256 | |||||
| MTZ / MasTec, Inc. | 0.01 | 1.97 | 0.0254 | 0.0254 | |||||
| CIFR / Cipher Mining Inc. | 0.15 | 1.83 | 0.0236 | 0.0236 | |||||
| CIEN / Ciena Corporation | 0.01 | 1.83 | 0.0236 | 0.0236 | |||||
| PRIM / Primoris Services Corporation | 0.01 | 1.66 | 0.0214 | 0.0214 | |||||
| GEV / GE Vernova Inc. | 0.00 | 1.64 | 0.0211 | 0.0211 | |||||
| RIOT / Riot Platforms, Inc. | 0.08 | 1.57 | 0.0203 | 0.0203 | |||||
| EQIX / Equinix, Inc. | 0.00 | 1.57 | 0.0202 | 0.0202 | |||||
| PSTG / Pure Storage, Inc. | 0.02 | 1.51 | 0.0195 | 0.0195 | |||||
| WULF / TeraWulf Inc. | 0.12 | 1.40 | 0.0181 | 0.0181 | |||||
| TT / Trane Technologies plc | 0.00 | 1.30 | 0.0168 | 0.0168 | |||||
| GLP / Global Partners LP - Limited Partnership | 0.02 | 0.00 | 1.17 | -8.96 | 0.0084 | -0.0083 | |||
| NTAP / NetApp, Inc. | 0.01 | 1.15 | 0.0148 | 0.0148 | |||||
| SMCI / Super Micro Computer, Inc. | 0.02 | 0.96 | 0.0124 | 0.0124 | |||||
| CMI / Cummins Inc. | 0.00 | 0.84 | 0.0109 | 0.0109 | |||||
| MOD / Modine Manufacturing Company | 0.01 | 0.82 | 0.0106 | 0.0106 | |||||
| NEE / NextEra Energy, Inc. | 0.01 | 55.91 | 0.74 | 69.50 | 0.0095 | 0.0038 | |||
| CARR / Carrier Global Corporation | 0.01 | 0.74 | 0.0095 | 0.0095 | |||||
| MYRG / MYR Group Inc. | 0.00 | 0.69 | 0.0089 | 0.0089 | |||||
| APH / Amphenol Corporation | 0.01 | 0.65 | 0.0084 | 0.0084 | |||||
| NVDA / NVIDIA Corporation | 0.00 | 0.62 | 0.0080 | 0.0080 | |||||
| GEL / Genesis Energy, L.P. - Limited Partnership | 0.03 | 0.00 | 0.54 | -3.05 | 0.0070 | -0.0003 | |||
| XIFR / XPLR Infrastructure, LP - Limited Partnership | 0.05 | -1.37 | 0.48 | 22.37 | 0.0061 | 0.0011 | |||
| NGL / NGL Energy Partners LP - Limited Partnership | 0.07 | 0.00 | 0.41 | 40.55 | 0.0029 | -0.0009 | |||
| APLD / Applied Digital Corporation | 0.02 | 0.41 | 0.0053 | 0.0053 | |||||
| WDC / Western Digital Corporation | 0.00 | 0.40 | 0.0051 | 0.0051 | |||||
| CLS / Celestica Inc. | 0.00 | 0.33 | 0.0042 | 0.0042 | |||||
| TEAF / Ecofin Sustainable and Social Impact Term Fund | 0.02 | 0.00 | 0.23 | -4.22 | 0.0029 | -0.0002 | |||
| COP / ConocoPhillips | 0.00 | -100.00 | 0.00 | -100.00 | -0.0850 | ||||
| FANG / Diamondback Energy, Inc. | 0.00 | -100.00 | 0.00 | 0.0000 | |||||
| WLKP / Westlake Chemical Partners LP - Limited Partnership | 0.00 | -100.00 | 0.00 | -100.00 | -0.0338 |