Estatísticas Básicas
| Perfil do Insider | Turtle Creek Asset Management Inc. |
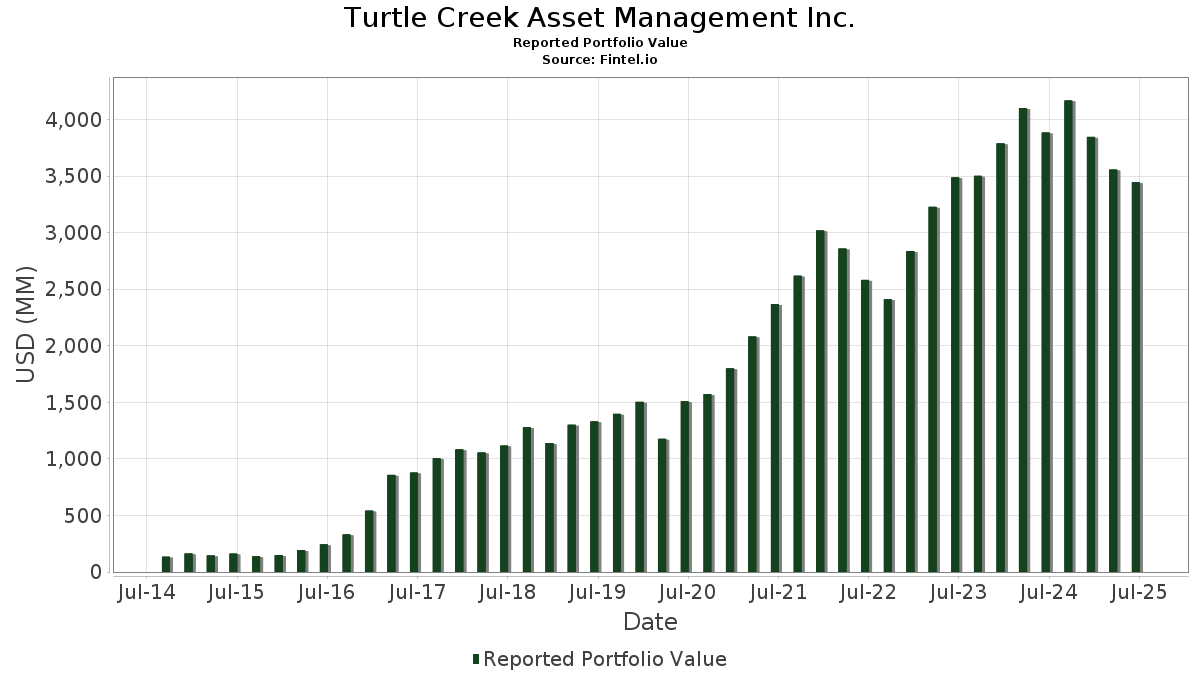
| Valor do Portfólio | $ 3,313,434,035 |
| Posições Atuais | 41 |
Últimas Participações, Desempenho, AUM (de 13F, 13D)
Turtle Creek Asset Management Inc. divulgou 41 participações totais em seus últimos arquivamentos da SEC. O valor mais recente da carteira é calculado como $ 3,313,434,035 USD. O Ativo Total Sob Gestão (AUM) é esse valor mais o caixa (que não é divulgado). As principais posições de Turtle Creek Asset Management Inc. são Celanese Corporation (US:CE) , The Middleby Corporation (US:MIDD) , Brunswick Corporation (US:BC) , WillScot Holdings Corporation (US:WSC) , and Bread Financial Holdings, Inc. (US:BFH) . As novas posições de Turtle Creek Asset Management Inc. incluem WEX Inc. (US:WEX) , The Ensign Group, Inc. (US:ENSG) , ArcBest Corporation (US:ARCB) , . As principais indústrias de Turtle Creek Asset Management Inc. são "Building Materials, Hardware, Garden Supply, And Mobile Home Dealers" (sic 52) , "Printing, Publishing, And Allied Industries" (sic 27) , and "Electronic And Other Electrical Equipment And Components, Except Computer Equipment" (sic 36) .
Maiores Aumentos Este Trimestre
Usamos a mudança na alocação do portfólio porque esta é a métrica mais significativa. As mudanças podem ser devido a operações ou mudanças nos preços das ações.
| Ativo | Ações (MM) |
Valor (MM$) |
% do Portfólio | Δ% do Portfólio |
|---|---|---|---|---|
| FI / Fiserv, Inc. | 0.78 | 100.24 | 3.0252 | 3.0252 |
| WEX / WEX Inc. | 0.59 | 93.29 | 2.8155 | 2.8155 |
| ENSG / The Ensign Group, Inc. | 0.46 | 78.84 | 2.3794 | 2.3794 |
| WSC / WillScot Holdings Corporation | 8.73 | 184.30 | 5.5621 | 1.5177 |
| CCOI / Cogent Communications Holdings, Inc. | 4.60 | 176.56 | 5.3286 | 1.4204 |
| ARCB / ArcBest Corporation | 0.57 | 39.51 | 1.1924 | 1.1924 |
| JELD / JELD-WEN Holding, Inc. | 16.63 | 81.63 | 2.4637 | 0.6183 |
| EEFT / Euronet Worldwide, Inc. | 0.96 | 83.89 | 2.5318 | 0.4551 |
| GIL / Gildan Activewear Inc. | 1.47 | 85.25 | 2.5729 | 0.2992 |
| ECPG / Encore Capital Group, Inc. | 1.95 | 81.29 | 2.4533 | 0.1616 |
Maiores Diminuições Este Trimestre
Usamos a mudança na alocação do portfólio porque esta é a métrica mais significativa. As mudanças podem ser devido a operações ou mudanças nos preços das ações.
| Ativo | Ações (MM) |
Valor (MM$) |
% do Portfólio | Δ% do Portfólio |
|---|---|---|---|---|
| OTEX / Open Text Corporation | 0.05 | 1.99 | 0.0600 | -2.6138 |
| BWA / BorgWarner Inc. | 0.79 | 34.85 | 1.0517 | -2.4261 |
| AMCR / Amcor plc | 0.00 | 0.00 | -2.2410 | |
| KMX / CarMax, Inc. | 2.71 | 121.48 | 3.6664 | -1.5833 |
| ATS / ATS Corporation | 6.97 | 182.69 | 5.5137 | -1.5106 |
| DOOO / BRP Inc. | 1.72 | 104.40 | 3.1509 | -1.0508 |
| CIGI / Colliers International Group Inc. | 0.82 | 127.49 | 3.8476 | -0.8910 |
| BFH / Bread Financial Holdings, Inc. | 3.28 | 183.12 | 5.5267 | -0.4334 |
| VNT / Vontier Corporation | 1.80 | 75.71 | 2.2851 | -0.4200 |
| CE / Celanese Corporation | 5.12 | 215.25 | 6.4964 | -0.2938 |
Arquivamentos 13D/G
Esta é uma lista de arquivamentos 13D e 13G feitos no último ano (se houver). Clique no ícone de link para ver o histórico completo da transação. Linhas verdes indicam novas posições. Linhas vermelhas indicam posições fechadas.
| Data do Arquivo | Formulário | Ativo | Ações Anteriores |
Ações Atuais |
ΔAções % | % de Propriedade |
% Δde Propriedade | |
|---|---|---|---|---|---|---|---|---|
| 2025-11-14 | CCOI / Cogent Communications Holdings, Inc. | 2,792,711 | 4,603,933 | 64.86 | 9.40 | 64.91 | ||
| 2025-11-14 | DOOO / BRP Inc. | 2,986,371 | 1,717,746 | -42.48 | 4.96 | -42.99 | ||
| 2025-11-14 | BC / Brunswick Corporation | 3,765,617 | 2,926,223 | -22.29 | 4.50 | -21.05 | ||
| 2025-08-14 | JELD / JELD-WEN Holding, Inc. | 15,714,721 | 16,625,557 | 5.80 | 19.50 | 5.98 | ||
| 2025-08-14 | ATS / ATS Corporation | 8,906,269 | 7,590,538 | -14.77 | 7.80 | -15.22 | ||
| 2025-02-14 | BFH / Bread Financial Holdings, Inc. | 4,583,616 | 3,740,994 | -18.38 | 7.50 | -18.48 |
Arquivamentos 13F e Fundo
Este formulário foi arquivado em 2025-11-14 para o período de relatório 2025-09-30. Clique no ícone de link para ver o histórico completo da transação.
Atualize para desbloquear dados premium e exportar para Excel ![]() .
.
| Ativo | Tipo | Preço Médio por Ação | Ações (MM) |
ΔAções (%) |
Valor ($MM) |
ΔAções (%) |
Portfólio (%) |
ΔPortfólio (%) |
|
|---|---|---|---|---|---|---|---|---|---|
| CE / Celanese Corporation | 5.12 | 20.99 | 215.25 | -7.98 | 6.4964 | -0.2938 | |||
| MIDD / The Middleby Corporation | 1.46 | 4.21 | 194.32 | -3.80 | 5.8646 | 0.0010 | |||
| BC / Brunswick Corporation | 2.93 | -18.14 | 185.05 | -6.28 | 5.5850 | -0.1469 | |||
| WSC / WillScot Holdings Corporation | 8.73 | 71.69 | 184.30 | 32.28 | 5.5621 | 1.5177 | |||
| BFH / Bread Financial Holdings, Inc. | 3.28 | -8.65 | 183.12 | -10.81 | 5.5267 | -0.4334 | |||
| ATS / ATS Corporation | 6.97 | -8.14 | 182.69 | -24.50 | 5.5137 | -1.5106 | |||
| CCOI / Cogent Communications Holdings, Inc. | 4.60 | 64.86 | 176.56 | 31.14 | 5.3286 | 1.4204 | |||
| TFII / TFI International Inc. | 1.82 | -5.66 | 160.33 | -7.35 | 4.8389 | -0.1847 | |||
| FND / Floor & Decor Holdings, Inc. | 2.16 | -4.55 | 158.82 | -7.39 | 4.7933 | -0.1850 | |||
| IR / Ingersoll Rand Inc. | 1.80 | -1.93 | 148.62 | -2.59 | 4.4854 | 0.0567 | |||
| CIGI / Colliers International Group Inc. | 0.82 | -34.74 | 127.49 | -21.90 | 3.8476 | -0.8910 | |||
| KMX / CarMax, Inc. | 2.71 | 0.62 | 121.48 | -32.83 | 3.6664 | -1.5833 | |||
| SCI / Service Corporation International | 1.33 | -2.03 | 110.85 | 0.16 | 3.3456 | 0.1328 | |||
| DOOO / BRP Inc. | 1.72 | -42.48 | 104.40 | -27.87 | 3.1509 | -1.0508 | |||
| FI / Fiserv, Inc. | 0.78 | 100.24 | 3.0252 | 3.0252 | |||||
| KNSL / Kinsale Capital Group, Inc. | 0.23 | 12.82 | 96.07 | -0.85 | 2.8996 | 0.0867 | |||
| WEX / WEX Inc. | 0.59 | 93.29 | 2.8155 | 2.8155 | |||||
| MGA / Magna International Inc. | 1.95 | -23.73 | 92.39 | -6.41 | 2.7883 | -0.0773 | |||
| GIL / Gildan Activewear Inc. | 1.47 | -7.28 | 85.25 | 8.84 | 2.5729 | 0.2992 | |||
| EEFT / Euronet Worldwide, Inc. | 0.96 | 35.38 | 83.89 | 17.26 | 2.5318 | 0.4551 | |||
| JELD / JELD-WEN Holding, Inc. | 16.63 | 2.52 | 81.63 | 28.41 | 2.4637 | 0.6183 | |||
| SSNC / SS&C Technologies Holdings, Inc. | 0.92 | -7.82 | 81.49 | -1.19 | 2.4595 | 0.0655 | |||
| ECPG / Encore Capital Group, Inc. | 1.95 | -4.51 | 81.29 | 2.96 | 2.4533 | 0.1616 | |||
| ENSG / The Ensign Group, Inc. | 0.46 | 78.84 | 2.3794 | 2.3794 | |||||
| VNT / Vontier Corporation | 1.80 | -28.57 | 75.71 | -18.75 | 2.2851 | -0.4200 | |||
| ARCB / ArcBest Corporation | 0.57 | 39.51 | 1.1924 | 1.1924 | |||||
| BWA / BorgWarner Inc. | 0.79 | -77.85 | 34.85 | -70.91 | 1.0517 | -2.4261 | |||
| BLDR / Builders FirstSource, Inc. | 0.06 | -15.09 | 6.86 | -11.78 | 0.2069 | -0.0187 | |||
| KNX / Knight-Swift Transportation Holdings Inc. | 0.17 | 5.93 | 6.84 | -5.38 | 0.2065 | -0.0034 | |||
| PATK / Patrick Industries, Inc. | 0.05 | -39.71 | 4.91 | -32.42 | 0.1481 | -0.0627 | |||
| ITT / ITT Inc. | 0.03 | -16.79 | 4.69 | -5.17 | 0.1417 | -0.0020 | |||
| MAGN / Magnera Corporation | 0.31 | 0.00 | 3.69 | -2.97 | 0.1113 | 0.0010 | |||
| MEDP / Medpace Holdings, Inc. | 0.00 | -56.36 | 2.47 | -28.53 | 0.0745 | -0.0257 | |||
| OTEX / Open Text Corporation | 0.05 | -98.31 | 1.99 | -97.84 | 0.0600 | -2.6138 | |||
| SYF / Synchrony Financial | 0.02 | -12.62 | 1.78 | -6.97 | 0.0536 | -0.0018 | |||
| WFG / West Fraser Timber Co. Ltd. | 0.02 | 0.58 | 1.18 | -6.72 | 0.0356 | -0.0011 | |||
| TNC / Tennant Company | 0.01 | 12.77 | 0.43 | 17.86 | 0.0130 | 0.0024 | |||
| PNTG / The Pennant Group, Inc. | 0.01 | 84.62 | 0.30 | 55.67 | 0.0091 | 0.0035 | |||
| DCBO / Docebo Inc. | 0.01 | -4.90 | 0.27 | -10.17 | 0.0080 | -0.0006 | |||
| CLW / Clearwater Paper Corporation | 0.01 | 14.02 | 0.25 | -13.06 | 0.0076 | -0.0008 | |||
| LULU S FASHION LOUNGE / (55003A108) | 0.00 | 0.02 | 0.0000 | ||||||
| SEE / Sealed Air Corporation | 0.00 | -100.00 | 0.00 | 0.0000 | |||||
| CVS / CVS Health Corporation | 0.00 | -100.00 | 0.00 | -100.00 | -0.0210 | ||||
| AMCR / Amcor plc | 0.00 | -100.00 | 0.00 | -100.00 | -2.2410 | ||||
| PHIN / PHINIA Inc. | 0.00 | -100.00 | 0.00 | 0.0000 |