Estatísticas Básicas
| Perfil do Insider | Union Square Park Capital Management, LLC |
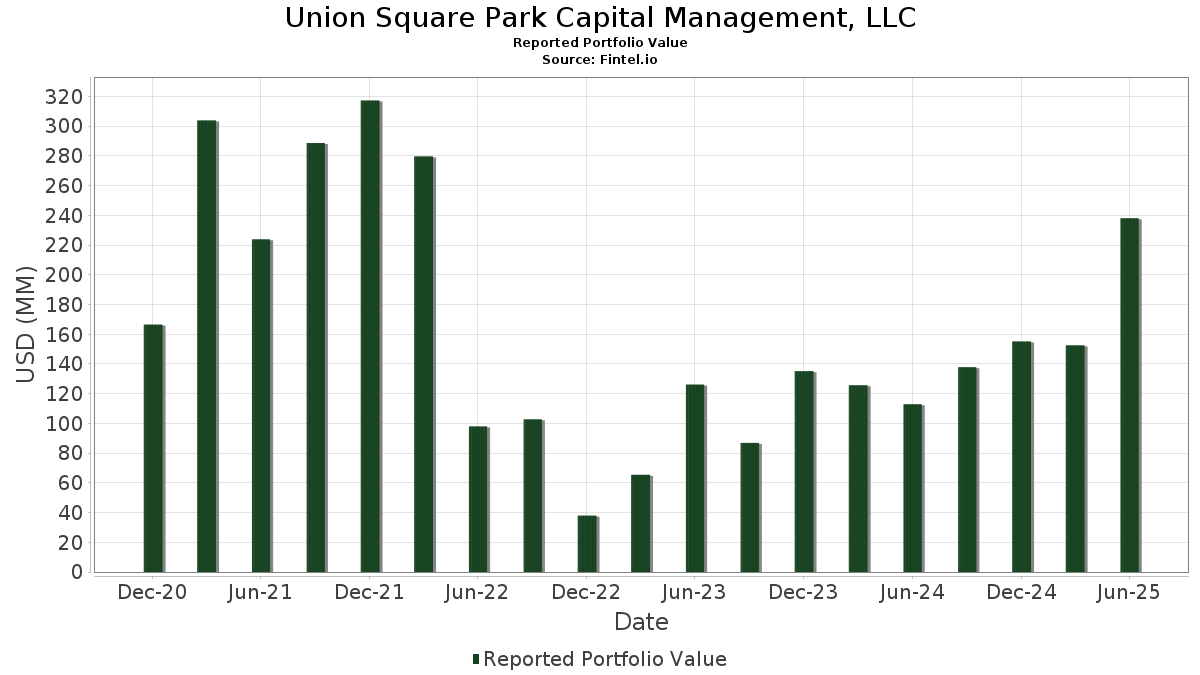
| Valor do Portfólio | $ 281,097,309 |
| Posições Atuais | 56 |
Últimas Participações, Desempenho, AUM (de 13F, 13D)
Union Square Park Capital Management, LLC divulgou 56 participações totais em seus últimos arquivamentos da SEC. O valor mais recente da carteira é calculado como $ 281,097,309 USD. O Ativo Total Sob Gestão (AUM) é esse valor mais o caixa (que não é divulgado). As principais posições de Union Square Park Capital Management, LLC são SPDR S&P 500 ETF (US:SPY) , iShares Trust - iShares Russell 2000 ETF (US:IWM) , Invesco QQQ Trust, Series 1 (US:QQQ) , RH (US:RH) , and Compass, Inc. (US:COMP) . As novas posições de Union Square Park Capital Management, LLC incluem Lyft, Inc. (US:LYFT) , UnitedHealth Group Incorporated (US:UNH) , Designer Brands Inc. (US:DBI) , Sable Offshore Corp. (US:SOC) , and Forward Air Corporation (US:FWRD) . As principais indústrias de Union Square Park Capital Management, LLC são "Food And Kindred Products" (sic 20) .
Maiores Aumentos Este Trimestre
Usamos a mudança na alocação do portfólio porque esta é a métrica mais significativa. As mudanças podem ser devido a operações ou mudanças nos preços das ações.
| Ativo | Ações (MM) |
Valor (MM$) |
% do Portfólio | Δ% do Portfólio |
|---|---|---|---|---|
| 0.03 | 15.01 | 5.3395 | 5.3395 | |
| 0.40 | 8.80 | 3.1320 | 3.1320 | |
| 0.09 | 61.95 | 22.0403 | 2.9596 | |
| 1.15 | 9.23 | 3.2834 | 1.8981 | |
| 0.01 | 5.18 | 1.8426 | 1.8426 | |
| 1.00 | 3.54 | 1.2594 | 1.2594 | |
| 0.05 | 3.35 | 1.1928 | 1.1928 | |
| 1.73 | 7.62 | 2.7091 | 1.0572 | |
| 0.01 | 2.44 | 0.8664 | 0.8664 | |
| 0.14 | 2.38 | 0.8479 | 0.8479 |
Maiores Diminuições Este Trimestre
Usamos a mudança na alocação do portfólio porque esta é a métrica mais significativa. As mudanças podem ser devido a operações ou mudanças nos preços das ações.
| Ativo | Ações (MM) |
Valor (MM$) |
% do Portfólio | Δ% do Portfólio |
|---|---|---|---|---|
| 0.12 | 27.83 | 9.8988 | -5.9681 | |
| 0.00 | 0.00 | -1.1929 | ||
| 0.08 | 3.34 | 1.1899 | -0.9041 | |
| 0.02 | 1.44 | 0.5129 | -0.7962 | |
| 0.00 | 0.00 | -0.7753 | ||
| 0.10 | 6.71 | 2.3857 | -0.7371 | |
| 0.00 | 0.00 | -0.7319 | ||
| 0.01 | 1.42 | 0.5066 | -0.5658 | |
| 1.78 | 4.94 | 1.7560 | -0.5633 | |
| 0.17 | 7.17 | 2.5519 | -0.4989 |
Arquivamentos 13D/G
Esta é uma lista de arquivamentos 13D e 13G feitos no último ano (se houver). Clique no ícone de link para ver o histórico completo da transação. Linhas verdes indicam novas posições. Linhas vermelhas indicam posições fechadas.
| Data do Arquivo | Formulário | Ativo | Ações Anteriores |
Ações Atuais |
ΔAções % | % de Propriedade |
% Δde Propriedade | |
|---|---|---|---|---|---|---|---|---|
| 2025-10-03 | SPWH / Sportsman's Warehouse Holdings, Inc. | 1,604,378 | 1,936,401 | 20.69 | 5.04 | 20.29 | ||
| 2025-02-14 | EGRX / Eagle Pharmaceuticals, Inc. | 1,321,385 | 1,485,677 | 12.43 | 11.44 | 12.49 |
Arquivamentos 13F e Fundo
Este formulário foi arquivado em 2025-11-14 para o período de relatório 2025-09-30. Clique no ícone de link para ver o histórico completo da transação.
Atualize para desbloquear dados premium e exportar para Excel ![]() .
.
| Ativo | Tipo | Preço Médio por Ação | Ações (MM) |
ΔAções (%) |
Valor ($MM) |
ΔAções (%) |
Portfólio (%) |
ΔPortfólio (%) |
|
|---|---|---|---|---|---|---|---|---|---|
| SPY / SPDR S&P 500 ETF | Put | 0.09 | 26.53 | 61.95 | 36.43 | 22.0403 | 2.9596 | ||
| IWM / iShares Trust - iShares Russell 2000 ETF | Put | 0.12 | -34.29 | 27.83 | -26.32 | 9.8988 | -5.9681 | ||
| QQQ / Invesco QQQ Trust, Series 1 | Put | 0.03 | 15.01 | 5.3395 | 5.3395 | ||||
| RH / RH | 0.05 | 0.00 | 10.16 | 7.49 | 3.6137 | -0.3571 | |||
| COMP / Compass, Inc. | 1.15 | 118.93 | 9.23 | 179.92 | 3.2834 | 1.8981 | |||
| CZR / Caesars Entertainment, Inc. | 0.34 | 9.68 | 9.19 | 4.41 | 3.2688 | -0.4291 | |||
| LYFT / Lyft, Inc. | Call | 0.40 | 8.80 | 3.1320 | 3.1320 | ||||
| RDNW / RideNow Group, Inc. | 1.73 | 1.69 | 7.62 | 93.72 | 2.7091 | 1.0572 | |||
| PTON / Peloton Interactive, Inc. | Call | 0.80 | 10.34 | 7.20 | 43.11 | 2.5614 | 0.4473 | ||
| ESTA / Establishment Labs Holdings Inc. | 0.17 | 2.94 | 7.17 | -1.20 | 2.5519 | -0.4989 | |||
| PYPL / PayPal Holdings, Inc. | Call | 0.10 | 0.00 | 6.71 | -9.77 | 2.3857 | -0.7371 | ||
| ILPT / Industrial Logistics Properties Trust | 0.95 | -25.49 | 5.54 | -4.53 | 1.9703 | -0.4672 | |||
| UNH / UnitedHealth Group Incorporated | 0.01 | 5.18 | 1.8426 | 1.8426 | |||||
| MHK / Mohawk Industries, Inc. | 0.04 | 0.00 | 5.16 | 22.97 | 1.8345 | 0.0725 | |||
| SPWH / Sportsman's Warehouse Holdings, Inc. | 1.78 | 11.38 | 4.94 | -10.58 | 1.7560 | -0.5633 | |||
| PTON / Peloton Interactive, Inc. | 0.50 | -13.04 | 4.50 | 12.78 | 1.6009 | -0.0758 | |||
| FWRD / Forward Air Corporation | 0.15 | -14.29 | 3.85 | -10.43 | 1.3682 | -0.4362 | |||
| DBI / Designer Brands Inc. | 1.00 | 3.54 | 1.2594 | 1.2594 | |||||
| ORCL / Oracle Corporation | 0.01 | 0.00 | 3.52 | 28.66 | 1.2506 | 0.1024 | |||
| LYFT / Lyft, Inc. | 0.15 | 47.62 | 3.41 | 106.23 | 1.2137 | 0.5184 | |||
| GDEN / Golden Entertainment, Inc. | 0.14 | 17.96 | 3.36 | -5.49 | 1.1954 | -0.2984 | |||
| PYPL / PayPal Holdings, Inc. | 0.05 | 3.35 | 1.1928 | 1.1928 | |||||
| HGV / Hilton Grand Vacations Inc. | 0.08 | -33.33 | 3.34 | -32.89 | 1.1899 | -0.9041 | |||
| CEG / Constellation Energy Corporation | 0.01 | 0.00 | 3.29 | 1.95 | 1.1707 | -0.1855 | |||
| NRG / NRG Energy, Inc. | 0.02 | 0.00 | 3.24 | 0.87 | 1.1523 | -0.1971 | |||
| AMD / Advanced Micro Devices, Inc. | 0.02 | 0.00 | 3.24 | 13.99 | 1.1511 | -0.0413 | |||
| CORZW / Core Scientific, Inc. - Equity Warrant | 0.28 | 100.00 | 3.20 | 114.63 | 1.1378 | 0.5115 | |||
| ANET / Arista Networks, Inc. | 0.02 | 0.00 | 2.91 | 42.42 | 1.0367 | 0.1770 | |||
| DELL / Dell Technologies Inc. | 0.02 | 0.00 | 2.84 | 15.62 | 1.0087 | -0.0216 | |||
| VYX / NCR Voyix Corporation | 0.20 | 0.00 | 2.51 | 6.99 | 0.8929 | -0.0928 | |||
| GOOG / Alphabet Inc. | 0.01 | 2.44 | 0.8664 | 0.8664 | |||||
| SOC / Sable Offshore Corp. | 0.14 | 2.38 | 0.8479 | 0.8479 | |||||
| TDOC / Teladoc Health, Inc. | 0.30 | 500.00 | 2.32 | 433.10 | 0.8250 | 0.6420 | |||
| FWRD / Forward Air Corporation | Call | 0.09 | 2.31 | 0.8209 | 0.8209 | ||||
| KMX / CarMax, Inc. | Call | 0.05 | 2.24 | 0.7981 | 0.7981 | ||||
| TLN / Talen Energy Corporation | 0.01 | -50.00 | 2.13 | -26.87 | 0.7566 | -0.4651 | |||
| CHKP / Check Point Software Technologies Ltd. | 0.01 | 100.00 | 2.07 | 87.07 | 0.7361 | 0.2713 | |||
| AIV / Apartment Investment and Management Company | 0.26 | 2.06 | 0.7335 | 0.7335 | |||||
| SRPT / Sarepta Therapeutics, Inc. | 0.10 | 2.02 | 0.7198 | 0.7198 | |||||
| VST / Vistra Corp. | 0.01 | 0.00 | 1.96 | 1.08 | 0.6970 | -0.1173 | |||
| MOH / Molina Healthcare, Inc. | 0.01 | 1.91 | 0.6808 | 0.6808 | |||||
| CORZ / Core Scientific, Inc. | Call | 0.10 | 0.00 | 1.79 | 5.10 | 0.6382 | -0.0790 | ||
| COMP / Compass, Inc. | Call | 0.20 | 1.61 | 0.5713 | 0.5713 | ||||
| LION / Lionsgate Studios Corp. | 0.21 | 7.45 | 1.48 | 27.54 | 0.5275 | 0.0393 | |||
| DOCU / DocuSign, Inc. | 0.02 | -50.00 | 1.44 | -53.74 | 0.5129 | -0.7962 | |||
| DDOG / Datadog, Inc. | 0.01 | -47.37 | 1.42 | -44.20 | 0.5066 | -0.5658 | |||
| ABNB / Airbnb, Inc. | 0.01 | 1.34 | 0.4751 | 0.4751 | |||||
| CTRI / Centuri Holdings, Inc. | 0.06 | 1.27 | 0.4519 | 0.4519 | |||||
| GTEN / Gores Holdings X, Inc. | 0.10 | 1.02 | 0.3632 | 0.3632 | |||||
| BTBT / Bit Digital, Inc. | 0.30 | 0.00 | 0.90 | 36.99 | 0.3202 | 0.0441 | |||
| FTHM / Fathom Holdings Inc. | 0.45 | 0.81 | 0.2882 | 0.2882 | |||||
| WOOF / Petco Health and Wellness Company, Inc. | 0.17 | 0.68 | 0.2409 | 0.2409 | |||||
| WBD / Warner Bros. Discovery, Inc. | Call | 0.03 | 0.59 | 0.2084 | 0.2084 | ||||
| YEXT / Yext, Inc. | 0.05 | 0.43 | 0.1515 | 0.1515 | |||||
| QNCX / Quince Therapeutics, Inc. | 0.22 | 85.96 | 0.37 | 83.92 | 0.1303 | 0.0465 | |||
| FLD / Fold Holdings, Inc. | 0.09 | 50.67 | 0.34 | 37.60 | 0.1224 | 0.0173 | |||
| VRT / Vertiv Holdings Co | 0.00 | -100.00 | 0.00 | 0.0000 | |||||
| CZR / Caesars Entertainment, Inc. | Call | 0.00 | -100.00 | 0.00 | -100.00 | -1.1929 | |||
| TDOC / Teladoc Health, Inc. | Call | 0.00 | -100.00 | 0.00 | -100.00 | -0.7319 | |||
| YNDX / Yandex N.V. | Call | 0.00 | -100.00 | 0.00 | 0.0000 | ||||
| HOOD / Robinhood Markets, Inc. | Call | 0.00 | -100.00 | 0.00 | 0.0000 | ||||
| SLNO / Soleno Therapeutics, Inc. | Call | 0.00 | -100.00 | 0.00 | 0.0000 | ||||
| SLNO / Soleno Therapeutics, Inc. | 0.00 | -100.00 | 0.00 | 0.0000 | |||||
| CCIR / Cohen Circle Acquisition Corp. I | 0.00 | -100.00 | 0.00 | 0.0000 | |||||
| HOUS / Anywhere Real Estate Inc. | 0.00 | -100.00 | 0.00 | 0.0000 | |||||
| META / Meta Platforms, Inc. | 0.00 | -100.00 | 0.00 | -100.00 | -0.7753 | ||||
| HIMS / Hims & Hers Health, Inc. | 0.00 | -100.00 | 0.00 | 0.0000 | |||||
| ADBE / Adobe Inc. | 0.00 | -100.00 | 0.00 | 0.0000 | |||||
| OXY / Occidental Petroleum Corporation | 0.00 | -100.00 | 0.00 | 0.0000 | |||||
| J0J / Amrize AG | 0.00 | -100.00 | 0.00 | 0.0000 | |||||
| PLTR / Palantir Technologies Inc. | Call | 0.00 | -100.00 | 0.00 | 0.0000 |