Estatísticas Básicas
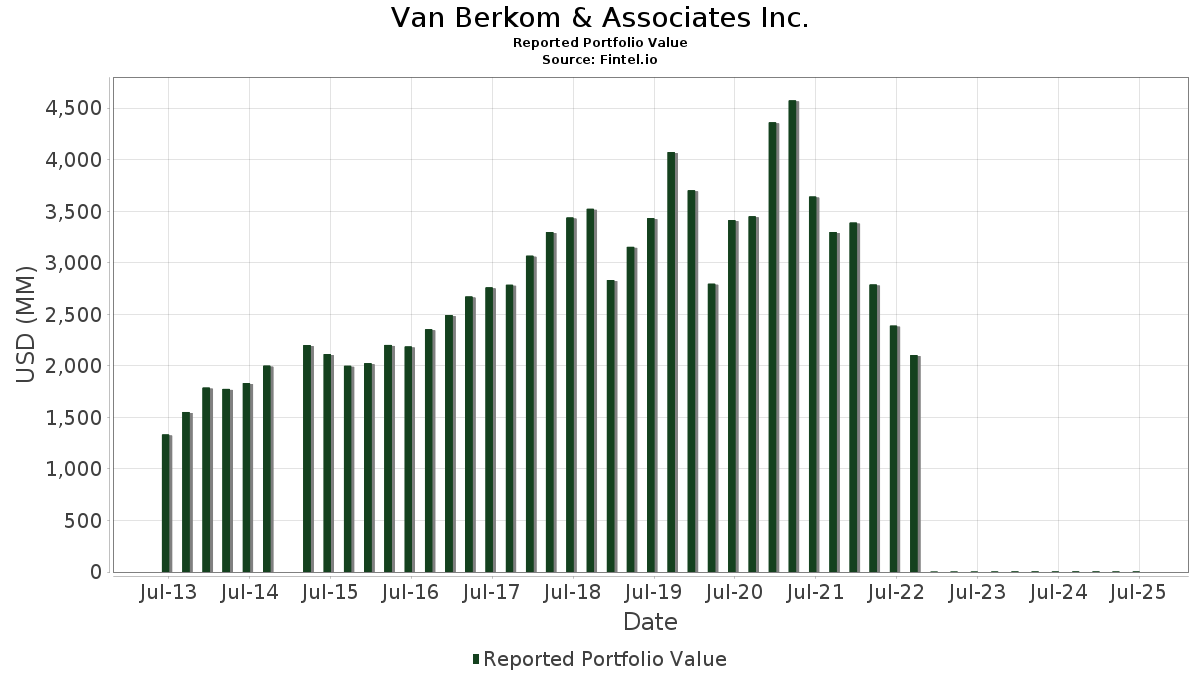
| Valor do Portfólio | $ 3,457,762 |
| Posições Atuais | 63 |
Últimas Participações, Desempenho, AUM (de 13F, 13D)
Van Berkom & Associates Inc. divulgou 63 participações totais em seus últimos arquivamentos da SEC. O valor mais recente da carteira é calculado como $ 3,457,762 USD. O Ativo Total Sob Gestão (AUM) é esse valor mais o caixa (que não é divulgado). As principais posições de Van Berkom & Associates Inc. são The Ensign Group, Inc. (US:ENSG) , Laureate Education, Inc. (US:LAUR) , StoneX Group Inc. (US:SNEX) , Grand Canyon Education, Inc. (US:LOPE) , and Victory Capital Holdings, Inc. (US:VCTR) . As novas posições de Van Berkom & Associates Inc. incluem BrightView Holdings, Inc. (US:BV) , SPS Commerce, Inc. (US:SPSC) , Lazard, Inc. (US:LAZ) , Modine Manufacturing Company (US:MOD) , and Lyft, Inc. (US:LYFT) . As principais indústrias de Van Berkom & Associates Inc. são "Apparel And Other Finished Products Made From Fabrics And Similar Materials" (sic 23) , "Leather And Leather Products" (sic 31) , and "Wholesale Trade-durable Goods" (sic 50) .
Maiores Aumentos Este Trimestre
Usamos a mudança na alocação do portfólio porque esta é a métrica mais significativa. As mudanças podem ser devido a operações ou mudanças nos preços das ações.
| Ativo | Ações (MM) |
Valor (MM$) |
% do Portfólio | Δ% do Portfólio |
|---|---|---|---|---|
| 0.82 | 0.06 | 1.8152 | 1.8054 | |
| 4.56 | 0.06 | 1.7663 | 1.7663 | |
| 0.37 | 0.06 | 1.6111 | 1.5680 | |
| 0.50 | 0.05 | 1.5003 | 1.5003 | |
| 3.77 | 0.09 | 2.7181 | 0.7322 | |
| 3.76 | 0.06 | 1.7439 | 0.5560 | |
| 1.56 | 0.05 | 1.5461 | 0.5466 | |
| 0.52 | 0.11 | 3.3223 | 0.4643 | |
| 1.16 | 0.11 | 3.0682 | 0.4240 | |
| 0.17 | 0.08 | 2.2118 | 0.3507 |
Maiores Diminuições Este Trimestre
Usamos a mudança na alocação do portfólio porque esta é a métrica mais significativa. As mudanças podem ser devido a operações ou mudanças nos preços das ações.
| Ativo | Ações (MM) |
Valor (MM$) |
% do Portfólio | Δ% do Portfólio |
|---|---|---|---|---|
| 0.00 | 0.00 | -2.5709 | ||
| 0.00 | 0.00 | -2.0361 | ||
| 0.00 | 0.00 | -1.3807 | ||
| 0.01 | 0.00 | 0.0375 | -0.7699 | |
| 0.72 | 0.07 | 1.9591 | -0.6776 | |
| 0.64 | 0.08 | 2.1920 | -0.4586 | |
| 0.45 | 0.07 | 2.0553 | -0.3916 | |
| 0.78 | 0.07 | 1.9004 | -0.3509 | |
| 3.74 | 0.04 | 1.2955 | -0.3280 | |
| 1.11 | 0.10 | 2.8070 | -0.3105 |
Arquivamentos 13D/G
Esta é uma lista de arquivamentos 13D e 13G feitos no último ano (se houver). Clique no ícone de link para ver o histórico completo da transação. Linhas verdes indicam novas posições. Linhas vermelhas indicam posições fechadas.
| Data do Arquivo | Formulário | Ativo | Ações Anteriores |
Ações Atuais |
ΔAções % | % de Propriedade |
% Δde Propriedade | |
|---|---|---|---|---|---|---|---|---|
| 2025-11-05 | PNTG / The Pennant Group, Inc. | 2,186,754 | 0 | -100.00 | 0.00 | -100.00 | ||
| 2025-02-06 | CRNC / Cerence Inc. | 3,936,930 | 0 | -100.00 | 0.00 | -100.00 |
Arquivamentos 13F e Fundo
Este formulário foi arquivado em 2025-11-04 para o período de relatório 2025-09-30. Clique no ícone de link para ver o histórico completo da transação.
Atualize para desbloquear dados premium e exportar para Excel ![]() .
.
| Ativo | Tipo | Preço Médio por Ação | Ações (MM) |
ΔAções (%) |
Valor ($MM) |
ΔAções (%) |
Portfólio (%) |
ΔPortfólio (%) |
|
|---|---|---|---|---|---|---|---|---|---|
| ENSG / The Ensign Group, Inc. | 0.75 | -0.43 | 0.13 | 12.17 | 3.7369 | 0.2883 | |||
| LAUR / Laureate Education, Inc. | 4.06 | -18.24 | 0.13 | 10.34 | 3.7024 | 0.2480 | |||
| SNEX / StoneX Group Inc. | 1.20 | 0.28 | 0.12 | 11.01 | 3.5034 | 0.2565 | |||
| LOPE / Grand Canyon Education, Inc. | 0.52 | 3.00 | 0.11 | 18.75 | 3.3223 | 0.4643 | |||
| VCTR / Victory Capital Holdings, Inc. | 1.68 | -5.69 | 0.11 | -4.42 | 3.1513 | -0.2294 | |||
| MMS / Maximus, Inc. | 1.16 | -8.25 | 0.11 | 20.45 | 3.0682 | 0.4240 | |||
| EEFT / Euronet Worldwide, Inc. | 1.11 | 6.98 | 0.10 | -6.73 | 2.8070 | -0.3105 | |||
| PRVA / Privia Health Group, Inc. | 3.77 | 30.10 | 0.09 | 40.91 | 2.7181 | 0.7322 | |||
| AWI / Armstrong World Industries, Inc. | 0.48 | -13.60 | 0.09 | 4.49 | 2.7102 | 0.0349 | |||
| OZK / Bank OZK | 1.82 | 0.71 | 0.09 | 9.52 | 2.6810 | 0.1519 | |||
| HLNE / Hamilton Lane Incorporated | 0.69 | 0.75 | 0.09 | -4.17 | 2.6749 | -0.2059 | |||
| PRIM / Primoris Services Corporation | 0.64 | -34.86 | 0.09 | 14.47 | 2.5378 | 0.2623 | |||
| CCCS / CCC Intelligent Solutions Holdings Inc. | 9.52 | 8.92 | 0.09 | 4.88 | 2.5091 | 0.0604 | |||
| ORA / Ormat Technologies, Inc. | 0.89 | -14.12 | 0.09 | -1.15 | 2.4909 | -0.1067 | |||
| RLI / RLI Corp. | 1.23 | 14.56 | 0.08 | 3.90 | 2.3194 | 0.0121 | |||
| ESAB / ESAB Corporation | 0.72 | 28.65 | 0.08 | 19.40 | 2.3151 | 0.3172 | |||
| PNTG / The Pennant Group, Inc. | 3.11 | 10.07 | 0.08 | -7.14 | 2.2704 | -0.2420 | |||
| CRL / Charles River Laboratories International, Inc. | 0.50 | 2.05 | 0.08 | 5.48 | 2.2485 | 0.0495 | |||
| HLI / Houlihan Lokey, Inc. | 0.38 | -4.97 | 0.08 | 8.45 | 2.2368 | 0.1137 | |||
| PLNT / Planet Fitness, Inc. | 0.74 | -0.15 | 0.08 | -4.94 | 2.2293 | -0.1847 | |||
| CHE / Chemed Corporation | 0.17 | 33.01 | 0.08 | 22.58 | 2.2118 | 0.3507 | |||
| GMED / Globus Medical, Inc. | 1.33 | 3.81 | 0.08 | 1.33 | 2.2080 | -0.0478 | |||
| FSS / Federal Signal Corporation | 0.64 | -23.89 | 0.08 | -15.73 | 2.1920 | -0.4586 | |||
| IBP / Installed Building Products, Inc. | 0.30 | -32.98 | 0.07 | -7.59 | 2.1206 | -0.2598 | |||
| NMIH / NMI Holdings, Inc. | 1.91 | 0.42 | 0.07 | -8.75 | 2.1174 | -0.2704 | |||
| PCTY / Paylocity Holding Corporation | 0.45 | -1.66 | 0.07 | -13.41 | 2.0553 | -0.3916 | |||
| FCN / FTI Consulting, Inc. | 0.44 | 5.10 | 0.07 | 4.48 | 2.0451 | 0.0445 | |||
| TTEK / Tetra Tech, Inc. | 2.07 | 0.11 | 0.07 | -8.11 | 1.9935 | -0.2142 | |||
| FIVN / Five9, Inc. | 2.81 | -1.28 | 0.07 | -10.67 | 1.9658 | -0.2764 | |||
| SHAK / Shake Shack Inc. | 0.72 | 14.85 | 0.07 | -23.86 | 1.9591 | -0.6776 | |||
| SPXC / SPX Technologies, Inc. | 0.36 | -18.58 | 0.07 | -9.59 | 1.9287 | -0.2597 | |||
| SGI / Somnigroup International Inc. | 0.78 | -29.90 | 0.07 | -13.33 | 1.9004 | -0.3509 | |||
| WSC / WillScot Holdings Corporation | 3.05 | 26.78 | 0.06 | -3.03 | 1.8649 | -0.0999 | |||
| FND / Floor & Decor Holdings, Inc. | 0.86 | 12.23 | 0.06 | 8.62 | 1.8328 | 0.1007 | |||
| RDNT / RadNet, Inc. | 0.82 | 14,163.63 | 0.06 | 1.8152 | 1.8054 | ||||
| BV / BrightView Holdings, Inc. | 4.56 | 0.06 | 1.7663 | 1.7663 | |||||
| GO / Grocery Outlet Holding Corp. | 3.76 | 16.91 | 0.06 | 53.85 | 1.7439 | 0.5560 | |||
| YETI / YETI Holdings, Inc. | 1.71 | -5.04 | 0.06 | 0.00 | 1.6431 | -0.0486 | |||
| EPAM / EPAM Systems, Inc. | 0.37 | 4,413.01 | 0.06 | 5,400.00 | 1.6111 | 1.5680 | |||
| DOCN / DigitalOcean Holdings, Inc. | 1.56 | 33.10 | 0.05 | 60.61 | 1.5461 | 0.5466 | |||
| SPSC / SPS Commerce, Inc. | 0.50 | 0.05 | 1.5003 | 1.5003 | |||||
| APG / APi Group Corporation | 1.37 | 49.77 | 0.05 | 0.00 | 1.3586 | -0.0280 | |||
| DV / DoubleVerify Holdings, Inc. | 3.74 | 2.61 | 0.04 | -18.52 | 1.2955 | -0.3280 | |||
| BLKB / Blackbaud, Inc. | 0.67 | -0.16 | 0.04 | 0.00 | 1.2434 | -0.0362 | |||
| ATS / ATS Corporation | 0.27 | 0.27 | 0.01 | -12.50 | 0.2042 | -0.0509 | |||
| LAZ / Lazard, Inc. | 0.06 | 0.00 | 0.0844 | 0.0844 | |||||
| ATAT / Atour Lifestyle Holdings Limited - Depositary Receipt (Common Stock) | 0.06 | 2.23 | 0.00 | 0.00 | 0.0685 | 0.0088 | |||
| MOD / Modine Manufacturing Company | 0.01 | 0.00 | 0.0552 | 0.0552 | |||||
| ROAD / Construction Partners, Inc. | 0.01 | 0.00 | 0.00 | 0.00 | 0.0514 | 0.0071 | |||
| PTC / PTC Inc. | 0.01 | -10.93 | 0.00 | 0.00 | 0.0479 | 0.0009 | |||
| FA / First Advantage Corporation | 0.09 | 0.00 | 0.00 | 0.00 | 0.0379 | -0.0042 | |||
| SLAB / Silicon Laboratories Inc. | 0.01 | -94.64 | 0.00 | -96.30 | 0.0375 | -0.7699 | |||
| TE1 / Bio-Techne Corporation | 0.02 | 0.00 | 0.00 | 0.00 | 0.0343 | 0.0016 | |||
| GRAB / Grab Holdings Limited | 0.18 | 76.51 | 0.00 | 0.0305 | 0.0156 | ||||
| DT / Dynatrace, Inc. | 0.02 | 0.00 | 0.00 | 0.00 | 0.0302 | -0.0052 | |||
| YUMC / Yum China Holdings, Inc. | 0.02 | 10.96 | 0.00 | 0.0302 | 0.0016 | ||||
| KLIC / Kulicke and Soffa Industries, Inc. | 0.02 | -13.48 | 0.00 | 0.0234 | -0.0003 | ||||
| BC / Brunswick Corporation | 0.01 | 22.86 | 0.00 | 0.0225 | 0.0060 | ||||
| VIPS / Vipshop Holdings Limited - Depositary Receipt (Common Stock) | 0.04 | 0.00 | 0.00 | 0.0222 | 0.0047 | ||||
| LYFT / Lyft, Inc. | 0.03 | 0.00 | 0.0222 | 0.0222 | |||||
| GLOB / Globant S.A. | 0.01 | 4.29 | 0.00 | -100.00 | 0.0216 | -0.0121 | |||
| ENTG / Entegris, Inc. | 0.01 | -26.26 | 0.00 | 0.0211 | -0.0046 | ||||
| STVN / Stevanato Group S.p.A. | 0.00 | 50.62 | 0.00 | 0.0027 | 0.0009 | ||||
| SMIN / iShares Trust - iShares MSCI India Small-Cap ETF | 0.00 | -100.00 | 0.00 | 0.0000 | |||||
| GTLS / Chart Industries, Inc. | 0.00 | -100.00 | 0.00 | -100.00 | -2.0361 | ||||
| HQY / HealthEquity, Inc. | 0.00 | -100.00 | 0.00 | -100.00 | -1.3807 | ||||
| IRDM / Iridium Communications Inc. | 0.00 | -100.00 | 0.00 | -100.00 | -2.5709 | ||||
| SCJ / iShares, Inc. - iShares MSCI Japan Small-Cap ETF | 0.00 | -100.00 | 0.00 | 0.0000 |