Hydrofarm Holdings Group, Inc.
| Security | HYFM / Hydrofarm Holdings Group, Inc. |
| Insider | Kevin Patrick OBrien |
This page shows the track record and history of OBrien Kevin Patrick
insider trades in Hydrofarm Holdings Group, Inc.. The SEC defines Insiders as officers, directors, or significant investors (greater than 10% ownership) in a company.
It is illegal for insiders to make trades in their companies based on material, non-public information ("MNPI"). This does not mean
it is illegal for them to make any
trades in their own companies. However, they must report all trades to the SEC via a Form 4.
Insider Purchases - Short Term Profit Analysis
In this section, we analyze the profitability of every unplanned, open-market insider purchase made by Kevin Patrick OBrien in HYFM / Hydrofarm Holdings Group, Inc.. This analysis helps to understand if the insider consistently generates abnormal returns, and is worth following. This analysis is for one-year following each trade, and the results are theoretical.
The following table shows the most recent open market purchases that were not part of an automatic trading plan.
| Trade Date | Reported Shares |
Reported Price |
Adjusted Shares |
Adjusted Price |
Cost Basis | Days to Max |
Price at Max |
Max Profit ($) |
Max Return (%) |
|---|---|---|---|---|---|---|---|
| There are no known unplanned open-market trades for this insider |
Adjusted Price is the split-adjusted price. Adjusted Shares is the split-adjusted shares.
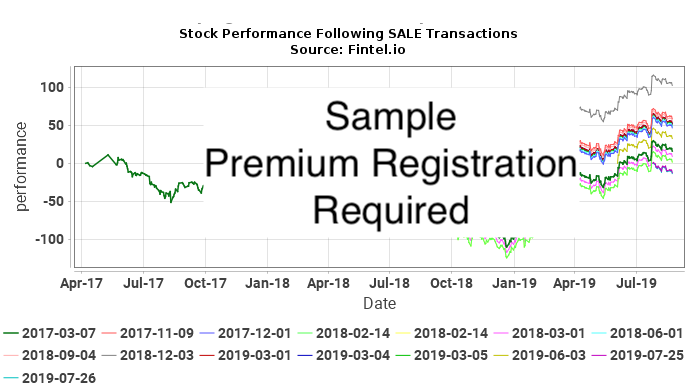
Insider Sales - Short Term Loss Analysis
In this section, we analyze the short-term loss avoidance of every unplanned, open-market insider sale made by Kevin Patrick OBrien in HYFM / Hydrofarm Holdings Group, Inc.. A consistent pattern of loss avoidance may suggest that future sale transactions may predict declines in price. This analysis is for one-year following each trade, and the results are theoretical.
The following table shows the most recent open market purchases that were not part of an automatic trading plan.
| Trade Date | Reported Shares |
Reported Price |
Adjusted Shares |
Adjusted Price |
Cost Basis | Days to Min |
Price at Min |
Max Loss Avoided ($) |
Max Loss Avoided (%) |
|---|---|---|---|---|---|---|---|---|---|
| 2026-01-06 | 1,150 | 1.5100 | 1,150 | 1.5100 | 1,736 | 94 | 0.8000 | -816 | -47.00 |
Adjusted Price is the split-adjusted price. Adjusted Shares is the split-adjusted shares.
Insider Transaction History
| File Date |
Trade Date |
Form | Insider | Ticker | Security Title | Code | Direct | Exercise Price |
Unit Price |
Units Changed |
Value Changed (1K) |
Remaining Options |
Remaining Shares |
|
|---|---|---|---|---|---|---|---|---|---|---|---|---|---|---|
| 2026-01-08 | 2026-01-06 | 4 | OBrien Kevin Patrick | HYFM | Common Stock, $0.0001 par value per share | D | 1.5100 | -1,150 | -2 | 13,222 | ||||
| 2025-08-20 | 2025-08-18 | 4 | OBrien Kevin Patrick | HYFM | Common Stock, $0.0001 par value per share | D | 4.5100 | -48 | -0 | 14,372 | ||||
| 2025-04-10 | 2025-04-08 | 4 | OBrien Kevin Patrick | HYFM | Common Stock, $0.0001 par value per share | D | 1.7800 | -863 | -2 | 14,420 | ||||
| 2025-03-26 | 2025-03-24 | 4 | OBrien Kevin Patrick | HYFM | Common Stock, $0.0001 par value per share | D | 2.8500 | -292 | -1 | 15,283 | ||||
| 2025-03-04 | 2025-02-28 | 4 | OBrien Kevin Patrick | HYFM | Common Stock, $0.0001 par value per share | D | 2,501 | 15,575 | ||||||
| 2025-01-03 | 2025-01-01 | 4 | OBrien Kevin Patrick | HYFM | Common Stock, $0.0001 par value per share | D | 100,000 | 130,754 | ||||||
| 2024-08-20 | 2024-08-19 | 4 | OBrien Kevin Patrick | HYFM | Common Stock, $0.0001 par value per share | D | 0.5539 | -479 | -0 | 30,754 | ||||
| 2024-03-27 | 2024-03-25 | 4 | OBrien Kevin Patrick | HYFM | Common Stock, $0.0001 par value per share | D | 0.9290 | -3,783 | -4 | 31,233 | ||||
| 2024-03-25 | 2024-03-22 | 4 | OBrien Kevin Patrick | HYFM | Common Stock, $0.0001 par value per share | D | 0.8300 | -2,918 | -2 | 35,016 | ||||
| 2024-02-20 | 2024-02-15 | 4 | OBrien Kevin Patrick | HYFM | Common Stock, $0.0001 par value per share | D | 10,965 | 37,934 | ||||||
| 2023-08-21 | 2023-08-18 | 4 | OBrien Kevin Patrick | HYFM | Common Stock, $0.0001 par value per share | D | 1.0800 | -479 | -1 | 26,969 | ||||
| 2023-03-23 | 2023-03-22 | 4 | OBrien Kevin Patrick | HYFM | Common Stock, $0.0001 par value per share | D | 1.8700 | -2,917 | -5 | 27,448 | ||||
| 2022-08-18 | 2022-08-17 | 4 | OBrien Kevin Patrick | HYFM | Common Stock, $0.0001 par value per share | D | 5,000 | 30,365 | ||||||
| 2022-03-23 | 2022-03-21 | 4 | OBrien Kevin Patrick | HYFM | Common Stock, $0.0001 par value per share | D | 25,365 | 25,365 |
P
Compra de mercado aberto ou privada de ativo não-derivativo ou derivativo
S
Venda de mercado aberto ou privada de ativo não-derivativo ou derivativo
A
Concessão, premiação, ou outra aquisição de ativos da empresa (como uma opção)
C
Conversão de derivativo
D
Venda ou transferência de ativos de volta para a empresa
F
Pagamento do preço de exercício ou responsabilidade fiscal utilizando parte dos ativos recebidos da empresa
G
Doação de ativos pelo ou para o insider
K
Swaps de capital e transações de hedge similares
M
Exercício ou conversão de ativo derivativo recebido da empresa (como uma opção)
V
Uma transação voluntariamente reportada no Formulário 4
J
Outro (acompanhado de uma nota explicativa descrevendo a transação)