Regional Management Corp.
| Security | RM / Regional Management Corp. |
| Insider | Harpreet Rana |
This page shows the track record and history of Rana Harpreet
insider trades in Regional Management Corp.. The SEC defines Insiders as officers, directors, or significant investors (greater than 10% ownership) in a company.
It is illegal for insiders to make trades in their companies based on material, non-public information ("MNPI"). This does not mean
it is illegal for them to make any
trades in their own companies. However, they must report all trades to the SEC via a Form 4.
Insider Purchases - Short Term Profit Analysis
In this section, we analyze the profitability of every unplanned, open-market insider purchase made by Harpreet Rana in RM / Regional Management Corp.. This analysis helps to understand if the insider consistently generates abnormal returns, and is worth following. This analysis is for one-year following each trade, and the results are theoretical.
The following table shows the most recent open market purchases that were not part of an automatic trading plan.
| Trade Date | Reported Shares |
Reported Price |
Adjusted Shares |
Adjusted Price |
Cost Basis | Days to Max |
Price at Max |
Max Profit ($) |
Max Return (%) |
|---|---|---|---|---|---|---|---|
| There are no known unplanned open-market trades for this insider |
Adjusted Price is the split-adjusted price. Adjusted Shares is the split-adjusted shares.
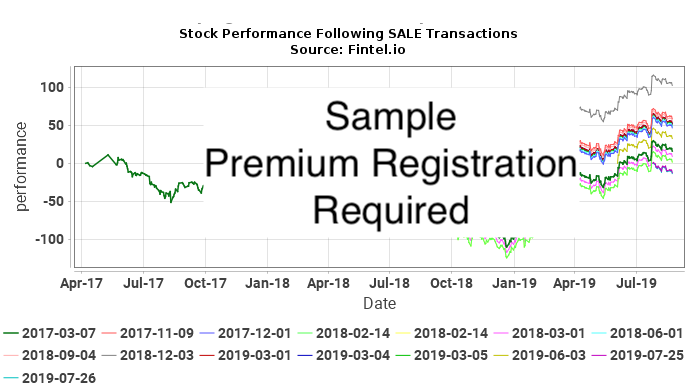
Insider Sales - Short Term Loss Analysis
In this section, we analyze the short-term loss avoidance of every unplanned, open-market insider sale made by Harpreet Rana in RM / Regional Management Corp.. A consistent pattern of loss avoidance may suggest that future sale transactions may predict declines in price. This analysis is for one-year following each trade, and the results are theoretical.
The following table shows the most recent open market purchases that were not part of an automatic trading plan.
| Trade Date | Reported Shares |
Reported Price |
Adjusted Shares |
Adjusted Price |
Cost Basis | Days to Min |
Price at Min |
Max Loss Avoided ($) |
Max Loss Avoided (%) |
|---|---|---|---|---|---|---|---|
| There are no known unplanned open-market trades for this insider |
Adjusted Price is the split-adjusted price. Adjusted Shares is the split-adjusted shares.
Insider Transaction History
| File Date |
Trade Date |
Form | Insider | Ticker | Security Title | Code | Direct | Exercise Price |
Unit Price |
Units Changed |
Value Changed (1K) |
Remaining Options |
Remaining Shares |
|
|---|---|---|---|---|---|---|---|---|---|---|---|---|---|---|
| 2026-05-15 | 2026-05-13 | 4 | Rana Harpreet | RM | Common Stock | D | 14,645 | 46,169 | ||||||
| 2026-04-16 | 2026-04-15 | 4 | Rana Harpreet | RM | Common Stock | D | 38.0900 | -14,978 | -571 | 31,524 | ||||
| 2026-04-16 | 2026-04-14 | 4 | Rana Harpreet | RM | Common Stock | D | 38.0600 | -3,009 | -115 | 46,502 | ||||
| 2026-01-05 | 2025-12-31 | 4 | Rana Harpreet | RM | Common Stock | D | 38.7500 | -6,500 | -252 | 49,511 | ||||
| 2026-01-05 | 2025-12-31 | 4 | Rana Harpreet | RM | Common Stock | D | 38.7500 | -2,041 | -79 | 56,011 | ||||
| 2025-03-19 | 2025-03-17 | 4 | Rana Harpreet | RM | Common Stock | D | 16,644 | 58,052 | ||||||
| 2025-01-31 | 2025-01-29 | 4 | Rana Harpreet | RM | Common Stock | D | 4,919 | 41,408 | ||||||
| 2025-01-03 | 2024-12-31 | 4 | Rana Harpreet | RM | Common Stock | D | 33.9800 | -5,145 | -175 | 36,489 | ||||
| 2024-06-04 | 2024-04-12 | 4 | Rana Harpreet | RM | Common Stock | D | -15,780 | 41,634 | ||||||
| 2024-04-16 | 2024-04-12 | 4 | Rana Harpreet | RM | Common Stock | D | 25.0000 | -1,984 | -50 | 25,854 | ||||
| 2024-04-16 | 2024-04-12 | 4 | Rana Harpreet | RM | Common Stock | D | -5,501 | 27,838 | ||||||
| 2024-01-03 | 2023-12-31 | 4 | Rana Harpreet | RM | Common Stock | D | 25.0800 | -3,377 | -85 | 22,337 | ||||
| 2023-06-16 | 2023-06-14 | 4 | Rana Harpreet | RM | Common Stock | D | 14,580 | 25,714 | ||||||
| 2023-01-04 | 2022-12-31 | 4 | Rana Harpreet | RM | Common Stock | D | 28.0800 | -1,624 | -46 | 11,134 | ||||
| 2022-02-18 | 2022-02-17 | 4 | Rana Harpreet | RM | Common Stock | D | 7,614 | 12,758 | ||||||
| 2022-01-04 | 2021-12-31 | 4 | Rana Harpreet | RM | Common Stock | D | 57.4600 | -749 | -43 | 5,144 | ||||
| 2020-11-24 | 2020-11-23 | 4 | Rana Harpreet | RM | Employee Stock Option (right to buy) | D | 28.21 | 17,371 | 17,371 | |||||
| 2020-11-24 | 2020-11-23 | 4 | Rana Harpreet | RM | Common Stock | D | 5,893 | 5,893 |
P
Compra de mercado aberto ou privada de ativo não-derivativo ou derivativo
S
Venda de mercado aberto ou privada de ativo não-derivativo ou derivativo
A
Concessão, premiação, ou outra aquisição de ativos da empresa (como uma opção)
C
Conversão de derivativo
D
Venda ou transferência de ativos de volta para a empresa
F
Pagamento do preço de exercício ou responsabilidade fiscal utilizando parte dos ativos recebidos da empresa
G
Doação de ativos pelo ou para o insider
K
Swaps de capital e transações de hedge similares
M
Exercício ou conversão de ativo derivativo recebido da empresa (como uma opção)
V
Uma transação voluntariamente reportada no Formulário 4
J
Outro (acompanhado de uma nota explicativa descrevendo a transação)