Estatísticas Básicas
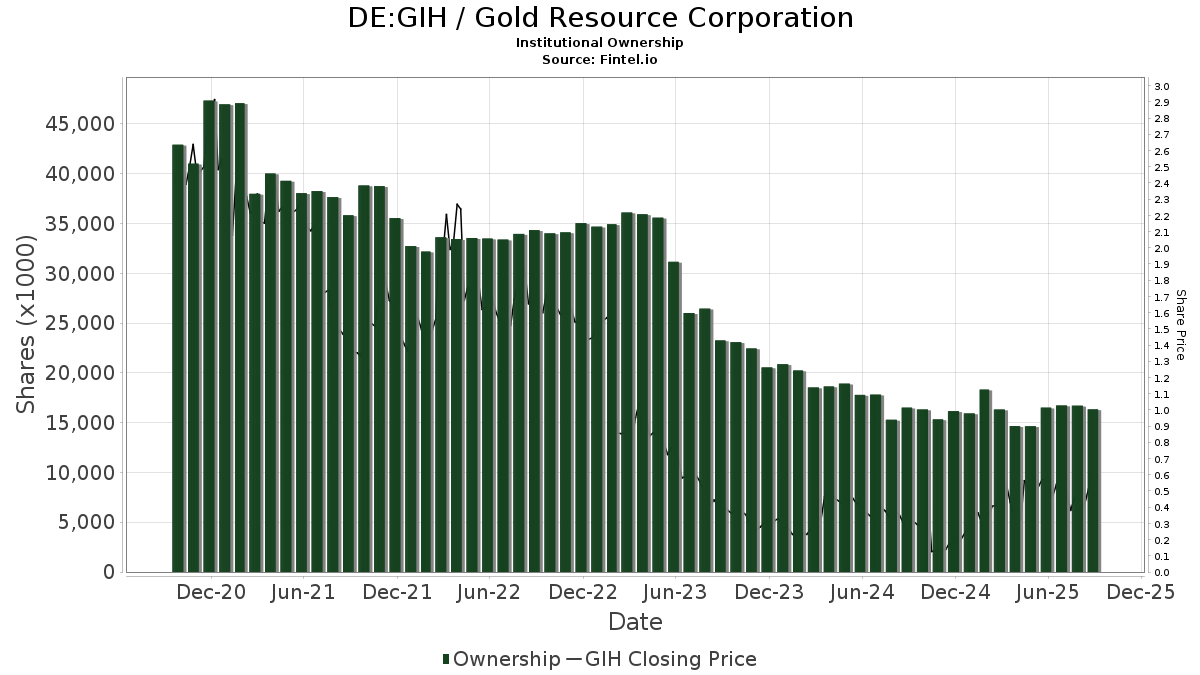
| Ações Institucionais (Longas) | 72,163,941 - 44.58% (ex 13D/G) - change of -0.75MM shares -1.02% MRQ |
| Valor Institucional (Longa) | $ 59,175 USD ($1000) |
Propriedade Institucional e Acionistas
Gold Resource Corporation (DE:GIH) tem 65 proprietários e acionistas institucionais que enviaram os formulários 13D/G ou 13F para a Comissão de Valores Mobiliários (SEC). Essas instituições possuem um total de 72,163,941 ações. Os maiores acionistas incluem Fiscal Wisdom Wealth Management, LLC, Vanguard Group Inc, MIRAE ASSET GLOBAL ETFS HOLDINGS Ltd., VTSMX - Vanguard Total Stock Market Index Fund Investor Shares, SIL - Global X Silver Miners ETF, VEXMX - Vanguard Extended Market Index Fund Investor Shares, Renaissance Technologies Llc, Geode Capital Management, Llc, Two Sigma Investments, Lp, and Citadel Advisors Llc .
Gold Resource Corporation (DB:GIH) a estrutura de propriedade institucional mostra as posições atuais na empresa por instituições e fundos, bem como as últimas mudanças no tamanho da posição. Os principais acionistas podem incluir investidores individuais, fundos mútuos, fundos de cobertura ou instituições. O Schedule 13D indica que o investidor possui (ou possuía) mais de 5% da empresa e pretende (ou pretendia) buscar ativamente uma mudança na estratégia de negócios. O Schedule 13G indica um investimento passivo de mais de 5%.
The share price as of February 26, 2026 is 1.17 / share. Previously, on February 27, 2025, the share price was 0.46 / share. This represents an increase of 154.01% over that period.
Pontuação do Sentimento do Fundo
A Pontuação do Sentimento do Fundo (anteriormente conhecida como Pontuação de Acumulação de Propriedade) identifica as ações que estão sendo mais compradas pelos fundos. É o resultado de um modelo quantitativo sofisticado e multifatorial que identifica empresas com os maiores níveis de acumulação institucional. O modelo de pontuação utiliza uma combinação do aumento total em proprietários divulgados, as mudanças nas alocações de portfólio desses proprietários e outras métricas. O número varia de 0 a 100, com números mais altos indicando um nível maior de acumulação em relação aos seus pares, sendo 50 a média.
Frequência de Atualização: Diariamente
Veja o Explorador de Propriedade, que fornece uma lista das empresas com melhor classificação.
AI+ Ask Fintel’s AI assistant about Gold Resource Corporation.
Select a question to share a public post with an AI-crafted answer.
Thinking of good questions…
Arquivamentos 13F e NPORT
Detalhes sobre Formulários 13F são gratuitos. Detalhes sobre Formulários NP requerem uma assinatura premium. Linhas verdes indicam novas posições. Linhas vermelhas indicam posições fechadas. Clique no ícone de link para ver o histórico completo de transações.
Atualize
para desbloquear dados premium e exportar para Excel ![]() .
.
| Data do Arquivo | Fonte | Investidor | Tipo | Preço Médio (Est) |
Ações | Δ Ações (%) |
Valor Reportado (US$1000) |
Δ Valor (%) |
Aloc. de Portf. (%) |
|
|---|---|---|---|---|---|---|---|---|---|---|
| 2026-01-23 | 13F | Stephenson National Bank & Trust | 942 | -91.37 | 1 | -100.00 | ||||
| 2026-02-12 | 13F | Schneider Downs Wealth Management Advisors, LP | 23,820 | 0.00 | 20 | 0.00 | ||||
| 2026-01-13 | 13F | CoreCap Advisors, LLC | 2,500 | -66.67 | 2 | -66.67 | ||||
| 2026-02-11 | 13F | Jpmorgan Chase & Co | 2,846 | 42.16 | 2 | 100.00 | ||||
| 2026-02-13 | 13F | Wells Fargo & Company/mn | 301 | 30,000.00 | 0 | |||||
| 2026-02-11 | 13F | LPL Financial LLC | 16,598 | -0.09 | 14 | 0.00 | ||||
| 2026-02-12 | 13F | Jane Street Group, Llc | Call | 43,200 | -13.08 | 36 | -14.63 | |||
| 2026-02-17 | 13F | Royal Bank Of Canada | 2,108 | 0.00 | 2 | 0.00 | ||||
| 2026-02-12 | 13F | Jane Street Group, Llc | 837,245 | -26.73 | 693 | -27.43 | ||||
| 2026-01-23 | 13F | Farther Finance Advisors, LLC | 4,487 | 0.00 | 4 | 0.00 | ||||
| 2026-02-17 | 13F | XTX Topco Ltd | 138,592 | 47.52 | 115 | 46.15 | ||||
| 2026-02-13 | 13F | Change Path, LLC | 26,500 | 22 | ||||||
| 2026-02-13 | 13F | Chevy Chase Trust Holdings, Inc. | 34,642 | 0.00 | 29 | 0.00 | ||||
| 2026-02-10 | 13F | Bnp Paribas Arbitrage, Sa | 282 | 0.00 | 0 | |||||
| 2026-02-23 | 13F | Virtu Financial LLC | 0 | -100.00 | 0 | |||||
| 2026-01-15 | 13F | Fortitude Family Office, LLC | 2,121 | 172.62 | 2 | |||||
| 2026-02-17 | 13F | Ancora Advisors, LLC | 30,000 | 25 | ||||||
| 2026-01-21 | 13F | Sound Income Strategies, LLC | 64,257 | 0.16 | 77 | 50.98 | ||||
| 2026-01-22 | 13F | Vision Financial Markets Llc | 300 | 0.00 | 0 | |||||
| 2026-02-05 | 13F | Plancorp, LLC | 0 | -100.00 | 0 | |||||
| 2026-02-13 | 13F | Morgan Stanley | 34,037 | -39.94 | 28 | -40.43 | ||||
| 2026-01-26 | 13F | Whittier Trust Co Of Nevada Inc | 2,000 | 0.00 | 2 | 0.00 | ||||
| 2026-02-06 | 13F | Gsa Capital Partners Llp | 653,119 | 4,894.03 | 1 | |||||
| 2026-02-13 | 13F | SRS Capital Advisors, Inc. | 243 | -86.06 | 0 | -100.00 | ||||
| 2025-08-27 | NP | VEXMX - Vanguard Extended Market Index Fund Investor Shares | 2,219,219 | 59.68 | 1,354 | 91.10 | ||||
| 2026-02-17 | 13F | Susquehanna International Group, Llp | Call | 189,500 | 39.54 | 157 | 37.72 | |||
| 2026-01-29 | 13F | UMA Financial Services, Inc. | 0 | -100.00 | 0 | |||||
| 2026-02-17 | 13F | Susquehanna International Group, Llp | 1,070,251 | 327.88 | 886 | 323.92 | ||||
| 2026-02-17 | 13F | Susquehanna International Group, Llp | Put | 41,500 | -6.95 | 34 | -8.11 | |||
| 2026-01-20 | 13F | JB Capital LLC | 22,000 | 18 | ||||||
| 2026-02-09 | 13F | Geode Capital Management, Llc | 1,442,177 | 0.13 | 1,195 | -0.83 | ||||
| 2025-11-12 | 13F | Paradigm Financial Partners, Llc | 0 | -100.00 | 0 | |||||
| 2026-02-17 | 13F | Two Sigma Investments, Lp | 1,379,868 | 39.98 | 1,143 | 38.59 | ||||
| 2026-01-27 | 13F | TD Waterhouse Canada Inc. | 0 | -100.00 | 0 | |||||
| 2026-01-09 | 13F | Murphy, Middleton, Hinkle & Parker, Inc. | 2,996 | 923 | ||||||
| 2026-02-12 | 13F | Steward Partners Investment Advisory, Llc | 203 | 0.00 | 0 | |||||
| 2026-02-17 | 13F | Ameriprise Financial Inc | 14,514 | 0.00 | 12 | 0.00 | ||||
| 2026-02-12 | 13F | Renaissance Technologies Llc | 1,618,415 | -16.56 | 1,340 | -17.33 | ||||
| 2026-02-17 | 13F | Jones Financial Companies Lllp | 1,995 | 0.00 | 2 | 0.00 | ||||
| 2025-11-13 | 13F | Diversify Advisory Services, LLC | 0 | -100.00 | 0 | -100.00 | ||||
| 2026-01-27 | 13F | Fiscal Wisdom Wealth Management, LLC | 47,565,078 | -2.31 | 39,384 | -1.01 | ||||
| 2025-11-14 | 13F | Wolverine Trading, Llc | Call | 46,600 | 40 | |||||
| 2025-11-14 | 13F | Wolverine Trading, Llc | Put | 10,700 | 9 | |||||
| 2026-02-06 | 13F | Larson Financial Group LLC | 1,000 | 1 | ||||||
| 2026-02-05 | 13F | Allworth Financial LP | 100 | 0.00 | 0 | |||||
| 2026-02-12 | 13F | BlackRock, Inc. | 1,163,581 | 22.54 | 963 | 21.44 | ||||
| 2026-02-11 | 13F | Group One Trading, L.p. | Put | 200 | -99.12 | 0 | -100.00 | |||
| 2026-02-17 | 13F | Citadel Advisors Llc | 1,303,067 | 12.41 | 1,079 | 11.25 | ||||
| 2026-02-17 | 13F | Millennium Management Llc | 26,588 | 22 | ||||||
| 2025-11-14 | 13F | Price T Rowe Associates Inc /md/ | 0 | -100.00 | 0 | |||||
| 2026-01-29 | 13F | UBS Group AG | 117 | 0 | ||||||
| 2026-02-17 | 13F | Citadel Advisors Llc | Put | 57,900 | -11.33 | 48 | -12.96 | |||
| 2026-02-11 | 13F | Group One Trading, L.p. | Call | 15,700 | 15,600.00 | 13 | ||||
| 2026-02-17 | 13F | Citadel Advisors Llc | Call | 69,500 | -10.21 | 58 | -10.94 | |||
| 2026-02-12 | 13F | Alps Advisors Inc | 126,738 | 105 | ||||||
| 2026-02-09 | 13F | Harbour Investments, Inc. | 200 | 0.00 | 0 | |||||
| 2026-02-17 | 13F | Bank Of America Corp /de/ | 1,658 | -83.68 | 1 | -87.50 | ||||
| 2026-02-17 | 13F | Captrust Financial Advisors | 0 | -100.00 | 0 | |||||
| 2026-01-06 | 13F | Tucker Asset Management Llc | 0 | -100.00 | 0 | |||||
| 2026-02-17 | 13F | Two Sigma Securities, Llc | 56,194 | 320.74 | 47 | 318.18 | ||||
| 2025-10-27 | 13F | Stone House Investment Management, LLC | 0 | -100.00 | 0 | |||||
| 2025-08-27 | NP | VITNX - Vanguard Institutional Total Stock Market Index Fund Institutional Shares This fund is a listed as child fund of Vanguard Group Inc and if that institution has disclosed ownership in this security, then these positions will not be double counted when calculating total shares and total value | 76,570 | 153.11 | 47 | 360.00 | ||||
| 2026-01-26 | 13F | Cwm, Llc | 119 | -99.54 | 0 | |||||
| 2026-02-11 | 13F | Simplex Trading, Llc | Call | 97,800 | 163.61 | 81 | ||||
| 2026-02-11 | 13F | Simplex Trading, Llc | Put | 19,100 | -9.05 | 16 | ||||
| 2026-02-11 | 13F | Simplex Trading, Llc | 8,308 | -31.90 | 7 | |||||
| 2026-02-17 | 13F | Old Mission Capital Llc | 0 | -100.00 | 0 | |||||
| 2025-11-14 | 13F | Raymond James Financial Inc | 0 | -100.00 | 0 | -100.00 | ||||
| 2026-01-27 | 13F | Elevated Capital Advisors, LLC | 3,809 | 3 | ||||||
| 2026-02-12 | 13F | Federated Hermes, Inc. | 4,419 | 0.00 | 4 | 0.00 | ||||
| 2026-02-17 | 13F | Two Sigma Advisers, Lp | 425,200 | 74.12 | 352 | 72.55 | ||||
| 2026-02-13 | 13F | Marshall Wace, Llp | 0 | -100.00 | 0 | |||||
| 2026-02-13 | 13F | JustInvest LLC | 12,162 | 10 | ||||||
| 2026-02-13 | 13F | Squarepoint Ops LLC | 0 | -100.00 | 0 | |||||
| 2025-08-27 | NP | VTSMX - Vanguard Total Stock Market Index Fund Investor Shares | 3,723,545 | 0.00 | 2,271 | 19.72 | ||||
| 2026-02-17 | 13F | Northern Trust Corp | 236,876 | -4.59 | 196 | -5.31 | ||||
| 2026-02-17 | 13F | MIRAE ASSET GLOBAL ETFS HOLDINGS Ltd. | 4,524,900 | 11.13 | 3,747 | 10.05 | ||||
| 2026-02-12 | 13F | Hrt Financial Lp | 0 | -100.00 | 0 | |||||
| 2026-02-17 | 13F | Advisor Group Holdings, Inc. | 23,449 | 0.00 | 19 | 72.73 | ||||
| 2026-02-13 | 13F | State Street Corp | 559,416 | 16.83 | 463 | 15.75 | ||||
| 2026-02-17 | 13F | LMR Partners LLP | 33,715 | 28 | ||||||
| 2026-02-17 | 13F | Fmr Llc | 109 | -94.55 | 0 | -100.00 | ||||
| 2026-02-13 | 13F | Citigroup Inc | 2 | -99.90 | 0 | -100.00 | ||||
| 2026-02-03 | 13F | SBI Securities Co., Ltd. | 2,191 | -47.42 | 2 | -66.67 | ||||
| 2026-02-13 | 13F | Victory Capital Management Inc | 18,511 | 15 | ||||||
| 2026-01-29 | 13F | Vanguard Group Inc | 6,074,163 | -1.21 | 5,029 | -2.16 | ||||
| 2026-02-13 | 13F | MAI Capital Management | 0 | 0 | ||||||
| 2025-09-29 | NP | SIL - Global X Silver Miners ETF This fund is a listed as child fund of Mirae Asset Global Investments Co., Ltd. and if that institution has disclosed ownership in this security, then these positions will not be double counted when calculating total shares and total value | 2,548,730 | 17.75 | 1,155 | -14.90 | ||||
| 2026-01-21 | 13F | Capital Advisory Group Advisory Services, LLC | 14,000 | 12 | ||||||
| 2026-02-17 | 13F | Tower Research Capital LLC (TRC) | 0 | -100.00 | 0 | |||||
| 2026-02-12 | 13F | Federation des caisses Desjardins du Quebec | 182 | 0.00 | 0 |