Estatísticas Básicas
| Ações Institucionais (Longas) | 4,060,647 - 37.14% (ex 13D/G) - change of -0.68MM shares -14.26% MRQ |
| Valor Institucional (Longa) | $ 25,148 USD ($1000) |
Propriedade Institucional e Acionistas
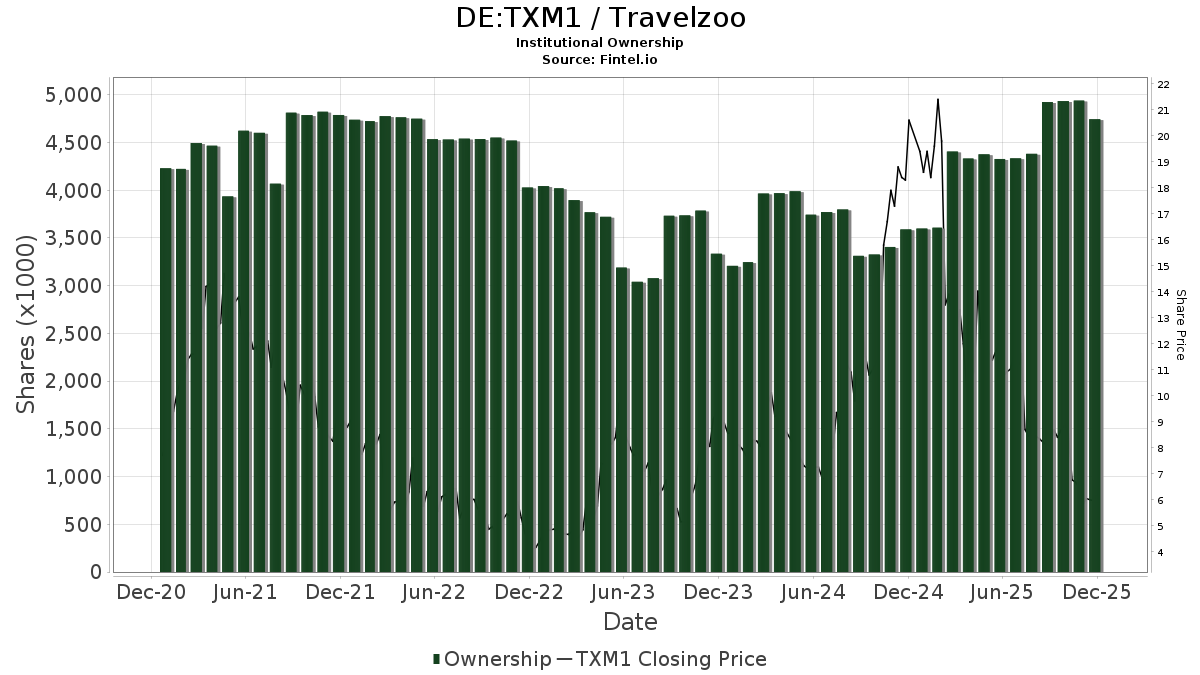
Travelzoo (DE:TXM1) tem 84 proprietários e acionistas institucionais que enviaram os formulários 13D/G ou 13F para a Comissão de Valores Mobiliários (SEC). Essas instituições possuem um total de 4,060,647 ações. Os maiores acionistas incluem Renaissance Technologies Llc, Acadian Asset Management Llc, BlackRock, Inc., Vanguard Group Inc, Dimensional Fund Advisors Lp, Hennion & Walsh Asset Management, Inc., Geode Capital Management, Llc, Goldman Sachs Group Inc, Morgan Stanley, and Jacobs Levy Equity Management, Inc .
Travelzoo (DB:TXM1) a estrutura de propriedade institucional mostra as posições atuais na empresa por instituições e fundos, bem como as últimas mudanças no tamanho da posição. Os principais acionistas podem incluir investidores individuais, fundos mútuos, fundos de cobertura ou instituições. O Schedule 13D indica que o investidor possui (ou possuía) mais de 5% da empresa e pretende (ou pretendia) buscar ativamente uma mudança na estratégia de negócios. O Schedule 13G indica um investimento passivo de mais de 5%.
The share price as of April 2, 2026 is 5.01 / share. Previously, on April 10, 2025, the share price was 11.24 / share. This represents a decline of 55.43% over that period.
Pontuação do Sentimento do Fundo
A Pontuação do Sentimento do Fundo (anteriormente conhecida como Pontuação de Acumulação de Propriedade) identifica as ações que estão sendo mais compradas pelos fundos. É o resultado de um modelo quantitativo sofisticado e multifatorial que identifica empresas com os maiores níveis de acumulação institucional. O modelo de pontuação utiliza uma combinação do aumento total em proprietários divulgados, as mudanças nas alocações de portfólio desses proprietários e outras métricas. O número varia de 0 a 100, com números mais altos indicando um nível maior de acumulação em relação aos seus pares, sendo 50 a média.
Frequência de Atualização: Diariamente
Veja o Explorador de Propriedade, que fornece uma lista das empresas com melhor classificação.
AI+ Ask Fintel’s AI assistant about Travelzoo.
Select a question to share a public post with an AI-crafted answer.
Thinking of good questions…
Arquivamentos 13F e NPORT
Detalhes sobre Formulários 13F são gratuitos. Detalhes sobre Formulários NP requerem uma assinatura premium. Linhas verdes indicam novas posições. Linhas vermelhas indicam posições fechadas. Clique no ícone de link para ver o histórico completo de transações.
Atualize
para desbloquear dados premium e exportar para Excel ![]() .
.
| Data do Arquivo | Fonte | Investidor | Tipo | Preço Médio (Est) |
Ações | Δ Ações (%) |
Valor Reportado (US$1000) |
Δ Valor (%) |
Aloc. de Portf. (%) |
|
|---|---|---|---|---|---|---|---|---|---|---|
| 2026-02-03 | 13F | SBI Securities Co., Ltd. | 2 | 0.00 | 0 | |||||
| 2026-04-07 | 13F | Farther Finance Advisors, LLC | 19 | 171.43 | 0 | |||||
| 2026-01-16 | 13F | Marquette Asset Management, LLC | 207 | 83.19 | 1 | 0.00 | ||||
| 2026-02-12 | 13F | Dimensional Fund Advisors Lp | 230,349 | -10.95 | 1,640 | -35.52 | ||||
| 2026-02-13 | 13F | Marshall Wace, Llp | 0 | -100.00 | 0 | |||||
| 2026-02-17 | 13F | Tower Research Capital LLC (TRC) | 1,475 | 22.41 | 11 | -9.09 | ||||
| 2026-02-09 | 13F | Hartland & Co., LLC | 1 | -97.87 | 0 | |||||
| 2026-02-06 | 13F | Lsv Asset Management | 45,400 | 0.00 | 0 | |||||
| 2026-02-17 | 13F | Russell Investments Group, Ltd. | 1,319 | 122.43 | 9 | 80.00 | ||||
| 2026-02-13 | 13F | Morgan Stanley | 142,731 | 4.59 | 1,016 | -24.24 | ||||
| 2026-02-13 | 13F | SRS Capital Advisors, Inc. | 0 | -100.00 | 0 | |||||
| 2026-02-13 | 13F | Quarry LP | 0 | -100.00 | 0 | |||||
| 2026-02-17 | 13F | Northern Trust Corp | 63,945 | 12.12 | 455 | -18.75 | ||||
| 2026-02-17 | 13F | Jain Global LLC | 10,324 | 74 | ||||||
| 2026-02-06 | 13F | Larson Financial Group LLC | 0 | -100.00 | 0 | |||||
| 2026-02-13 | 13F | Rhumbline Advisers | 6,732 | -18.75 | 48 | -41.98 | ||||
| 2026-02-17 | 13F | Aqr Capital Management Llc | 101,449 | 28.48 | 722 | -6.96 | ||||
| 2026-03-26 | 13F | Leonteq Securities AG | 0 | -100.00 | 0 | |||||
| 2026-02-11 | 13F | LPL Financial LLC | 0 | -100.00 | 0 | -100.00 | ||||
| 2026-02-10 | 13F | Goldman Sachs Group Inc | 145,848 | 170.51 | 1,038 | 96.22 | ||||
| 2026-02-17 | 13F | Advisor Group Holdings, Inc. | 2,740 | -73.80 | 20 | -81.37 | ||||
| 2026-02-06 | 13F | EverSource Wealth Advisors, LLC | 270 | 513.64 | 2 | |||||
| 2026-04-06 | 13F | GAMMA Investing LLC | 1,050 | 6 | ||||||
| 2026-02-13 | 13F | Police & Firemen's Retirement System of New Jersey | 2,469 | 0.00 | 18 | -29.17 | ||||
| 2026-02-11 | 13F | Ameritas Investment Partners, Inc. | 649 | 0.00 | 5 | -33.33 | ||||
| 2026-02-17 | 13F | Advisory Services Network, LLC | 0 | -100.00 | 0 | |||||
| 2026-02-12 | 13F | New York State Common Retirement Fund | 5,800 | 0.00 | 41 | -28.07 | ||||
| 2026-02-13 | 13F | Sterling Capital Management LLC | 41 | 173.33 | 0 | |||||
| 2026-02-02 | 13F | Strs Ohio | 70,800 | 36.68 | 504 | -0.98 | ||||
| 2026-02-11 | 13F | O'shaughnessy Asset Management, Llc | 0 | -100.00 | 0 | |||||
| 2026-02-17 | 13F | Man Group plc | 30,747 | 4.85 | 219 | -24.31 | ||||
| 2026-02-10 | 13F | Bank of New York Mellon Corp | 78,474 | -2.07 | 559 | -29.10 | ||||
| 2026-02-09 | 13F | Quest Partners LLC | 8,158 | 82.79 | 58 | 34.88 | ||||
| 2026-02-17 | 13F | Susquehanna International Group, Llp | 21,605 | -3.87 | 154 | -30.45 | ||||
| 2026-02-17 | 13F | Susquehanna International Group, Llp | Put | 16,900 | 9.74 | 120 | -20.53 | |||
| 2026-02-11 | 13F | Simplex Trading, Llc | 1,456 | 1,790.91 | 10 | |||||
| 2026-01-26 | 13F | Cwm, Llc | 1,000 | -46.50 | 0 | |||||
| 2026-01-29 | 13F | UMA Financial Services, Inc. | 72 | 1 | ||||||
| 2026-02-12 | 13F | Jane Street Group, Llc | 31,215 | 222 | ||||||
| 2025-11-03 | 13F | GPS Wealth Strategies Group, LLC | 0 | -100.00 | 0 | |||||
| 2026-02-17 | 13F | Millennium Management Llc | 0 | -100.00 | 0 | |||||
| 2026-02-17 | 13F | Engineers Gate Manager LP | 16,239 | -7.43 | 116 | -33.14 | ||||
| 2026-02-17 | 13F | Occudo Quantitative Strategies Lp | 0 | -100.00 | 0 | |||||
| 2026-02-13 | 13F | Panagora Asset Management Inc | 21,873 | 0.00 | 156 | -27.91 | ||||
| 2025-11-12 | 13F | Us Bancorp \de\ | 0 | -100.00 | 0 | |||||
| 2026-02-06 | 13F | IFP Advisors, Inc | 2 | 0 | ||||||
| 2026-02-13 | 13F | Verition Fund Management LLC | 15,621 | 0.00 | 111 | -27.45 | ||||
| 2026-02-09 | 13F | Legal & General Group Plc | 704 | 0.00 | 5 | -16.67 | ||||
| 2026-02-11 | 13F | Los Angeles Capital Management Llc | 5,697 | -80.08 | 46 | -83.99 | ||||
| 2026-02-11 | 13F | Deutsche Bank Ag\ | 7,445 | 0.00 | 53 | -27.40 | ||||
| 2026-02-05 | 13F | Allworth Financial LP | 24 | -38.46 | 0 | |||||
| 2026-02-10 | 13F | Rothschild Investment Llc | 6 | 0 | ||||||
| 2026-02-17 | 13F | Trexquant Investment LP | 19,542 | -69.85 | 139 | -78.18 | ||||
| 2026-01-23 | 13F | State of Alaska, Department of Revenue | 3,605 | 0 | ||||||
| 2026-02-11 | 13F | Group One Trading, L.p. | 0 | -100.00 | 0 | |||||
| 2026-02-11 | 13F | Group One Trading, L.p. | Call | 0 | -100.00 | 0 | ||||
| 2026-02-12 | 13F | BlackRock, Inc. | 412,718 | 1.70 | 2,939 | -26.35 | ||||
| 2026-02-17 | 13F | Two Sigma Investments, Lp | 77,831 | 29.77 | 554 | -5.94 | ||||
| 2026-02-10 | 13F | Private Wealth Asset Management, LLC | 1,200 | -35.14 | 9 | -55.56 | ||||
| 2026-02-10 | 13F | Bnp Paribas Arbitrage, Sa | 1,846 | 49.96 | 13 | 8.33 | ||||
| 2026-01-27 | 13F | Evergreen Capital Management Llc | 30,000 | 0.00 | 214 | -27.55 | ||||
| 2026-01-29 | 13F | Vanguard Group Inc | 406,141 | 0.33 | 2,892 | -27.34 | ||||
| 2026-02-13 | 13F | State Street Corp | 86,279 | 4.55 | 614 | -24.29 | ||||
| 2026-02-17 | 13F | MIRAE ASSET GLOBAL ETFS HOLDINGS Ltd. | 3,049 | 2.97 | 22 | -27.59 | ||||
| 2026-02-13 | 13F | Arrowstreet Capital, Limited Partnership | 0 | -100.00 | 0 | |||||
| 2025-11-14 | 13F | Ameriprise Financial Inc | 0 | -100.00 | 0 | |||||
| 2026-02-17 | 13F | PharVision Advisers, LLC | 0 | -100.00 | 0 | |||||
| 2026-02-11 | 13F | Jpmorgan Chase & Co | 2,693 | 6.65 | 19 | -20.83 | ||||
| 2026-02-17 | 13F | Lazard Asset Management Llc | 16,161 | 115 | ||||||
| 2026-02-13 | 13F | MAI Capital Management | 4 | 0 | ||||||
| 2026-01-30 | 13F | R Squared Ltd | 0 | -100.00 | 0 | |||||
| 2026-02-12 | 13F | Voya Investment Management Llc | 27,155 | 43.33 | 193 | 3.76 | ||||
| 2025-11-06 | 13F | Assetmark, Inc | 0 | -100.00 | 0 | -100.00 | ||||
| 2026-01-29 | 13F | UBS Group AG | 10,824 | -35.26 | 77 | -53.05 | ||||
| 2026-02-13 | 13F | Charles Schwab Investment Management Inc | 20,415 | 1.48 | 145 | -26.40 | ||||
| 2025-11-03 | 13F | Kapitalo Investimentos Ltda | 0 | -100.00 | 0 | -100.00 | ||||
| 2026-02-13 | 13F | Citigroup Inc | 904 | -55.71 | 6 | -70.00 | ||||
| 2026-02-17 | 13F | Creative Planning | 20,356 | 0.99 | 145 | -27.27 | ||||
| 2026-02-17 | 13F/A | RBF Capital, LLC | 12,000 | -20.00 | 85 | -42.18 | ||||
| 2026-02-13 | 13F | Squarepoint Ops LLC | 52,288 | 224.49 | 372 | 135.44 | ||||
| 2026-01-08 | 13F | True Wealth Design, LLC | 1 | -94.44 | 0 | |||||
| 2026-02-06 | 13F | Pnc Financial Services Group, Inc. | 67 | 570.00 | 0 | |||||
| 2026-02-17 | 13F | Bank Of America Corp /de/ | 5,460 | 120.34 | 39 | 58.33 | ||||
| 2026-02-20 | 13F | Sunbelt Securities, Inc. | 1 | 0 | ||||||
| 2026-02-17 | 13F | Two Sigma Advisers, Lp | 24,300 | -22.61 | 173 | -43.83 | ||||
| 2026-02-13 | 13F | Barclays Plc | 9,731 | 8.16 | 69 | -21.59 | ||||
| 2026-02-13 | 13F | Jacobs Levy Equity Management, Inc | 105,354 | -33.27 | 750 | -51.64 | ||||
| 2026-02-17 | 13F | Citadel Advisors Llc | 0 | -100.00 | 0 | |||||
| 2026-02-09 | 13F | Geode Capital Management, Llc | 152,519 | -3.47 | 1,086 | -30.07 | ||||
| 2026-02-17 | 13F | California State Teachers Retirement System | 381 | -4.03 | 3 | -33.33 | ||||
| 2026-02-17 | 13F | Royal Bank Of Canada | 3,750 | -72.68 | 26 | -80.60 | ||||
| 2026-01-12 | 13F | AllSquare Wealth Management LLC | 20 | 0.00 | 0 | |||||
| 2026-01-15 | 13F | Fortitude Family Office, LLC | 4 | 0.00 | 0 | |||||
| 2026-01-14 | 13F | Hennion & Walsh Asset Management, Inc. | 224,819 | -0.59 | 1,601 | -28.03 | ||||
| 2025-11-14 | 13F | Raymond James Financial Inc | 0 | -100.00 | 0 | -100.00 | ||||
| 2026-02-05 | 13F | Amalgamated Bank | 195 | -10.14 | 0 | |||||
| 2025-11-13 | 13F | Dynamic Technology Lab Private Ltd | 0 | -100.00 | 0 | |||||
| 2026-02-10 | 13F | State of Wyoming | 0 | -100.00 | 0 | |||||
| 2026-02-12 | 13F | Aristides Capital LLC | 0 | -100.00 | 0 | |||||
| 2026-02-13 | 13F | Transamerica Financial Advisors, Inc. | 8 | 0 | ||||||
| 2026-02-17 | 13F | Jones Financial Companies Lllp | 8 | 0 | ||||||
| 2026-02-13 | 13F | Wells Fargo & Company/mn | 6,787 | 76.19 | 48 | 29.73 | ||||
| 2026-02-17 | 13F | Bridgeway Capital Management Inc | 42,143 | 0.00 | 300 | -27.54 | ||||
| 2026-02-11 | 13F | Cerity Partners LLC | 41,907 | -3.55 | 298 | -30.21 | ||||
| 2026-02-10 | 13F | AdvisorShares Investments LLC | 12,350 | 2.34 | 88 | -26.27 | ||||
| 2026-02-11 | 13F | Simplex Trading, Llc | Call | 0 | -100.00 | 0 | ||||
| 2026-01-23 | 13F | Ritholtz Wealth Management | 0 | -100.00 | 0 | |||||
| 2026-02-13 | 13F | Truvestments Capital Llc | 61,835 | 21.23 | 440 | -12.18 | ||||
| 2026-02-10 | 13F | Koss-Olinger Consulting, LLC | 29,541 | -8.28 | 210 | -48.78 | ||||
| 2026-02-04 | 13F | Summit Wealth Group Llc / Co | 0 | -100.00 | 0 | -100.00 | ||||
| 2026-02-12 | 13F | Renaissance Technologies Llc | 573,901 | -7.61 | 4,086 | -33.08 | ||||
| 2026-02-12 | 13F | Federation des caisses Desjardins du Quebec | 0 | -100.00 | 0 | |||||
| 2026-02-10 | 13F | Acadian Asset Management Llc | 475,279 | -4.81 | 3 | -25.00 | ||||
| 2026-02-17 | 13F | Fmr Llc | 11,317 | 4,076.01 | 81 | 3,900.00 |
Other Listings
| US:TZOO | US$ 6,33 |