Estatísticas Básicas
| Ações Institucionais (Longas) | 17,699,313 - 25.37% (ex 13D/G) - change of 6.34MM shares 55.32% MRQ |
| Valor Institucional (Longa) | $ 29,757 USD ($1000) |
Propriedade Institucional e Acionistas
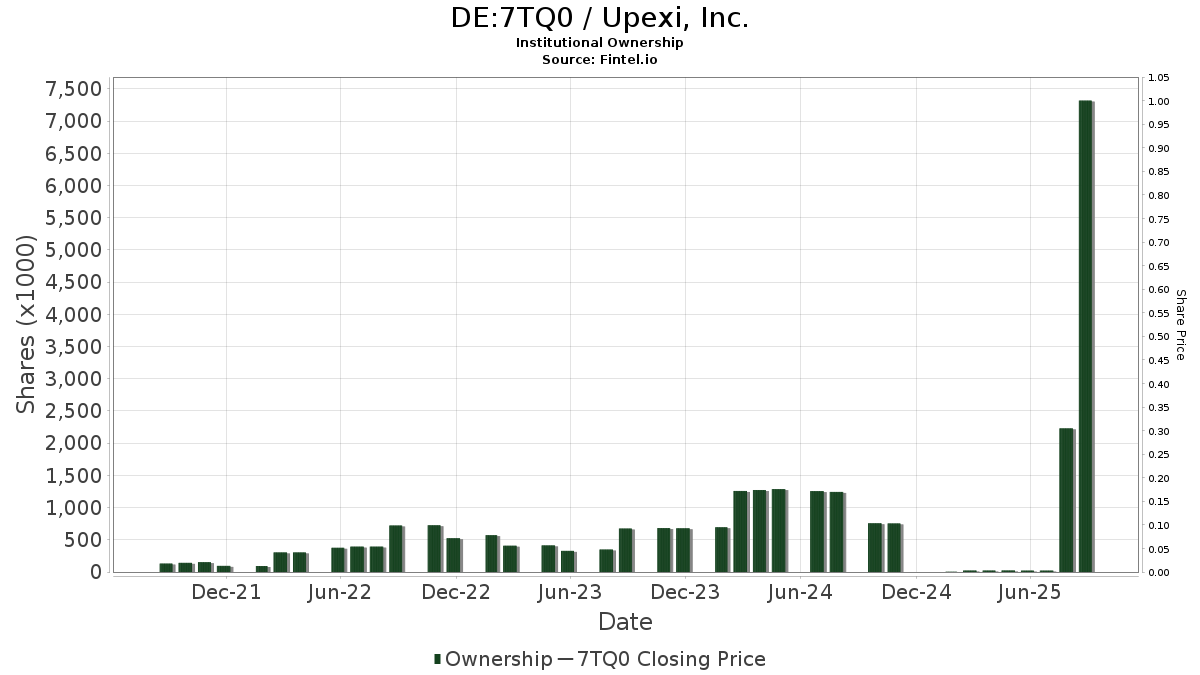
Upexi, Inc. (DE:7TQ0) tem 68 proprietários e acionistas institucionais que enviaram os formulários 13D/G ou 13F para a Comissão de Valores Mobiliários (SEC). Essas instituições possuem um total de 17,699,313 ações. Os maiores acionistas incluem Arrington Capital Management, LLC, Marex Group plc, MMCAP International Inc. SPC, Jane Street Group, Llc, Millennium Management Llc, Jane Street Group, Llc, Susquehanna International Group, Llp, Susquehanna International Group, Llp, Qube Research & Technologies Ltd, and Group One Trading, L.p. .
Upexi, Inc. (DB:7TQ0) a estrutura de propriedade institucional mostra as posições atuais na empresa por instituições e fundos, bem como as últimas mudanças no tamanho da posição. Os principais acionistas podem incluir investidores individuais, fundos mútuos, fundos de cobertura ou instituições. O Schedule 13D indica que o investidor possui (ou possuía) mais de 5% da empresa e pretende (ou pretendia) buscar ativamente uma mudança na estratégia de negócios. O Schedule 13G indica um investimento passivo de mais de 5%.
The share price as of February 27, 2026 is 0.60 / share. Previously, on March 3, 2025, the share price was 2.92 / share. This represents a decline of 79.45% over that period.
Pontuação do Sentimento do Fundo
A Pontuação do Sentimento do Fundo (anteriormente conhecida como Pontuação de Acumulação de Propriedade) identifica as ações que estão sendo mais compradas pelos fundos. É o resultado de um modelo quantitativo sofisticado e multifatorial que identifica empresas com os maiores níveis de acumulação institucional. O modelo de pontuação utiliza uma combinação do aumento total em proprietários divulgados, as mudanças nas alocações de portfólio desses proprietários e outras métricas. O número varia de 0 a 100, com números mais altos indicando um nível maior de acumulação em relação aos seus pares, sendo 50 a média.
Frequência de Atualização: Diariamente
Veja o Explorador de Propriedade, que fornece uma lista das empresas com melhor classificação.
AI+ Ask Fintel’s AI assistant about Upexi, Inc..
Select a question to share a public post with an AI-crafted answer.
Thinking of good questions…
Arquivamentos 13F e NPORT
Detalhes sobre Formulários 13F são gratuitos. Detalhes sobre Formulários NP requerem uma assinatura premium. Linhas verdes indicam novas posições. Linhas vermelhas indicam posições fechadas. Clique no ícone de link para ver o histórico completo de transações.
Atualize
para desbloquear dados premium e exportar para Excel ![]() .
.
| Data do Arquivo | Fonte | Investidor | Tipo | Preço Médio (Est) |
Ações | Δ Ações (%) |
Valor Reportado (US$1000) |
Δ Valor (%) |
Aloc. de Portf. (%) |
|
|---|---|---|---|---|---|---|---|---|---|---|
| 2026-01-13 | 13F | Kathmere Capital Management, LLC | 0 | -100.00 | 0 | |||||
| 2026-02-17 | 13F | Susquehanna International Group, Llp | Call | 591,300 | -71.05 | 993 | -91.57 | |||
| 2026-02-11 | 13F | Winton Capital Group Ltd | 10,581 | 18 | ||||||
| 2026-02-13 | 13F | Barclays Plc | 0 | -100.00 | 0 | -100.00 | ||||
| 2026-02-12 | 13F | BlackRock, Inc. | 681,308 | -0.11 | 1,145 | -70.93 | ||||
| 2026-02-17 | 13F | Susquehanna International Group, Llp | 769,732 | 2.43 | 1,293 | -70.18 | ||||
| 2026-02-17 | 13F | Millennium Management Llc | 846,545 | 131.32 | 1,422 | -32.64 | ||||
| 2026-02-17 | 13F | Susquehanna International Group, Llp | Put | 798,900 | -58.40 | 1,342 | -87.89 | |||
| 2026-02-17 | 13F | Tower Research Capital LLC (TRC) | 33,881 | 1,186.29 | 57 | 273.33 | ||||
| 2026-02-13 | 13F | State Street Corp | 192,022 | 0.00 | 323 | -70.91 | ||||
| 2026-02-13 | 13F | Barclays Plc | Put | 0 | -100.00 | 0 | -100.00 | |||
| 2026-02-17 | 13F | Cetera Investment Advisers | 23,660 | 38.20 | 40 | -60.20 | ||||
| 2026-01-20 | 13F | Signaturefd, Llc | 113 | 0.00 | 0 | |||||
| 2026-02-17 | 13F | Advisor Group Holdings, Inc. | 444,951 | 2,271.68 | 748 | 465.91 | ||||
| 2026-01-14 | 13F | Smith Thornton Advisors LLC | 11,000 | 18 | ||||||
| 2026-02-12 | 13F | CIBC Private Wealth Group, LLC | 4,000 | 7 | ||||||
| 2026-02-17 | 13F | Fmr Llc | 0 | -100.00 | 0 | |||||
| 2026-01-30 | 13F | North Star Investment Management Corp. | 0 | -100.00 | 0 | |||||
| 2026-01-27 | 13F | Aspiring Ventures, LLC | Call | 0 | -100.00 | 0 | -100.00 | |||
| 2026-02-12 | 13F | Jane Street Group, Llc | 899,826 | 46.34 | 1,512 | -57.40 | ||||
| 2026-02-17 | 13F | Parallax Volatility Advisers, L.P. | Call | 0 | -100.00 | 0 | ||||
| 2026-02-17 | 13F | Pinnacle Financial Partners, Inc. | 70,720 | 119 | ||||||
| 2026-02-13 | 13F | Arkadios Wealth Advisors | 0 | -100.00 | 0 | |||||
| 2026-02-12 | 13F | Jane Street Group, Llc | Put | 138,800 | -52.74 | 233 | -86.25 | |||
| 2026-02-12 | 13F | Jane Street Group, Llc | Call | 826,100 | -49.56 | 1,388 | -85.32 | |||
| 2026-02-13 | 13F | National Bank Of Canada /fi/ | 111,300 | 652.03 | 187 | 118.82 | ||||
| 2026-02-12 | 13F | Marex Group plc | 2,507,176 | 289.21 | 4,212 | 13.35 | ||||
| 2026-01-27 | 13F | Aspiring Ventures, LLC | 0 | -100.00 | 0 | -100.00 | ||||
| 2026-02-27 | 13F | Strategic Investment Solutions, Inc. /IL | 0 | -100.00 | 0 | |||||
| 2026-02-17 | 13F | Bank Of America Corp /de/ | 24,913 | 81.52 | 42 | -48.10 | ||||
| 2026-02-17 | 13F | Engineers Gate Manager LP | 120,389 | 808.12 | 202 | 165.79 | ||||
| 2025-09-24 | NP | SWTSX - Schwab Total Stock Market Index Fund This fund is a listed as child fund of Charles Schwab Investment Management Inc and if that institution has disclosed ownership in this security, then these positions will not be double counted when calculating total shares and total value | 15,000 | 70 | ||||||
| 2026-02-17 | 13F | Arrington Capital Management, LLC | 2,760,107 | 4,637 | ||||||
| 2026-02-17 | 13F | Northern Trust Corp | 89,590 | 0.65 | 151 | -70.76 | ||||
| 2026-02-17 | 13F | Private Advisor Group, LLC | 10,725 | 18 | ||||||
| 2026-01-09 | 13F | SG Americas Securities, LLC | 0 | -100.00 | 0 | |||||
| 2026-02-13 | 13F | OMERS ADMINISTRATION Corp | 101,200 | 170 | ||||||
| 2025-09-26 | NP | USMIX - Extended Market Index Fund | 3,336 | 15 | ||||||
| 2025-11-12 | 13F | HAP Trading, LLC | Call | 24,700 | 16 | |||||
| 2026-02-11 | 13F | Jpmorgan Chase & Co | 0 | -100.00 | 0 | -100.00 | ||||
| 2026-02-17 | 13F | Lighthouse Investment Partners, LLC | 18,180 | 31 | ||||||
| 2026-01-05 | 13F | Catherine Avery Investment Management LLC | 250 | 66.67 | 0 | |||||
| 2026-02-10 | 13F | Goldman Sachs Group Inc | 57,455 | 105.73 | 97 | -40.37 | ||||
| 2026-02-13 | 13F | MAI Capital Management | 875 | 0.00 | 1 | -80.00 | ||||
| 2026-02-13 | 13F | Morgan Stanley | 137,788 | -54.24 | 231 | -86.70 | ||||
| 2026-01-08 | 13F | Armstrong Advisory Group, Inc | 1,000 | 0.00 | 2 | -80.00 | ||||
| 2026-02-05 | 13F | Phoenix Holdings Ltd. | 52,000 | -25.71 | 87 | -78.47 | ||||
| 2026-02-09 | 13F | Geode Capital Management, Llc | 499,610 | 9.00 | 840 | -68.28 | ||||
| 2026-02-13 | 13F | Citigroup Inc | 0 | -100.00 | 0 | |||||
| 2026-02-09 | 13F | MMCAP International Inc. SPC | 2,326,777 | 203.39 | 3,909 | -11.68 | ||||
| 2026-02-17 | 13F | XTX Topco Ltd | 152,873 | 388.43 | 257 | 42.22 | ||||
| 2026-02-13 | 13F | Caitong International Asset Management Co., Ltd | 34,397 | 58 | ||||||
| 2026-01-23 | 13F | Farther Finance Advisors, LLC | 32 | -97.90 | 0 | -100.00 | ||||
| 2026-02-13 | 13F | Clear Street Group Inc. | 0 | -100.00 | 0 | |||||
| 2025-12-01 | 13F/A | Cantor Fitzgerald, L. P. | 0 | -100.00 | 0 | -100.00 | ||||
| 2026-01-29 | 13F | Vanguard Group Inc | 710,744 | 0.00 | 1,194 | -70.88 | ||||
| 2026-02-17 | 13F | Quadrature Capital Ltd | 361,657 | 608 | ||||||
| 2026-02-04 | 13F | Ameritas Advisory Services, LLC | 0 | -100.00 | 0 | -100.00 | ||||
| 2026-02-17 | 13F | Warren Averett Asset Management, LLC | 13,725 | 23 | ||||||
| 2026-02-17 | 13F | Cantor Fitzgerald, L. P. | Call | 0 | -100.00 | 0 | ||||
| 2026-02-17 | 13F | Heights Capital Management, Inc | 0 | -100.00 | 0 | |||||
| 2026-02-13 | 13F | Mariner, LLC | 10,000 | 0.00 | 17 | -71.93 | ||||
| 2026-01-27 | 13F | Belpointe Asset Management LLC | 0 | -100.00 | 0 | -100.00 | ||||
| 2026-02-17 | 13F | Balyasny Asset Management Llc | 279,579 | 470 | ||||||
| 2026-02-17 | 13F | Qube Research & Technologies Ltd | 744,441 | 1,251 | ||||||
| 2025-12-17 | 13F | NewGen Asset Management Ltd | 0 | -100.00 | 0 | -100.00 | ||||
| 2026-02-26 | 13F/A | Aristides Capital LLC | 59,342 | 100 | ||||||
| 2026-01-27 | 13F | Gf Fund Management Co. Ltd. | 1,623 | -19.09 | 3 | -81.82 | ||||
| 2026-02-17 | 13F | BlueCrest Capital Management Ltd | 0 | -100.00 | 0 | -100.00 | ||||
| 2026-02-09 | 13F | Jefferies Financial Group Inc. | 10,131 | 17 | ||||||
| 2026-02-17 | 13F | Royal Bank Of Canada | 71 | -97.16 | 0 | -100.00 | ||||
| 2026-02-11 | 13F | J.w. Cole Advisors, Inc. | 15,100 | -3.21 | 25 | -72.22 | ||||
| 2026-02-13 | 13F | Gts Securities Llc | 16,538 | 28 | ||||||
| 2026-02-09 | 13F | Millington Financial Advisors, LLC | 40,000 | 100.00 | 46 | -65.12 | ||||
| 2026-02-12 | 13F | Bank Of Montreal /can/ | 0 | -100.00 | 0 | |||||
| 2026-02-11 | 13F | LPL Financial LLC | Call | 0 | -100.00 | 0 | -100.00 | |||
| 2026-02-17 | 13F | Capital Fund Management S.a. | 0 | -100.00 | 0 | |||||
| 2026-02-17 | 13F | Price T Rowe Associates Inc /md/ | 20,500 | 0 | ||||||
| 2026-02-11 | 13F | LPL Financial LLC | 24,367 | 50.00 | 41 | -56.99 | ||||
| 2026-01-29 | 13F | UBS Group AG | 479,885 | -36.63 | 806 | -81.55 | ||||
| 2026-02-12 | 13F | Commonwealth Equity Services, Llc | 32,625 | 4.15 | 55 | |||||
| 2026-02-13 | 13F | Squarepoint Ops LLC | 0 | -100.00 | 0 | |||||
| 2026-01-21 | 13F | Shariaportfolio, Inc. | 79,828 | -87.18 | 134 | -96.27 | ||||
| 2026-02-23 | 13F | Virtu Financial LLC | 0 | -100.00 | 0 | |||||
| 2026-01-23 | 13F | Valley National Advisers Inc | 0 | -100.00 | 0 | |||||
| 2026-02-12 | 13F | Bank Of Montreal /can/ | Put | 0 | -100.00 | 0 | ||||
| 2026-02-17 | 13F | nVerses Capital, LLC | 10,045 | 17 | ||||||
| 2025-11-07 | 13F | Synovus Financial Corp | 25,100 | 145 | ||||||
| 2026-02-17 | 13F | Point72 Asset Management, L.P. | 406,258 | 683 | ||||||
| 2025-11-13 | 13F | NewGen Equity Long/Short Fund | 0 | -100.00 | 0 | -100.00 | ||||
| 2026-02-17 | 13F | Citadel Advisors Llc | 197,180 | 219.99 | 331 | -6.76 | ||||
| 2026-02-17 | 13F | Lighthouse Investment Partners, LLC | Call | 0 | -100.00 | 0 | ||||
| 2026-02-17 | 13F | Citadel Advisors Llc | Call | 399,700 | -65.05 | 671 | -89.83 | |||
| 2026-02-17 | 13F | Citadel Advisors Llc | Put | 229,200 | -24.26 | 385 | -77.95 | |||
| 2026-02-06 | 13F | Gsa Capital Partners Llp | 0 | -100.00 | 0 | |||||
| 2026-02-13 | 13F | Charles Schwab Investment Management Inc | 0 | -100.00 | 0 | |||||
| 2026-02-09 | 13F | Hartland & Co., LLC | 16,000 | 27 | ||||||
| 2026-02-17 | 13F | Nomura Holdings Inc | 24,000 | 33.33 | 40 | -61.17 | ||||
| 2025-11-14 | 13F | Wolverine Trading, Llc | Put | 0 | -100.00 | 0 | ||||
| 2026-02-13 | 13F | Alyeska Investment Group, L.P. | 0 | -100.00 | 0 | |||||
| 2026-02-17 | 13F | Wealth Watch Advisors, INC | 0 | -100.00 | 0 | |||||
| 2026-02-03 | 13F | SBI Securities Co., Ltd. | 69,086 | -16.05 | 116 | -75.53 | ||||
| 2026-02-11 | 13F | Simplex Trading, Llc | 87,203 | -67.36 | 147 | 14,500.00 | ||||
| 2026-02-17 | 13F | Two Sigma Investments, Lp | 174,767 | 294 | ||||||
| 2026-02-06 | 13F | Keystone Financial Group | 27,325 | 46 | ||||||
| 2026-02-12 | 13F | Rossby Financial, LCC | 5,100 | -76.61 | 9 | -94.37 | ||||
| 2026-02-10 | 13F | Bnp Paribas Arbitrage, Sa | 0 | -100.00 | 0 | |||||
| 2026-02-12 | 13F | Great Valley Advisor Group, Inc. | 11,700 | 9.35 | 20 | -68.85 | ||||
| 2026-02-17 | 13F | Two Sigma Securities, Llc | 18,154 | 30 | ||||||
| 2026-02-17 | 13F | Polar Asset Management Partners Inc. | Put | 0 | -100.00 | 0 | ||||
| 2026-02-17 | 13F | Polar Asset Management Partners Inc. | 0 | -100.00 | 0 | |||||
| 2026-02-17 | 13F | Schonfeld Strategic Advisors LLC | 0 | -100.00 | 0 | |||||
| 2026-01-16 | 13F | FNY Investment Advisers, LLC | 0 | -100.00 | 0 | |||||
| 2026-02-11 | 13F | Group One Trading, L.p. | 728,927 | 1,225 | ||||||
| 2025-11-14 | 13F | Pantera Capital Partners LP | 0 | -100.00 | 0 | -100.00 |
Other Listings
| US:UPXI | US$ 0,66 |