OJU1 - Oramed Pharmaceuticals Inc. Ações - Preço das Ações, Propriedade Institucional, Acionistas (DB)

Oramed Pharmaceuticals Inc.
DE ˙ DB ˙ US68403P2039
€ 2,88 ↓ -0.16 (-5.16%)
2026-03-06
PREÇO DA AÇÃO
Estatísticas Básicas
Proprietários Institucionais 67 total, 67 long only, 0 short only, 0 long/short - change of -2.90% MRQ
Preço da Ação 2.88
Alocação Média no Portfólio 0.1899 % - change of 63.92% MRQ
Ações em Circulação shares (source: Capital IQ)
Ações Institucionais (Longas) 11,133,782 - 27.97% (ex 13D/G) - change of 3.69MM shares 49.59% MRQ
Valor Institucional (Longa) $ 31,453 USD ($1000)
Propriedade Institucional e Acionistas

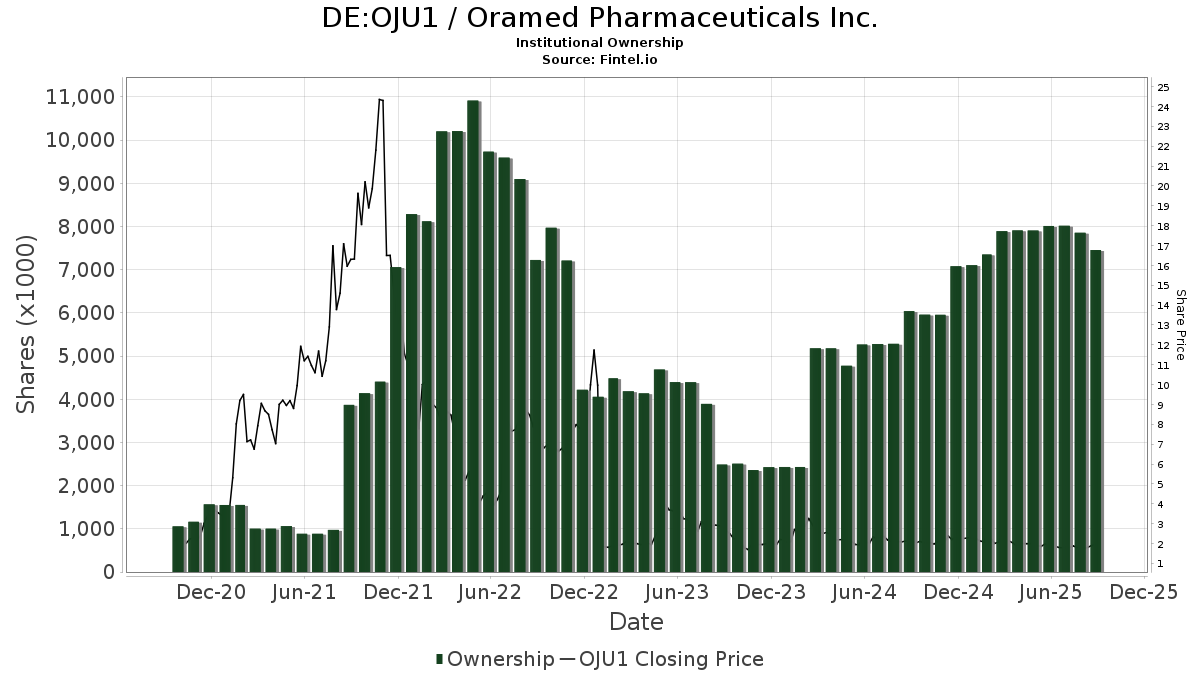
Oramed Pharmaceuticals Inc. (DE:OJU1) tem 67 proprietários e acionistas institucionais que enviaram os formulários 13D/G ou 13F para a Comissão de Valores Mobiliários (SEC). Essas instituições possuem um total de 11,133,782 ações. Os maiores acionistas incluem BML Capital Management, LLC, Aquamarine Financial (Cayman) Ltd, SB Capital Management Inc, Murchinson Ltd., Boothbay Fund Management, Llc, Marshall Wace, Llp, Rathbone Brothers plc, Citadel Advisors Llc, Dimensional Fund Advisors Lp, and Renaissance Technologies Llc .

Oramed Pharmaceuticals Inc. (DB:OJU1) a estrutura de propriedade institucional mostra as posições atuais na empresa por instituições e fundos, bem como as últimas mudanças no tamanho da posição. Os principais acionistas podem incluir investidores individuais, fundos mútuos, fundos de cobertura ou instituições. O Schedule 13D indica que o investidor possui (ou possuía) mais de 5% da empresa e pretende (ou pretendia) buscar ativamente uma mudança na estratégia de negócios. O Schedule 13G indica um investimento passivo de mais de 5%.

The share price as of March 6, 2026 is 2.88 / share. Previously, on March 10, 2025, the share price was 2.35 / share. This represents an increase of 22.67% over that period.

DE:OJU1 / Oramed Pharmaceuticals Inc. Institutional Ownership
Pontuação do Sentimento do Fundo

A Pontuação do Sentimento do Fundo (anteriormente conhecida como Pontuação de Acumulação de Propriedade) identifica as ações que estão sendo mais compradas pelos fundos. É o resultado de um modelo quantitativo sofisticado e multifatorial que identifica empresas com os maiores níveis de acumulação institucional. O modelo de pontuação utiliza uma combinação do aumento total em proprietários divulgados, as mudanças nas alocações de portfólio desses proprietários e outras métricas. O número varia de 0 a 100, com números mais altos indicando um nível maior de acumulação em relação aos seus pares, sendo 50 a média.

Frequência de Atualização: Diariamente

Veja o Explorador de Propriedade, que fornece uma lista das empresas com melhor classificação.

AI+ Ask Fintel’s AI assistant about Oramed Pharmaceuticals Inc..

Select a question to share a public post with an AI-crafted answer.

Thinking of good questions…
Arquivamentos 13F e NPORT

Detalhes sobre Formulários 13F são gratuitos. Detalhes sobre Formulários NP requerem uma assinatura premium. Linhas verdes indicam novas posições. Linhas vermelhas indicam posições fechadas. Clique no ícone de link para ver o histórico completo de transações.

Atualize para desbloquear dados premium e exportar para Excel .

Data do Arquivo Fonte Investidor Tipo Preço Médio
(Est)
Ações Δ Ações
(%)
Valor
Reportado
(US$1000)
Δ Valor
(%)
Aloc. de Portf.
(%)
2026-02-11 13F LPL Financial LLC 13,185 -2.94 38 5.71
2026-02-13 13F American Century Companies Inc 19,591 0.00 56 7.84
2026-02-06 13F/A Rathbone Brothers plc 233,018 0.00 664 7.97
2025-09-25 NP DCOR - Dimensional US Core Equity 1 ETF 4,523 0.00 10 -10.00
2026-02-05 13F Allworth Financial LP 0 -100.00 0
2026-02-13 13F Marshall Wace, Llp 259,055 738
2026-02-17 13F Advisor Group Holdings, Inc. 4,317 0.00 12 33.33
2026-02-17 13F Fmr Llc 500 0.00 1 0.00
2026-02-17 13F Murchinson Ltd. 1,340,247 -23.48 3,820 -17.41
2026-02-17 13F Prelude Capital Management, Llc 21,613 62
2026-01-30 13F Urban Wealth Management, LLC 0 -100.00 0 -100.00
2026-02-12 13F Renaissance Technologies Llc 147,500 -0.94 420 6.87
2025-11-07 13F Beacon Capital Management, LLC 0 -100.00 0
2026-02-13 13F Morgan Stanley 17,634 4.20 50 13.64
2026-01-21 13F Newbridge Financial Services Group, Inc. 0 -100.00 0
2026-02-11 13F Jpmorgan Chase & Co 17,278 10,063.53 49
2025-11-10 13F Peapod Lane Capital LLC 0 -100.00 0 -100.00
2025-09-25 NP DXUV - Dimensional US Vector Equity ETF 4 0.00 0
2025-11-14 13F Susquehanna International Group, Llp Call 0 -100.00 0 -100.00
2026-02-03 13F BML Capital Management, LLC 3,167,231 0.00 9,027 7.95
2026-02-13 13F MAI Capital Management 2,055 0.00 6 0.00
2026-01-28 13F N.E.W. Advisory Services LLC 3,200 9
2026-02-17 13F Tower Research Capital LLC (TRC) 693 2
2025-09-25 NP DFFVX - U.S. Targeted Value Portfolio - Institutional Class This fund is a listed as child fund of Dimensional Fund Advisors Lp and if that institution has disclosed ownership in this security, then these positions will not be double counted when calculating total shares and total value 13,879 0.00 30 -9.37
2026-02-17 13F Point72 Asset Management, L.P. 25,442 73
2026-02-20 13F SB Capital Management Inc 1,900,000 5,415
2026-02-17 13F Royal Bank Of Canada 0 -100.00 0
2025-09-26 NP USMIX - Extended Market Index Fund 3,245 -16.69 7 -14.29
2026-02-17 13F/A RBF Capital, LLC 42,947 0.00 122 7.96
2026-02-10 13F/A Northwestern Mutual Wealth Management Co 1,706 8.32 5 0.00
2026-02-17 13F Two Sigma Securities, Llc 23,143 66
2026-02-17 13F Boothbay Fund Management, Llc 612,160 -27.59 1,745 -21.83
2026-01-16 13F Hopwood Financial Services, Inc. 0 -100.00 0
2026-01-15 13F Sage Capital Management, LLC 16,750 0.00 48 6.82
2026-02-10 13F Connor, Clark & Lunn Investment Management Ltd. 43,735 54.85 125 67.57
2026-02-13 13F Squarepoint Ops LLC 58,272 95.11 166 112.82
2025-11-14 13F National Bank Of Canada /fi/ 0 -100.00 0
2025-09-25 NP DFAT - Dimensional U.S. Targeted Value ETF 24,088 0.00 52 -7.27
2026-01-28 13F Aquamarine Financial (Cayman) Ltd 1,973,057 0.00 5,623 7.97
2026-02-03 13F SBI Securities Co., Ltd. 1,590 0.00 5 0.00
2026-02-09 13F Geode Capital Management, Llc 24,282 0.00 69 7.81
2026-01-08 13F Wealth Enhancement Advisory Services, Llc 18,299 -2.66 56 21.74
2025-11-14 13F State Street Corp 0 -100.00 0 -100.00
2026-02-12 13F Hrt Financial Lp 46,091 0
2026-02-17 13F Bank Of America Corp /de/ 142,243 -4.96 405 2.53
2026-02-12 13F Steward Partners Investment Advisory, Llc 9,266 4.99 26 13.04
2025-09-25 NP DFA INVESTMENT DIMENSIONS GROUP INC - U.S. Social Core Equity 2 Portfolio Shares This fund is a listed as child fund of Dimensional Fund Advisors Lp and if that institution has disclosed ownership in this security, then these positions will not be double counted when calculating total shares and total value 4,929 11
2026-02-12 13F BlackRock, Inc. 90,212 -17.79 257 -11.07
2026-02-11 13F Group One Trading, L.p. Call 6,500 -87.71 19 -87.05
2026-02-12 13F Jane Street Group, Llc 78,259 31.18 223 42.04
2026-02-03 13F McIlrath & Eck, LLC 1,000 0.00 3 0.00
2025-09-25 NP DFAS - Dimensional U.S. Small Cap ETF 6,536 0.00 14 0.00
2026-02-06 13F Pnc Financial Services Group, Inc. 21,200 -8.62 60 -1.64
2025-09-25 NP DFAC - Dimensional U.S. Core Equity 2 ETF 36,536 14.68 79 6.85
2026-02-13 13F Golden State Wealth Management, LLC 303 0.00 1
2026-02-17 13F Quadrature Capital Ltd 41,734 119
2026-02-06 13F IFP Advisors, Inc 500 0.00 1 0.00
2025-09-25 NP DFQTX - U.s. Core Equity 2 Portfolio - Institutional Class This fund is a listed as child fund of Dimensional Fund Advisors Lp and if that institution has disclosed ownership in this security, then these positions will not be double counted when calculating total shares and total value 23,349 0.00 50 -7.41
2026-01-22 13F Glass Jacobson Investment Advisors llc 10,540 0.00 30 11.11
2026-02-17 13F Altshuler Shaham Ltd 11,211 0.00 32 6.90
2026-02-13 13F Citigroup Inc 0 -100.00 0
2026-02-09 13F Huntington National Bank 3,002 0.00 9 14.29
2026-03-06 13F Redwood Family Wealth LLC 23,000 66
2026-02-11 13F Simplex Trading, Llc 1,145 3
2026-02-11 13F Simplex Trading, Llc Call 100 -94.74 0
2026-02-17 13F XTX Topco Ltd 38,182 59.86 109 71.43
2026-02-18 13F Caitlin John, LLC 1,000 3
2026-02-17 13F Algert Global Llc 12,068 0
2026-02-17 13F Jones Financial Companies Lllp 714 0.00 2 100.00
2025-11-14 13F Citadel Advisors Llc Call 0 -100.00 0 -100.00
2026-02-17 13F Citadel Advisors Llc 196,020 75.48 559 89.80
2026-02-10 13F Close Asset Management Ltd 11,675 0.00 0
2026-02-12 13F Dimensional Fund Advisors Lp 150,471 2.02 429 10.03
2025-11-14 13F Raymond James Financial Inc 0 -100.00 0
2025-09-25 NP DFUS - Dimensional U.S. Equity ETF 3,431 0.00 7 0.00
2026-02-13 13F Wells Fargo & Company/mn 130,586 0.38 372 8.45
2025-09-25 NP DFEOX - U.s. Core Equity 1 Portfolio - Institutional Class This fund is a listed as child fund of Dimensional Fund Advisors Lp and if that institution has disclosed ownership in this security, then these positions will not be double counted when calculating total shares and total value 3,131 0.00 7 -14.29
2026-02-17 13F Susquehanna International Group, Llp 25,984 -29.44 74 -23.71
2026-02-13 13F Barclays Plc 6,917 -47.59 20 -44.12
2026-02-13 13F Mariner, LLC 11,021 0.00 31 6.90
2026-01-29 13F UBS Group AG 2,575 621.29 7
Other Listings
US:ORMP US$ 3,28
Fintel data has been cited in the following publications:
Daily Mail Fox Business Business Insider Wall Street Journal The Washington Post Bloomberg Financial Times Globe and Mail
NASDAQ.com Reuters The Guardian Associated Press FactCheck.org Snopes Politifact
Federal Register The Intercept Forbes Fortune Magazine TheStreet Time Magazine Canadian Broadcasting Corporation International Business Times
Cambridge University Press Investopedia MarketWatch NY Daily News Entrepreneur Newsweek Barron's El Economista