Estatísticas Básicas
| Proprietários Institucionais | 583 total, 550 long only, 1 short only, 32 long/short - change of -7.73% MRQ |
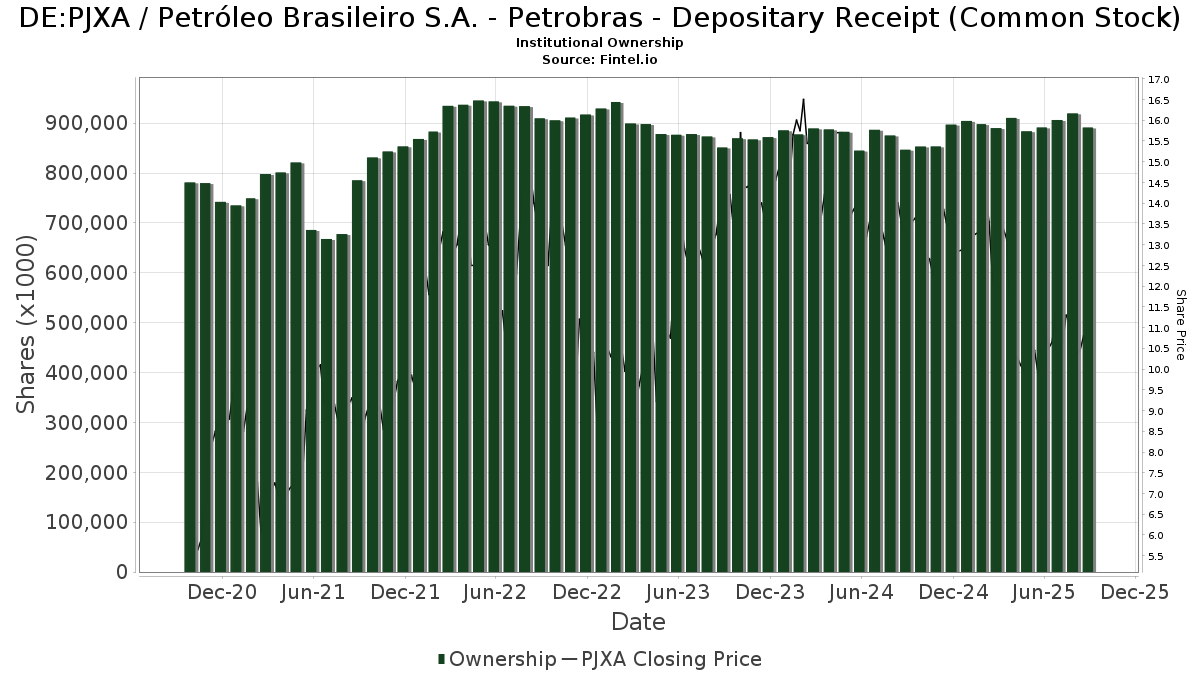
| Preço da Ação | 14.30 |
| Alocação Média no Portfólio | 0.3152 % - change of -3.96% MRQ |
| Ações Institucionais (Longas) | 747,001,360 (ex 13D/G) - change of -101.27MM shares -11.67% MRQ |
| Valor Institucional (Longa) | $ 8,806,410 USD ($1000) |
Propriedade Institucional e Acionistas
Petróleo Brasileiro S.A. - Petrobras - Depositary Receipt (Common Stock) (DE:PJXA) tem 583 proprietários e acionistas institucionais que enviaram os formulários 13D/G ou 13F para a Comissão de Valores Mobiliários (SEC). Essas instituições possuem um total de 747,001,360 ações. Os maiores acionistas incluem GQG Partners LLC, GSIHX - Goldman Sachs GQG Partners International Opportunities Fund Class A Shares, GQGPX - GQG PARTNERS EMERGING MARKETS EQUITY FUND Investor Shares, Capital International Investors, Baillie Gifford & Co, Invesco Ltd., Schroder Investment Management Group, Lazard Asset Management Llc, Itau Unibanco Holding S.A., and ARGA Investment Management, LP .
Petróleo Brasileiro S.A. - Petrobras - Depositary Receipt (Common Stock) (DB:PJXA) a estrutura de propriedade institucional mostra as posições atuais na empresa por instituições e fundos, bem como as últimas mudanças no tamanho da posição. Os principais acionistas podem incluir investidores individuais, fundos mútuos, fundos de cobertura ou instituições. O Schedule 13D indica que o investidor possui (ou possuía) mais de 5% da empresa e pretende (ou pretendia) buscar ativamente uma mudança na estratégia de negócios. O Schedule 13G indica um investimento passivo de mais de 5%.
The share price as of February 26, 2026 is 14.30 / share. Previously, on February 27, 2025, the share price was 12.75 / share. This represents an increase of 12.16% over that period.
Pontuação do Sentimento do Fundo
A Pontuação do Sentimento do Fundo (anteriormente conhecida como Pontuação de Acumulação de Propriedade) identifica as ações que estão sendo mais compradas pelos fundos. É o resultado de um modelo quantitativo sofisticado e multifatorial que identifica empresas com os maiores níveis de acumulação institucional. O modelo de pontuação utiliza uma combinação do aumento total em proprietários divulgados, as mudanças nas alocações de portfólio desses proprietários e outras métricas. O número varia de 0 a 100, com números mais altos indicando um nível maior de acumulação em relação aos seus pares, sendo 50 a média.
Frequência de Atualização: Diariamente
Veja o Explorador de Propriedade, que fornece uma lista das empresas com melhor classificação.
AI+ Ask Fintel’s AI assistant about Petróleo Brasileiro S.A. - Petrobras - Depositary Receipt (Common Stock).
Select a question to share a public post with an AI-crafted answer.
Thinking of good questions…
Arquivamentos 13F e NPORT
Detalhes sobre Formulários 13F são gratuitos. Detalhes sobre Formulários NP requerem uma assinatura premium. Linhas verdes indicam novas posições. Linhas vermelhas indicam posições fechadas. Clique no ícone de link para ver o histórico completo de transações.
Atualize
para desbloquear dados premium e exportar para Excel ![]() .
.
Important Note
In an effort to reduce load times for our mobile users, we are testing some ways to deliver lighter pages.
In this first test, we will deliver only the most recent 750 transactions (out of 778 for this stock). If you are interested in loading *all* the transactions for this company, click the "load all" button below. This is just a test and if you don't like it, please let us know by submitting some gentle feedback via the link at the bottom of this page.
Load All| Data do Arquivo | Fonte | Investidor | Tipo | Preço Médio (Est) |
Ações | Δ Ações (%) |
Valor Reportado (US$1000) |
Δ Valor (%) |
Aloc. de Portf. (%) |
|
|---|---|---|---|---|---|---|---|---|---|---|
| 2025-11-05 | 13F | Wellington Shields Capital Management, LLC | 0 | -100.00 | 0 | |||||
| 2025-08-29 | NP | Gabelli Global Utility & Income Trust | 10,000 | 0.00 | 125 | -12.59 | ||||
| 2026-01-22 | 13F | V-Square Quantitative Management LLC | 6,489 | 77 | ||||||
| 2026-02-17 | 13F | Optiver Holding B.V. | 2,223,170 | -12.33 | 26,345 | -17.94 | ||||
| 2026-02-05 | 13F | Park Square Financial Group, LLC | 513 | 7 | ||||||
| 2026-02-17 | 13F | Optiver Holding B.V. | Call | 7,063,400 | -9.11 | 83,701 | -14.92 | |||
| 2026-01-20 | 13F | Ascent Group, LLC | 14,014 | -22.26 | 166 | -27.19 | ||||
| 2026-02-14 | 13F | Silver Grove Financial Group, Inc. | 2,000 | 24 | ||||||
| 2025-11-14 | 13F | Turim 21 Investimentos Ltda. | 0 | -100.00 | 0 | |||||
| 2026-01-26 | 13F | Moran Wealth Management, LLC | 535,044 | 17.99 | 6,340 | 10.43 | ||||
| 2026-02-02 | 13F | Qrg Capital Management, Inc. | 36,280 | 1.08 | 430 | -5.51 | ||||
| 2025-11-17 | 13F | Perritt Capital Management Inc | 0 | -100.00 | 0 | -100.00 | ||||
| 2026-02-13 | 13F | Ieq Capital, Llc | 57,671 | 23.82 | 683 | 15.96 | ||||
| 2026-02-17 | 13F | Optiver Holding B.V. | Put | 10,087,400 | 27,920.56 | 119,536 | 28,025.88 | |||
| 2026-02-06 | 13F | EverSource Wealth Advisors, LLC | 2,059 | -11.29 | 24 | -17.24 | ||||
| 2026-02-12 | 13F | Scotia Capital Inc. | 0 | -100.00 | 0 | |||||
| 2025-08-27 | NP | RYWTX - Emerging Markets 2x Strategy Fund Class A | 9,905 | 147.93 | 124 | 115.79 | ||||
| 2026-02-12 | 13F | StoneX Group Inc. | 15,442 | 185 | ||||||
| 2026-02-17 | 13F | one8zero8, LLC | 70,273 | 17,468.25 | 833 | 20,700.00 | ||||
| 2026-02-17 | 13F | Advisory Services Network, LLC | 29,984 | 2,507.30 | 355 | 2,630.77 | ||||
| 2026-02-06 | 13F | Payden & Rygel | 10,210 | 0.00 | 0 | |||||
| 2026-01-30 | 13F | Camden Capital, LLC | 250,000 | 0.00 | 2,962 | -6.41 | ||||
| 2026-02-02 | 13F | Ping Capital Management, Inc. | 392,100 | 46.31 | 4,646 | 36.97 | ||||
| 2025-09-26 | NP | RTNAX - Tax-Managed International Equity Fund Class A | 709,831 | 24.00 | 9,043 | 39.94 | ||||
| 2025-09-26 | NP | EPIN - Harbor International Equity ETF | 4,296 | 55 | ||||||
| 2026-02-11 | 13F | Group One Trading, L.p. | 1,535,545 | 9.35 | 18,196 | 2.36 | ||||
| 2026-01-14 | 13F | Generali Investments CEE, investicni spolecnost, a.s. | 149,600 | -2.48 | 1,773 | -8.75 | ||||
| 2026-02-11 | 13F | Group One Trading, L.p. | Call | 2,074,400 | 0.43 | 24,582 | 0.68 | |||
| 2026-02-13 | 13F | Resources Investment Advisors, LLC. | 10,874 | -10.73 | 129 | -16.88 | ||||
| 2026-02-11 | 13F | Group One Trading, L.p. | Put | 139,000 | -92.83 | 1,567 | -93.62 | |||
| 2025-09-26 | NP | FSGEX - Fidelity Series Global ex U.S. Index Fund This fund is a listed as child fund of Fmr Llc and if that institution has disclosed ownership in this security, then these positions will not be double counted when calculating total shares and total value | 9 | 0.00 | 0 | |||||
| 2026-02-06 | 13F | Lsv Asset Management | 22,000 | 0.00 | 0 | |||||
| 2026-02-04 | 13F | HighPoint Advisor Group LLC | 0 | -100.00 | 0 | |||||
| 2026-01-07 | 13F | Sovereign Financial Group, Inc. | 10,617 | 0.00 | 126 | -6.72 | ||||
| 2026-02-03 | 13F | We Are One Seven, LLC | 56,274 | 10.62 | 667 | 3.42 | ||||
| 2026-02-17 | 13F | Advisor Group Holdings, Inc. | 194,642 | -32.39 | 2,306 | -36.07 | ||||
| 2026-02-11 | 13F | Simplex Trading, Llc | Call | 0 | -100.00 | 0 | ||||
| 2026-02-11 | 13F | Simplex Trading, Llc | 0 | -100.00 | 0 | |||||
| 2025-10-16 | 13F | Kingstone Capital Partners Texas, LLC | 0 | -100.00 | 0 | -100.00 | ||||
| 2025-08-29 | NP | LIVR - Intelligent Livermore ETF | 23,859 | 298 | ||||||
| 2026-01-28 | 13F | Retirement Planning Co of New England, Inc. | 48,376 | 15.46 | 573 | 8.11 | ||||
| 2026-02-11 | 13F | Simplex Trading, Llc | Put | 0 | -100.00 | 0 | ||||
| 2026-02-12 | 13F | SWAN Capital LLC | 350 | 0.00 | 4 | 0.00 | ||||
| 2026-01-26 | 13F | Ckw Financial Group | 59 | 0.00 | 0 | |||||
| 2026-02-11 | 13F | Capital International Investors | 30,637,308 | 51.58 | 363,052 | 41.88 | ||||
| 2026-02-03 | 13F | Anfield Capital Management, LLC | 7,322 | 0.00 | 87 | -6.52 | ||||
| 2026-02-19 | 13F | Atomi Financial Group, Inc. | 48,415 | -3.30 | 574 | -9.48 | ||||
| 2026-02-18 | 13F | Beacon Pointe Advisors, LLC | 23,289 | -36.52 | 276 | -40.73 | ||||
| 2026-02-17 | 13F | Farringdon Capital, Ltd. | 49,661 | -69.32 | 588 | -71.29 | ||||
| 2026-02-13 | 13F | Macquarie Group Ltd | 0 | -100.00 | 0 | |||||
| 2026-02-11 | 13F | Fore Capital, LLC | 80,000 | 948 | ||||||
| 2026-02-17 | 13F | Voloridge Investment Management, Llc | 1,633,914 | -31.71 | 19,362 | -36.08 | ||||
| 2026-02-10 | 13F | Acadian Asset Management Llc | 57,234 | 141.76 | 1 | |||||
| 2026-02-17 | 13F | Fearnley Asset Management As | 399,595 | 17,590 | ||||||
| 2026-02-11 | 13F | Accuvest Global Advisors | 27,250 | 323 | ||||||
| 2026-02-17 | 13F | Stokes Family Office, LLC | 10,271 | 2.71 | 122 | -3.97 | ||||
| 2026-02-17 | 13F | Qube Research & Technologies Ltd | 909,787 | -30.13 | 10,781 | -34.60 | ||||
| 2026-02-02 | 13F | Chung Wu Investment Group, LLC | 3,000 | 0.00 | 36 | -5.41 | ||||
| 2026-02-17 | 13F | Capital Fund Management S.a. | 176,798 | 95.17 | 2,095 | 82.81 | ||||
| 2026-01-15 | 13F | Founders Capital Management | 5,000 | 0.00 | 59 | -6.35 | ||||
| 2026-02-17 | 13F | Cetera Investment Advisers | 434,723 | -4.76 | 5,151 | -10.85 | ||||
| 2026-02-12 | 13F | Campbell & CO Investment Adviser LLC | 63,510 | -48.50 | 753 | -51.83 | ||||
| 2025-08-27 | NP | Advanced Series Trust - Ast International Growth Portfolio | 87,809 | -5.71 | 1,098 | -17.75 | ||||
| 2026-02-13 | 13F | SRS Capital Advisors, Inc. | 9,241 | 47.31 | 110 | 37.97 | ||||
| 2026-02-09 | 13F | MQS Management LLC | 16,771 | 199 | ||||||
| 2026-01-30 | 13F | R Squared Ltd | 43,842 | 10.28 | 520 | 3.18 | ||||
| 2026-02-13 | 13F | BNP Paribas Asset Management Holding S.A. | 154,320 | 2 | ||||||
| 2025-09-25 | NP | DFEV - Dimensional Emerging Markets Value ETF | 247,256 | 3,150 | ||||||
| 2026-02-12 | 13F | ICICI Prudential Asset Management Co Ltd | 0 | -100.00 | 0 | |||||
| 2026-02-05 | 13F | Stephens Inc /ar/ | 41,714 | 494 | ||||||
| 2026-02-11 | 13F | Parallel Advisors, LLC | 22,125 | -5.60 | 262 | -11.49 | ||||
| 2026-02-17 | 13F | Tower Research Capital LLC (TRC) | 819 | 8.76 | 10 | 0.00 | ||||
| 2026-02-13 | 13F | Kestra Advisory Services, LLC | 0 | -100.00 | 0 | |||||
| 2026-01-26 | 13F | Drum Hill Capital, LLC | 131,646 | -0.95 | 1,560 | -7.25 | ||||
| 2025-08-27 | NP | THRIVENT SERIES FUND INC - Thrivent International Allocation Portfolio Class A | 26,146 | 90.68 | 327 | 66.84 | ||||
| 2026-01-05 | 13F | Park Avenue Securities Llc | 19,738 | 7.96 | 0 | |||||
| 2026-02-17 | 13F | Virtus Investment Advisers, Inc. | 0 | -100.00 | 0 | |||||
| 2026-02-06 | 13F | HighTower Advisors, LLC | 123,418 | 19.92 | 1,463 | 12.29 | ||||
| 2026-02-12 | 13F | Steward Partners Investment Advisory, Llc | 96,646 | -17.70 | 1,145 | -22.95 | ||||
| 2026-02-11 | 13F | Ramirez Asset Management, Inc. | 87 | 1 | ||||||
| 2026-02-13 | 13F | Natixis | 160,063 | 83.04 | 1,897 | 71.27 | ||||
| 2026-02-17 | 13F | Cresset Asset Management, LLC | 0 | -100.00 | 0 | |||||
| 2025-11-12 | 13F | Quantbot Technologies LP | 0 | -100.00 | 0 | |||||
| 2026-01-28 | 13F | Geneos Wealth Management Inc. | 2,000 | 0.00 | 24 | -8.00 | ||||
| 2026-02-12 | 13F | JBF Capital, Inc. | 62,000 | 3.33 | 699 | -1.55 | ||||
| 2026-01-15 | 13F | Highline Wealth Partners Llc | 1,053 | 18.45 | 12 | 9.09 | ||||
| 2026-02-04 | 13F | D'Orazio & Associates, Inc. | 12,498 | -14.43 | 148 | -19.57 | ||||
| 2026-02-12 | 13F | BlackRock, Inc. | 11,573,196 | 3.67 | 137,142 | -2.96 | ||||
| 2026-02-11 | 13F | Capital Wealth Planning, LLC | 257,372 | 37.62 | 3,068 | 29.57 | ||||
| 2026-02-05 | 13F | May Hill Capital, LLC | 0 | -100.00 | 0 | |||||
| 2026-02-13 | 13F | Vontobel Holding Ltd. | 85,551 | 98.69 | 1,014 | 85.87 | ||||
| 2025-10-08 | 13F | Retirement Wealth Solutions LLC | 0 | -100.00 | 0 | -100.00 | ||||
| 2025-11-13 | 13F | Eisler Capital Management Ltd. | 0 | -100.00 | 0 | -100.00 | ||||
| 2026-01-27 | 13F | BankPlus Trust Department | 44,000 | 521 | ||||||
| 2026-02-17 | 13F | SageView Advisory Group, LLC | 725 | 9 | ||||||
| 2026-02-13 | 13F | Citigroup Inc | 1,738,958 | 80.30 | 20,607 | 68.76 | ||||
| 2026-02-13 | 13F | Citigroup Inc | Call | 977,800 | 14.31 | 11,587 | 6.99 | |||
| 2026-01-22 | 13F | Lesa Sroufe & Co | 288,600 | -8.09 | 3 | 0.00 | ||||
| 2026-02-13 | 13F | Citigroup Inc | Put | 2,435,000 | 14.32 | 28,855 | 7.01 | |||
| 2025-08-28 | NP | NDOW - Anydrus Advantage ETF | 5,086 | 18.44 | 64 | 3.28 | ||||
| 2025-08-28 | NP | Amplify ETF Trust - Amplify Natural Resources Dividend Income ETF | 49,067 | 5.79 | 614 | -7.82 | ||||
| 2026-01-30 | 13F | Sigma Planning Corp | 27,179 | -3.36 | 325 | -9.22 | ||||
| 2026-01-29 | 13F | Nbc Securities, Inc. | 1,063 | 1.14 | 13 | -14.29 | ||||
| 2026-01-30 | 13F | ARGA Investment Management, LP | 18,975,177 | 0.89 | 224,856 | -5.57 | ||||
| 2025-10-30 | 13F | Mizuho Securities Co. Ltd. | 0 | -100.00 | 0 | |||||
| 2026-02-12 | 13F | Provida Pension Fund Administrator | 0 | -100.00 | 0 | |||||
| 2026-02-12 | 13F | Groupe la Francaise | 0 | -100.00 | 0 | |||||
| 2026-02-17 | 13F | Signature Equity Partners, LLC | 227 | 3 | ||||||
| 2025-09-25 | NP | Thrivent Core Funds - Thrivent Core Emerging Markets Equity Fund | 104,169 | 90.97 | 1,327 | 115.77 | ||||
| 2025-08-28 | NP | RAPAX - Cohen & Steers Real Assets Fund, Inc. Class A | 81,891 | -1.29 | 1,024 | -13.88 | ||||
| 2026-01-20 | 13F | Stratos Wealth Advisors, LLC | 0 | -100.00 | 0 | |||||
| 2026-02-12 | 13F | Principal Securities, Inc. | 36,379 | 27.78 | 431 | 19.72 | ||||
| 2025-11-14 | 13F | Sofos Investments, Inc. | 0 | -100.00 | 0 | |||||
| 2026-02-06 | 13F | Profund Advisors Llc | 92,364 | 10.34 | 1,095 | 3.31 | ||||
| 2026-02-05 | 13F | Allworth Financial LP | 12,248 | 0.60 | 145 | -5.84 | ||||
| 2025-11-14 | 13F | Binnacle Investments Inc | 634 | -5.65 | 8 | 0.00 | ||||
| 2026-02-09 | 13F | Beck Bode, LLC | Call | 0 | -100.00 | 0 | -100.00 | |||
| 2025-09-26 | NP | PCEMX - PACE International Emerging Markets Equity Investments Class P | 364,545 | 0.51 | 4,644 | 13.43 | ||||
| 2026-01-15 | 13F | Lodestone Wealth Management LLC | 1 | 0 | ||||||
| 2026-02-11 | 13F | West Family Investments, Inc. | 21,406 | -22.13 | 254 | -27.30 | ||||
| 2026-02-13 | 13F | Verition Fund Management LLC | Put | 500,600 | 0.00 | 5,932 | -6.39 | |||
| 2026-02-12 | 13F | Renaissance Technologies Llc | 9,555,200 | -9.41 | 113,229 | -15.20 | ||||
| 2026-02-11 | 13F | Metis Global Partners, LLC | 111,668 | 1.76 | 1,323 | -4.75 | ||||
| 2026-02-17 | 13F | Old West Investment Management, LLC | 78,040 | 925 | ||||||
| 2025-09-25 | NP | EMGAX - Wells Fargo Emerging Markets Equity Fund Class A | 522,079 | 0.00 | 6,651 | 12.84 | ||||
| 2026-02-10 | 13F | Nomura Asset Management Co Ltd | 29,762 | -50.96 | 353 | -54.17 | ||||
| 2026-02-17 | 13F | Nomura Holdings Inc | 94,508 | 28.22 | 1,120 | 19.94 | ||||
| 2026-02-17 | 13F | Nomura Holdings Inc | Put | 95,000 | 0.00 | 1,126 | -6.41 | |||
| 2026-02-10 | 13F | Bank of New York Mellon Corp | 92,146 | 0.20 | 1,092 | -6.27 | ||||
| 2026-01-30 | 13F | Pekin Hardy Strauss, Inc. | 42,352 | 32.96 | 502 | 24.32 | ||||
| 2026-02-12 | 13F | Barings Llc | 73,545 | 0.00 | 872 | -6.44 | ||||
| 2026-02-17 | 13F | SummitTX Capital, L.P. | 64,220 | 340.38 | 761 | 313.59 | ||||
| 2026-01-29 | 13F | Obermeyer Wood Investment Counsel, Lllp | 18,423 | -58.74 | 218 | -61.42 | ||||
| 2025-08-28 | NP | GQGPX - GQG PARTNERS EMERGING MARKETS EQUITY FUND Investor Shares | 61,035,997 | 5.06 | 763,560 | -8.35 | ||||
| 2026-02-24 | 13F | DGS Capital Management, LLC | 24,067 | -47.83 | 285 | -51.20 | ||||
| 2026-02-02 | 13F | Oppenheimer & Co Inc | 0 | -100.00 | 0 | |||||
| 2026-02-13 | 13F | Umb Bank N A/mo | 0 | -100.00 | 0 | -100.00 | ||||
| 2026-02-11 | 13F | Empowered Funds, LLC | 17,079 | 39.53 | 202 | 31.17 | ||||
| 2026-02-13 | 13F/A | Virtus ETF Advisers LLC | 0 | -100.00 | 0 | |||||
| 2025-11-06 | 13F | Ameritas Advisory Services, LLC | 0 | -100.00 | 0 | -100.00 | ||||
| 2026-02-05 | 13F | Tucker Asset Management Llc | 50 | 1 | ||||||
| 2026-02-05 | 13F | Td Private Client Wealth Llc | 21,902 | -1.82 | 260 | -8.16 | ||||
| 2026-02-14 | 13F | Rockefeller Capital Management L.P. | 23,986 | 42.86 | 284 | 33.96 | ||||
| 2026-01-26 | 13F | SeaBridge Investment Advisors LLC | 0 | -100.00 | 0 | -100.00 | ||||
| 2025-08-28 | NP | SPEM - SPDR(R) Portfolio Emerging Markets ETF | 2,340,163 | 8.72 | 29,275 | -5.15 | ||||
| 2026-02-17 | 13F | Wiley Bros.-aintree Capital, Llc | 31,298 | 36.15 | 371 | 26.28 | ||||
| 2026-01-23 | 13F | Ritholtz Wealth Management | 183,891 | -6.95 | 2,179 | -12.87 | ||||
| 2026-01-27 | 13F | Regions Financial Corp | 53,799 | -2.01 | 638 | -8.35 | ||||
| 2026-02-17 | 13F | Warren Averett Asset Management, LLC | 14,735 | 25.00 | 175 | 16.78 | ||||
| 2026-02-09 | 13F | Fisher Asset Management, LLC | 13,982,981 | -2.18 | 165,698 | -8.44 | ||||
| 2026-02-17 | 13F | Ameriprise Financial Inc | 3,775,081 | 7.19 | 44,742 | 0.34 | ||||
| 2026-02-12 | 13F | Advisors Asset Management, Inc. | 179,867 | 13.45 | 2,131 | 6.18 | ||||
| 2026-01-28 | 13F | Cranbrook Wealth Management, LLC | 600 | 0.00 | 7 | 0.00 | ||||
| 2026-01-20 | 13F | Perpetual Ltd | 3,313,257 | 0.55 | 39,262 | -5.88 | ||||
| 2026-02-17 | 13F | Wellington Management Group Llp | 935,559 | 40.12 | 11,086 | 31.15 | ||||
| 2026-01-08 | 13F | Tuttle Tactical Management LLC | 23,055 | 273 | ||||||
| 2026-01-08 | 13F | Wealth Enhancement Advisory Services, Llc | 79,806 | -9.15 | 923 | -14.38 | ||||
| 2025-11-14 | 13F | Wetherby Asset Management Inc | 38,247 | -4.98 | 484 | -3.78 | ||||
| 2026-02-13 | 13F | Blueshift Asset Management, LLC | 0 | -100.00 | 0 | |||||
| 2026-02-20 | 13F | Sunbelt Securities, Inc. | 6 | 0.00 | 0 | |||||
| 2026-01-27 | 13F | Zurcher Kantonalbank (Zurich Cantonalbank) | 58,400 | 692 | ||||||
| 2026-02-13 | 13F | Aigen Investment Management, Lp | 0 | -100.00 | 0 | |||||
| 2025-11-14 | 13F | Mount Yale Investment Advisors, LLC | 0 | -100.00 | 0 | -100.00 | ||||
| 2025-10-22 | 13F | D.a. Davidson & Co. | 0 | -100.00 | 0 | -100.00 | ||||
| 2026-02-18 | 13F | GWM Advisors LLC | 12,668 | -5.09 | 150 | -10.71 | ||||
| 2026-02-17 | 13F | EFG International AG | 36,790 | 436 | ||||||
| 2026-01-22 | 13F | City Holding Co | 6,773 | 0.00 | 80 | -5.88 | ||||
| 2026-02-05 | 13F | Everstar Asset Management, LLC | 13,177 | 17.94 | 156 | 10.64 | ||||
| 2025-09-25 | NP | DEXC - Dimensional Emerging Markets ex China Core Equity ETF | 57,550 | 18.78 | 733 | 34.00 | ||||
| 2026-02-13 | 13F | Nfj Investment Group, Llc | 130 | 0.00 | 2 | 0.00 | ||||
| 2026-02-17 | 13F | Delaware Management Holdings, Inc. | 1,759,423 | 20,849 | ||||||
| 2025-11-14 | 13F | XTX Topco Ltd | 0 | -100.00 | 0 | -100.00 | ||||
| 2026-02-17 | 13F | Rwc Asset Advisors (us) Llc | 0 | -100.00 | 0 | |||||
| 2026-02-13 | 13F | Candriam Luxembourg S.C.A. | 25,741 | 0.00 | 305 | -6.15 | ||||
| 2026-02-03 | 13F | Lumbard & Kellner, LLC | 707,365 | 39.29 | 8,382 | 30.38 | ||||
| 2025-08-28 | NP | SPGM - SPDR(R) Portfolio MSCI Global Stock Market ETF | 21,645 | 2.95 | 271 | -10.30 | ||||
| 2025-10-30 | 13F | Migdal Insurance & Financial Holdings Ltd. | 0 | -100.00 | 0 | |||||
| 2025-09-25 | NP | VMMSX - Vanguard Emerging Markets Select Stock Fund Investor Shares | 474,901 | -13.32 | 6,050 | -2.18 | ||||
| 2026-01-28 | 13F | WPG Advisers, LLC | 144 | 0.00 | 2 | 0.00 | ||||
| 2025-11-14 | 13F | Vennlight Capital Management, LP | 0 | -100.00 | 0 | -100.00 | ||||
| 2026-02-11 | 13F | J.w. Cole Advisors, Inc. | 12,671 | -9.19 | 102 | -42.61 | ||||
| 2026-02-13 | 13F | Caitong International Asset Management Co., Ltd | 8,351 | 924.66 | 99 | 880.00 | ||||
| 2025-08-27 | NP | Jnl Series Trust - Jnl/lazard Emerging Markets Fund (a) | 824,875 | 11.90 | 10,319 | -2.38 | ||||
| 2026-02-13 | 13F | Itau Unibanco Holding S.A. | 19,828,159 | 146.57 | 234,171 | 130.02 | ||||
| 2026-01-29 | 13F | UBS Group AG | 4,673,458 | 20.75 | 55,380 | 13.03 | ||||
| 2026-02-03 | 13F | International Assets Investment Management, Llc | 21,749 | 88.56 | 258 | 77.24 | ||||
| 2026-02-09 | 13F | Fidelis Capital Partners, LLC | 0 | -100.00 | 0 | |||||
| 2026-02-10 | 13F | Eurizon Capital SGR S.p.A. | 83,759 | 992 | ||||||
| 2026-02-12 | 13F | New York State Common Retirement Fund | 2,579,822 | -4.54 | 30,571 | -10.65 | ||||
| 2026-01-27 | 13F | WealthCollab, LLC | 1,301 | -1.74 | 15 | -6.25 | ||||
| 2026-02-13 | 13F | NLB Skladi, upravljanje premozenja, d.o.o. | 312,384 | 3,702 | ||||||
| 2025-11-14 | 13F | Credit Agricole S A | 0 | -100.00 | 0 | |||||
| 2026-02-03 | 13F | NewEdge Wealth, LLC | 16,083 | -13.81 | 191 | -15.93 | ||||
| 2026-01-07 | 13F | Sagespring Wealth Partners, Llc | 10,241 | -5.86 | 121 | -11.68 | ||||
| 2025-10-17 | 13F | Matthews International Capital Management Llc | 0 | -100.00 | 0 | -100.00 | ||||
| 2026-01-29 | 13F | UBS Group AG | Put | 3,530,900 | -2.75 | 41,841 | -8.98 | |||
| 2026-01-29 | 13F | UBS Group AG | Call | 10,211,190 | 8.05 | 121,003 | 1.13 | |||
| 2026-02-17 | 13F | Lazard Asset Management Llc | 23,170,764 | 7.42 | 274,574 | 0.55 | ||||
| 2026-02-17 | 13F | Price T Rowe Associates Inc /md/ | 10,389,475 | 51.54 | 123 | 43.02 | ||||
| 2026-02-13 | 13F | JustInvest LLC | 13,470 | 10.23 | 160 | 3.25 | ||||
| 2026-02-12 | 13F | Advocate Investing Services LLC | 12,400 | 147 | ||||||
| 2026-02-17 | 13F | Snowden Capital Advisors LLC | 13,607 | 162 | ||||||
| 2026-02-13 | 13F | Hudson Portfolio Management LLC | 39,650 | 26.88 | 470 | 18.73 | ||||
| 2026-02-17 | 13F | Jones Financial Companies Lllp | 24,509 | 7.42 | 290 | -2.68 | ||||
| 2026-02-18 | 13F | Mackenzie Financial Corp | 381,560 | -65.19 | 4,516 | -67.45 | ||||
| 2025-09-18 | NP | ABLD - Donoghue Forlines Yield Enhanced Real Asset ETF | 98,465 | 0.98 | 1,254 | 14.00 | ||||
| 2025-11-07 | 13F | Sierra Ocean, Llc | 0 | -100.00 | 0 | -100.00 | ||||
| 2025-11-04 | 13F | High Note Wealth, LLC | 0 | -100.00 | 0 | |||||
| 2026-01-26 | 13F | United Advisor Group, LLC | 19,434 | 0.03 | 230 | -6.12 | ||||
| 2026-02-13 | 13F | Cullen Capital Management, LLC | 2,271,269 | 44.09 | 26,915 | 34.87 | ||||
| 2026-02-17 | 13F | Limestone Investment Advisors LP | 88,461 | 24.57 | 1,048 | 16.70 | ||||
| 2025-11-13 | 13F | Eisler Capital Management Ltd. | Put | 600,000 | 0.00 | 7,740 | 3.12 | |||
| 2025-11-13 | 13F | Eisler Capital Management Ltd. | Call | 300,000 | 0.00 | 3,870 | 3.12 | |||
| 2025-08-28 | NP | GNR - SPDR(R) S&P(R) Global Natural Resources ETF | 1,282,173 | 1.11 | 16,040 | -11.79 | ||||
| 2025-11-25 | 13F | Briaud Financial Planning, Inc | 0 | -100.00 | 0 | |||||
| 2026-02-17 | 13F | Parkwood LLC | 760,484 | 28.13 | 9 | 28.57 | ||||
| 2026-01-21 | 13F | Yousif Capital Management, Llc | 24,063 | 0.00 | 309 | 1.32 | ||||
| 2026-02-11 | 13F | Capital International Inc /ca/ | 1,942,862 | 100.73 | 23,023 | 87.89 | ||||
| 2026-02-17 | 13F | Kerrisdale Advisers, LLC | 111,126 | 0.00 | 1,317 | -6.40 | ||||
| 2026-02-18 | 13F | Caitlin John, LLC | 0 | -100.00 | 0 | |||||
| 2026-01-13 | 13F | CoreCap Advisors, LLC | 461 | -69.95 | 5 | -73.68 | ||||
| 2026-02-04 | 13F | Altman Advisors, Inc. | 122,811 | -6.46 | 1,455 | -12.45 | ||||
| 2026-02-11 | 13F | Franklin Resources Inc | 635,707 | -24.35 | 7,533 | -29.19 | ||||
| 2026-02-05 | 13F | Cambridge Investment Research Advisors, Inc. | 165,484 | -6.96 | 2 | -50.00 | ||||
| 2026-02-17 | 13F | PharVision Advisers, LLC | 38,680 | 93.81 | 458 | 94.89 | ||||
| 2026-02-17 | 13F | Millennium Management Llc | Call | 429,300 | 1.35 | 5,087 | -5.13 | |||
| 2026-02-17 | 13F | Millennium Management Llc | 204,714 | -46.03 | 2,426 | -49.50 | ||||
| 2026-02-11 | 13F | Fox Run Management, L.l.c. | 46,842 | -9.79 | 555 | -15.53 | ||||
| 2026-02-17 | 13F | Millennium Management Llc | Put | 25,200 | -74.85 | 299 | -76.50 | |||
| 2026-02-06 | 13F/A | Rathbone Brothers plc | 0 | -100.00 | 0 | |||||
| 2026-02-09 | 13F | Beck Bode, LLC | 1,232,786 | -0.59 | 14,609 | -6.96 | ||||
| 2026-02-23 | 13F | Virtu Financial LLC | 41,883 | 0 | ||||||
| 2025-11-05 | 13F | Wellington Shields & Co., LLC | 0 | -100.00 | 0 | |||||
| 2026-01-29 | 13F | Rakuten Securities, Inc. | 149,213 | 41.55 | 1,768 | 32.53 | ||||
| 2026-02-12 | 13F | JPL Wealth Management, LLC | 0 | -100.00 | 0 | |||||
| 2025-09-23 | NP | SLANX - DWS Latin America Equity Fund Class A | 407,672 | 41.50 | 5,194 | 59.69 | ||||
| 2025-09-26 | NP | UBPIX - Ultralatin America Profund Investor Class | 37,208 | 0.30 | 474 | 13.40 | ||||
| 2025-09-25 | NP | VT - Vanguard Total World Stock Index Fund ETF Shares | 179,623 | 0.00 | 2,288 | 12.88 | ||||
| 2026-02-17 | 13F | Clear Street Markets Llc | 10,900 | 0.93 | 129 | -5.15 | ||||
| 2025-09-26 | NP | FHKFX - Fidelity Series Emerging Markets Fund This fund is a listed as child fund of Fmr Llc and if that institution has disclosed ownership in this security, then these positions will not be double counted when calculating total shares and total value | 762,315 | -6.38 | 9,712 | 5.63 | ||||
| 2025-10-28 | 13F | MAS Advisors LLC | 34,542 | 19.01 | 437 | 20.39 | ||||
| 2026-02-04 | 13F | Oxbow Advisors, LLC | 418,136 | 4,955 | ||||||
| 2026-01-27 | 13F | Fundamenta Capital S.A. | 1,355,652 | 16,064 | ||||||
| 2026-02-13 | 13F | Banco Santander, S.A. | 434,136 | 196.57 | 5,145 | 177.60 | ||||
| 2026-01-23 | 13F | Robeco Institutional Asset Management B.V. | 6,013,197 | 3.26 | 71,256 | -3.35 | ||||
| 2025-10-09 | 13F | Bartlett & Co. Wealth Management Llc | 0 | -100.00 | 0 | |||||
| 2025-09-25 | NP | DFEM - Dimensional Emerging Markets Core Equity 2 ETF | 59,036 | -24.19 | 752 | -14.45 | ||||
| 2026-01-05 | 13F | GAMMA Investing LLC | 946 | -37.31 | 11 | -42.11 | ||||
| 2025-11-04 | 13F | Centric Wealth Management | 0 | -100.00 | 0 | |||||
| 2026-01-14 | 13F | ORG Partners LLC | 52,283 | 2,273.26 | 619 | 2,192.59 | ||||
| 2026-01-26 | 13F | Abbington Investment Group | 309,572 | 8.06 | 3,668 | 1.16 | ||||
| 2026-02-05 | 13F | Thrivent Financial For Lutherans | 170,304 | 9.44 | 2 | 100.00 | ||||
| 2025-08-28 | NP | GQRRX - GQG PARTNERS GLOBAL QUALITY EQUITY FUND R6 Shares | 1,442,684 | -43.26 | 18,048 | -50.50 | ||||
| 2026-01-29 | 13F | DecisionPoint Financial, LLC | 0 | -100.00 | 0 | |||||
| 2026-01-28 | 13F | Old National Bancorp /in/ | 0 | -100.00 | 0 | |||||
| 2026-02-05 | 13F | Sapient Capital Llc | 0 | -100.00 | 0 | |||||
| 2025-08-28 | NP | QEMM - SPDR MSCI Emerging Markets StrategicFactors ETF | 4,423 | -3.95 | 55 | -16.67 | ||||
| 2026-01-21 | 13F | Baker Ellis Asset Management LLC | 18,000 | 93.55 | 213 | 74.59 | ||||
| 2026-02-03 | 13F | Sequoia Financial Advisors, LLC | 22,507 | 15.49 | 267 | 8.13 | ||||
| 2026-02-06 | 13F | Leonteq Securities AG | Put | 600,000 | 200.00 | 7,110 | 180.81 | |||
| 2026-02-06 | 13F | Leonteq Securities AG | 215,413 | -63.77 | 2,553 | -66.10 | ||||
| 2026-02-03 | 13F | Crossmark Global Holdings, Inc. | 66,312 | -21.21 | 786 | -26.29 | ||||
| 2026-02-10 | 13F | Ted Buchan & Co | 191,403 | -25.04 | 2,268 | -29.83 | ||||
| 2025-11-10 | 13F | Kovitz Investment Group Partners, LLC | 0 | -100.00 | 0 | |||||
| 2026-02-17 | 13F | Point72 Asset Management, L.P. | 4,895,056 | 9.02 | 58,006 | 2.05 | ||||
| 2026-02-05 | 13F | Intrua Financial, LLC | 28,785 | 3.75 | 341 | -2.85 | ||||
| 2026-02-17 | 13F | Point72 Asset Management, L.P. | Put | 372,100 | 135.36 | 4,409 | 120.34 | |||
| 2025-09-22 | NP | GSIHX - Goldman Sachs GQG Partners International Opportunities Fund Class A Shares | 71,574,470 | -0.28 | 911,859 | 12.53 | ||||
| 2026-02-17 | 13F | Point72 Asset Management, L.P. | Call | 939,500 | 268.58 | 11,133 | 245.00 | |||
| 2026-02-06 | 13F | Larson Financial Group LLC | 3,487 | -12.82 | 41 | -18.00 | ||||
| 2025-10-07 | 13F | Sonora Investment Management Group, LLC | 17,065 | -0.03 | 216 | 1.41 | ||||
| 2026-02-13 | 13F | Thornburg Investment Management Inc | 344,876 | -0.42 | 4,087 | -6.80 | ||||
| 2026-02-02 | 13F | Artemis Investment Management LLP | 2,009,324 | -25.00 | 23,810 | -29.80 | ||||
| 2026-01-27 | 13F | Bayforest Capital Ltd | 3,259 | 39 | ||||||
| 2026-02-13 | 13F | Morgan Stanley | 12,087,833 | 23.65 | 143,241 | 15.74 | ||||
| 2025-09-25 | NP | HFCVX - Hennessy Cornerstone Value Fund Investor Class | 398,900 | 0.00 | 5,082 | 12.84 | ||||
| 2026-02-13 | 13F | Level Four Advisory Services, Llc | 27,255 | -34.12 | 323 | -38.43 | ||||
| 2026-01-27 | 13F | TD Waterhouse Canada Inc. | 849 | 30.82 | 10 | 25.00 | ||||
| 2025-11-14 | 13F | Peak6 Llc | Call | 0 | -100.00 | 0 | ||||
| 2025-08-27 | NP | RYDEX VARIABLE TRUST - Energy Fund Variable Annuity | 10,167 | -7.97 | 127 | -19.62 | ||||
| 2026-02-06 | 13F | Ignite Planners, LLC | 0 | -100.00 | 0 | |||||
| 2026-01-06 | 13F | Nelson, Van Denburg & Campbell Wealth Management Group, LLC | 15,638 | -13.19 | 185 | -18.86 | ||||
| 2025-09-25 | NP | NEWFX - NEW WORLD FUND INC Class A | 6,518,409 | 12.40 | 83,045 | 26.83 | ||||
| 2026-01-30 | 13F | State of New Jersey Common Pension Fund D | 706,825 | -8.73 | 8,376 | -14.57 | ||||
| 2026-01-08 | 13F | Traveka Wealth, LLC | 0 | -100.00 | 0 | |||||
| 2026-02-17 | 13F | Man Group plc | 598,768 | 344.18 | 7,095 | 315.89 | ||||
| 2026-02-02 | 13F | Strs Ohio | 31,899 | -14.86 | 378 | -20.25 | ||||
| 2026-01-12 | 13F | Legacy Wealth Asset Management, LLC | 40,534 | 1.14 | 480 | -5.33 | ||||
| 2026-02-13 | 13F | Neuberger Berman Group LLC | 103,826 | -19.03 | 1,230 | -24.21 | ||||
| 2026-02-17 | 13F | Russell Investments Group, Ltd. | 613,801 | -50.31 | 7,274 | -53.49 | ||||
| 2025-10-10 | 13F | Viking Fund Management Llc | 0 | -100.00 | 0 | |||||
| 2026-02-04 | 13F | Fourth Dimension Wealth, LLC | 600 | 0.00 | 7 | 0.00 | ||||
| 2026-02-17 | 13F | Creative Planning | 185,973 | 32.84 | 2,204 | 24.32 | ||||
| 2026-01-22 | 13F | Comprehensive Money Management Services LLC | 20,725 | 1.32 | 246 | -5.04 | ||||
| 2026-02-13 | 13F | Toroso Investments, LLC | 135,675 | 42.66 | 1,608 | 33.47 | ||||
| 2026-02-17 | 13F | Quadrature Capital Ltd | 372,338 | 59.87 | 4,412 | 49.71 | ||||
| 2026-01-26 | 13F | Mirae Asset Global Investments Co., Ltd. | 105,031 | 3.04 | 1,245 | -3.57 | ||||
| 2025-11-21 | 13F | Bell Investment Advisors, Inc | 0 | -100.00 | 0 | -100.00 | ||||
| 2026-02-05 | 13F | Baader Bank INC | 0 | -100.00 | 0 | |||||
| 2025-10-31 | 13F | Whittier Trust Co Of Nevada Inc | 0 | -100.00 | 0 | |||||
| 2026-02-11 | 13F | Deutsche Bank Ag\ | 6,661 | 9.52 | 79 | 2.63 | ||||
| 2026-02-17 | 13F | Breakout Capital Partners, LP | 1,182,589 | 14,014 | ||||||
| 2026-02-13 | 13F | GQG Partners LLC | 136,003,212 | -35.83 | 1,611,638 | -39.94 | ||||
| 2026-02-13 | 13F | Parkside Financial Bank & Trust | 4,544 | 264.10 | 54 | 253.33 | ||||
| 2026-02-13 | 13F | PCM Encore, LLC | 20,028 | 237 | ||||||
| 2026-02-17 | 13F | Limestone Investment Advisors LP | Call | 0 | -100.00 | 0 | ||||
| 2026-02-09 | 13F | Key FInancial Inc | 453 | 5 | ||||||
| 2025-09-25 | NP | TIER - T. Rowe Price International Equity Research ETF | 2,058 | 26 | ||||||
| 2026-02-13 | 13F | Smartleaf Asset Management LLC | 712 | 0.00 | 8 | -11.11 | ||||
| 2026-02-10 | 13F | Envestnet Asset Management Inc | 1,004,074 | -7.63 | 11,898 | -13.54 | ||||
| 2026-02-10 | 13F | Bnp Paribas | 4,240 | 0.00 | 50 | -5.66 | ||||
| 2025-11-14 | 13F | Wolverine Trading, Llc | Put | 396,600 | 366.59 | 5,096 | 384.41 | |||
| 2026-01-15 | 13F | Archford Capital Strategies, LLC | 88,934 | -18.16 | 1,054 | -23.42 | ||||
| 2025-09-25 | NP | JEMA - JPMorgan Emerging Markets Equity Core ETF | 665,768 | -3.20 | 8,482 | 9.22 | ||||
| 2026-02-12 | 13F/A | Pinebridge Investments Llc | 161,949 | 1,919 | ||||||
| 2026-02-14 | 13F | Whipplewood Advisors, LLC | 177 | 2 | ||||||
| 2025-11-14 | 13F | Wolverine Trading, Llc | 106,785 | 53.29 | 1,372 | 59.16 | ||||
| 2025-11-14 | 13F | Wolverine Trading, Llc | Call | 195,700 | -28.45 | 2,515 | -25.73 | |||
| 2026-02-03 | 13F | McIlrath & Eck, LLC | 11,287 | 134 | ||||||
| 2026-02-11 | 13F | First Command Advisory Services, Inc. | 134 | 2 | ||||||
| 2026-02-12 | 13F | Resurgent Financial Advisors LLC | 15,526 | -0.60 | 184 | -7.11 | ||||
| 2026-02-09 | 13F | Morningstar Investment Management LLC | 214,987 | -30.04 | 3 | -33.33 | ||||
| 2026-02-17 | 13F | Two Sigma Securities, Llc | 20,194 | -47.36 | 239 | -50.72 | ||||
| 2025-11-06 | 13F | Midwest Trust Co | 0 | -100.00 | 0 | |||||
| 2026-02-10 | 13F | Savant Capital, LLC | 15,699 | -8.41 | 186 | -14.29 | ||||
| 2026-01-28 | 13F | Eagle Global Advisors Llc | 0 | -100.00 | 0 | |||||
| 2026-02-13 | 13F | Schroder Investment Management Group | 23,380,819 | -17.03 | 277,063 | -22.34 | ||||
| 2026-02-12 | 13F | Qtron Investments LLC | 0 | -100.00 | 0 | |||||
| 2026-02-17 | 13F | Trexquant Investment LP | 656,749 | -34.65 | 7,782 | -38.84 | ||||
| 2025-11-14 | 13F | PineBridge Investments, L.P. | 202,110 | 0.00 | 2,559 | 1.19 | ||||
| 2026-02-04 | 13F | LRI Investments, LLC | 1,000 | 0.00 | 12 | -8.33 | ||||
| 2025-10-27 | 13F | Kiker Wealth Management, LLC | 0 | -100.00 | 0 | -100.00 | ||||
| 2025-09-24 | NP | EQNAX - MFS Equity Income Fund A | 165,730 | 0.00 | 2,111 | 12.83 | ||||
| 2026-01-23 | 13F | Farther Finance Advisors, LLC | 34,460 | 25.44 | 408 | 17.58 | ||||
| 2026-01-27 | 13F | Krilogy Financial LLC | 0 | -100.00 | 0 | |||||
| 2026-02-11 | 13F | RWC Asset Management LLP | 494,705 | -46.48 | 5,862 | -49.90 | ||||
| 2026-01-30 | 13F | Samalin Investment Counsel, LLC | 16,256 | 17.28 | 193 | 9.71 | ||||
| 2025-10-10 | 13F | Sound Income Strategies, LLC | 0 | -100.00 | 0 | |||||
| 2026-02-13 | 13F | SPX Equities Gestao de Recursos Ltda | 4,887,558 | -38.26 | 57,918 | -42.21 | ||||
| 2026-02-12 | 13F | BRYN MAWR TRUST Co | 0 | -100.00 | 0 | -100.00 | ||||
| 2026-02-12 | 13F | Wealthspire Advisors, LLC | 0 | -100.00 | 0 | |||||
| 2026-02-06 | 13F | Kingdom Financial Group LLC. | 0 | 0 | ||||||
| 2026-02-17 | 13F | Guggenheim Capital Llc | 148,453 | 7.88 | 1,759 | 0.98 | ||||
| 2026-02-09 | 13F | Prospera Financial Services Inc | 24,235 | -20.28 | 287 | -25.26 | ||||
| 2026-02-11 | 13F | O'shaughnessy Asset Management, Llc | 936,025 | -6.75 | 11,092 | -12.72 | ||||
| 2026-02-13 | 13F | Ubs Asset Management Americas Inc | 995 | 12 | ||||||
| 2026-01-21 | 13F | Naviter Wealth, LLC | 24,224 | -5.73 | 296 | -10.88 | ||||
| 2026-02-11 | 13F | Jpmorgan Chase & Co | 12,624,850 | 41.02 | 149,604 | 32.00 | ||||
| 2026-02-11 | 13F | Jpmorgan Chase & Co | Call | 3,050,000 | 154.17 | 36,142 | 137.90 | |||
| 2026-02-09 | 13F | Arista Wealth Management, LLC | 0 | -100.00 | 0 | |||||
| 2026-02-11 | 13F | Jpmorgan Chase & Co | Put | 4,766,800 | 128.35 | 56,487 | 113.74 | |||
| 2026-01-29 | 13F | IMC-Chicago, LLC | 81,351 | -47.91 | 964 | -51.24 | ||||
| 2026-01-29 | 13F | IMC-Chicago, LLC | Put | 283,300 | -24.35 | 3,357 | -29.19 | |||
| 2026-01-29 | 13F | IMC-Chicago, LLC | Call | 253,700 | 508.39 | 3,006 | 470.40 | |||
| 2026-02-13 | 13F | Barclays Plc | 1,326,699 | 114.83 | 15,721 | 101.09 | ||||
| 2025-09-25 | NP | DFAE - Dimensional Emerging Core Equity Market ETF | 103,050 | 0.00 | 1,313 | 12.81 | ||||
| 2026-01-26 | 13F | Cwm, Llc | 9,212 | -17.77 | 0 | |||||
| 2025-10-08 | 13F | Patriot Financial Group Insurance Agency, LLC | 0 | -100.00 | 0 | -100.00 | ||||
| 2026-01-30 | 13F | Archer Investment Corp | 0 | -100.00 | 0 | |||||
| 2025-09-24 | NP | SNTKX - Steward International Enhanced Index Fund Class A | 25,860 | 0.00 | 329 | 13.06 | ||||
| 2025-09-25 | NP | HRLIX - The Hartford Global Real Asset Fund Class I | 20,829 | -41.67 | 265 | -34.24 | ||||
| 2026-02-02 | 13F | Robertson Stephens Wealth Management, LLC | 36,506 | 143.28 | 444 | 133.16 | ||||
| 2026-01-29 | 13F | Nbc Securities, Inc. | Call | 0 | -100.00 | 0 | ||||
| 2025-08-29 | NP | JAVAX - James Aggressive Allocation Fund | 20,000 | 0.00 | 250 | -12.59 | ||||
| 2026-02-13 | 13F | Walleye Trading LLC | 0 | -100.00 | 0 | -100.00 | ||||
| 2026-02-17 | 13F | Aquatic Capital Management LLC | 0 | -100.00 | 0 | |||||
| 2026-02-12 | 13F | Insigneo Advisory Services, Llc | 157,519 | -25.34 | 1,867 | -30.11 | ||||
| 2026-02-17 | 13F | Citadel Advisors Llc | Put | 1,703,300 | 22.67 | 20,184 | 14.83 | |||
| 2026-01-14 | 13F | Jfs Wealth Advisors, Llc | 508 | 9.01 | 6 | 20.00 | ||||
| 2026-02-17 | 13F | Hilltop Holdings Inc. | 12,146 | -4.29 | 144 | -10.62 | ||||
| 2025-08-27 | NP | JNL SERIES TRUST - JNL/GQG Emerging Markets Equity Fund (A) | 2,105,491 | -2.22 | 26,340 | -14.70 | ||||
| 2026-02-17 | 13F | First Manhattan Co | 0 | -100.00 | 0 | |||||
| 2026-02-11 | 13F | X-Square Capital, LLC | 11,463 | -46.59 | 0 | |||||
| 2026-02-10 | 13F/A | Northwestern Mutual Wealth Management Co | 79,081 | -28.17 | 937 | -32.74 | ||||
| 2026-02-10 | 13F | KERR FINANCIAL PLANNING Corp | 14 | 0 | ||||||
| 2026-02-17 | 13F | Citadel Advisors Llc | 70,241 | 80.18 | 832 | 68.76 | ||||
| 2026-02-13 | 13F | Venture Visionary Partners LLC | 264,118 | 6.93 | 3,130 | 0.06 | ||||
| 2025-09-25 | NP | Dfa Investment Trust Co - The Emerging Markets Series This fund is a listed as child fund of Dimensional Fund Advisors Lp and if that institution has disclosed ownership in this security, then these positions will not be double counted when calculating total shares and total value | 142,561 | 0.00 | 1,816 | 12.87 | ||||
| 2026-01-21 | 13F | Newbridge Financial Services Group, Inc. | 1,725 | 6.15 | 20 | 0.00 | ||||
| 2026-02-13 | 13F | Journey Strategic Wealth Llc | 86,262 | -2.02 | 1,022 | -8.26 | ||||
| 2026-02-17 | 13F | Citadel Advisors Llc | Call | 1,312,600 | -32.80 | 15,554 | -37.10 | |||
| 2026-01-12 | 13F | Abound Wealth Management | 24 | 0.00 | 0 | |||||
| 2026-02-06 | 13F | Gsa Capital Partners Llp | 0 | -100.00 | 0 | |||||
| 2026-02-13 | 13F | Walleye Trading LLC | Call | 369,200 | 341.10 | 4,375 | 313.13 | |||
| 2026-01-15 | 13F | Allspring Global Investments Holdings, LLC | 1,395,841 | 5.63 | 16,638 | -0.23 | ||||
| 2026-01-28 | 13F | DekaBank Deutsche Girozentrale | 30,000 | 0.00 | 1 | |||||
| 2026-02-13 | 13F | Walleye Trading LLC | Put | 197,900 | 380.34 | 2,345 | 350.10 | |||
| 2025-10-30 | 13F | Simplicity Wealth,LLC | 0 | -100.00 | 0 | -100.00 | ||||
| 2025-11-13 | 13F | Riggs Asset Managment Co. Inc. | 0 | -100.00 | 0 | |||||
| 2026-02-13 | 13F | USS Investment Management Ltd | 894,094 | 0.00 | 10,591 | -6.40 | ||||
| 2026-02-12 | 13F | Marex Group plc | 122,937 | 198.22 | 1,457 | 288.27 | ||||
| 2026-02-13 | 13F | Flow Traders U.s. Llc | 22,715 | 87.60 | 0 | |||||
| 2025-10-31 | 13F | Whittier Trust Co | 0 | -100.00 | 0 | -100.00 | ||||
| 2026-01-23 | 13F | Westside Investment Management, Inc. | 745 | 5.67 | 9 | 0.00 | ||||
| 2025-09-25 | NP | VEU - Vanguard FTSE All-World ex-US Index Fund ETF Shares | 995,895 | 0.00 | 12,688 | 12.84 | ||||
| 2026-02-09 | 13F | Mondrian Investment Partners LTD | 12,655,094 | 14.09 | 149,963 | 6.79 | ||||
| 2025-11-14 | 13F | Consultiva Wealth Management, Corp. | 0 | -100.00 | 0 | |||||
| 2026-02-17 | 13F | Masters Capital Management Llc | 0 | -100.00 | 0 | |||||
| 2026-02-13 | 13F | First National Bank Of Omaha | 347,795 | 4,125 | ||||||
| 2026-02-20 | 13F | Larch Capital Partners Llc | 632,032 | 7,714 | ||||||
| 2026-02-13 | 13F | Clear Street Group Inc. | 41,348 | 490 | ||||||
| 2025-09-24 | NP | IMRFX - Columbia Global Opportunities Fund Class A | 35,368 | 44.86 | 451 | 63.64 | ||||
| 2026-02-04 | 13F | Pensionmark Financial Group, Llc | 19,365 | 26.39 | 186 | -4.15 | ||||
| 2026-02-13 | 13F | Wealth Alliance | 48,125 | -6.43 | 570 | -12.44 | ||||
| 2026-02-17 | 13F | Public Employees Retirement System Of Ohio | 1,645,932 | 1.62 | 19,504 | -4.88 | ||||
| 2026-02-17 | 13F | Banco Bilbao Vizcaya Argentaria, S.a. | 0 | -100.00 | 0 | |||||
| 2026-01-21 | 13F | SJS Investment Consulting Inc. | 659 | 0.92 | 8 | -12.50 | ||||
| 2026-02-11 | 13F | Comprehensive Financial Planning, Inc./PA | 100 | 1 | ||||||
| 2026-02-13 | 13F | Sei Investments Co | 3,172,343 | 8.12 | 37,592 | 1.21 | ||||
| 2025-11-05 | 13F | Fullcircle Wealth Llc | 0 | -100.00 | 0 | |||||
| 2026-02-11 | 13F | Ameraudi Asset Management, Inc. | 13,850 | 0.00 | 164 | -6.29 | ||||
| 2025-08-28 | NP | IDVO - Amplify International Enhanced Dividend Income ETF | 254,540 | -17.92 | 3,184 | -28.40 | ||||
| 2026-02-13 | 13F | Dodge & Cox | 31,200 | -4.59 | 370 | -10.65 | ||||
| 2026-02-09 | 13F | Huntington National Bank | 5,695 | -2.50 | 67 | -8.22 | ||||
| 2026-01-22 | 13F | Massachusetts Financial Services Co /ma/ | 9,664,426 | -11.90 | 114,523 | -17.54 | ||||
| 2025-09-25 | NP | TWAAX - Thrivent International Allocation Fund Class A | 14,110 | 90.16 | 180 | 115.66 | ||||
| 2026-01-27 | 13F | GHP Investment Advisors, Inc. | 2,164 | 26 | ||||||
| 2026-02-12 | 13F | Hollencrest Capital Management | 28 | 0.00 | 0 | |||||
| 2026-02-17 | 13F | Brevan Howard Capital Management LP | 0 | -100.00 | 0 | |||||
| 2026-02-13 | 13F | Rhumbline Advisers | 99,156 | -8.08 | 1,175 | -13.99 | ||||
| 2026-02-04 | 13F | Summit Wealth Group Llc / Co | 0 | -100.00 | 0 | |||||
| 2025-09-25 | NP | Elevation Series Trust - The Opal International Dividend Income ETF | 231,416 | 16.91 | 2,948 | 31.96 | ||||
| 2026-02-13 | 13F | Transamerica Financial Advisors, Inc. | 1,797 | 21 | ||||||
| 2025-09-26 | NP | FTCEX - Fidelity Total International Equity Fund Fidelity Advisor Total International Equity Fund: Class C This fund is a listed as child fund of Fmr Llc and if that institution has disclosed ownership in this security, then these positions will not be double counted when calculating total shares and total value | 199,183 | 4.68 | 2,538 | 18.11 | ||||
| 2026-02-12 | 13F | CoreCommodity Management, LLC | 12,064 | 0.00 | 143 | -6.58 | ||||
| 2026-02-13 | 13F | Y-Intercept (Hong Kong) Ltd | 1,654,678 | 7.28 | 19,608 | 0.41 | ||||
| 2026-02-11 | 13F | Janney Montgomery Scott LLC | 32,965 | 4.77 | 0 | |||||
| 2025-11-14 | 13F | AXA Investment Managers S.A. | 144,159 | 1,825 | ||||||
| 2026-01-06 | 13F | Investors Research Corp | 1,034 | -6.76 | 12 | -14.29 | ||||
| 2026-01-14 | 13F | Wolff Wiese Magana Llc | 5,000 | 0.00 | 59 | -6.35 | ||||
| 2025-09-25 | NP | DEHP - Dimensional Emerging Markets High Profitability ETF | 15,308 | 89.93 | 195 | 116.67 | ||||
| 2026-02-04 | 13F | Legacy Financial Advisors, Inc. | 0 | -100.00 | 0 | |||||
| 2026-02-13 | 13F | Cohen & Steers, Inc. | 289,410 | 51.97 | 3 | 50.00 | ||||
| 2025-09-26 | NP | UUPIX - Ultraemerging Markets Profund Investor Class | 9,082 | 18.49 | 116 | 33.72 | ||||
| 2025-08-27 | NP | VHGEX - Vanguard Global Equity Fund Investor Shares | 1,777,083 | 0.00 | 22,231 | -12.76 | ||||
| 2026-02-13 | 13F | Capula Management Ltd | 164,470 | 1,949 | ||||||
| 2026-02-13 | 13F | Walleye Capital LLC | Call | 93,500 | 734.82 | 1,108 | 685.11 | |||
| 2026-02-13 | 13F | Walleye Capital LLC | Put | 99,300 | 204.60 | 1,177 | 185.44 | |||
| 2026-02-13 | 13F | Walleye Capital LLC | 154,783 | 19.77 | 1,834 | 12.10 | ||||
| 2026-01-28 | 13F | Atwood & Palmer Inc | 327 | 0.00 | 4 | -25.00 | ||||
| 2025-11-14 | 13F | Point72 Europe (London) LLP | 945,166 | -26.23 | 11,966 | -25.34 | ||||
| 2026-02-13 | 13F | Integrated Wealth Concepts LLC | 57,199 | -7.31 | 678 | -13.32 | ||||
| 2025-08-28 | NP | ARMIX - ARGA EMERGING MARKETS VALUE FUND Institutional Shares | 1,267,747 | 0.00 | 15,860 | -12.76 | ||||
| 2026-01-14 | 13F | TrueMark Investments, LLC | 291,680 | 14.95 | 3,456 | 7.60 | ||||
| 2026-02-17 | 13F | Cape Investment Advisory, Inc. | 229 | 3 | ||||||
| 2026-02-04 | 13F | Nwam Llc | 25,811 | -4.82 | 370 | 16.72 | ||||
| 2026-02-05 | 13F | Elyxium Wealth, LLC | 1,525 | 18 | ||||||
| 2026-02-12 | 13F | North of South Capital LLP | 265,853 | -6.84 | 3,150 | -12.79 | ||||
| 2026-01-05 | 13F | Rosenberg Matthew Hamilton | 1,447 | 0.00 | 17 | -5.56 | ||||
| 2026-02-11 | 13F | Erste Asset Management GmbH | 0 | 0 | ||||||
| 2025-09-25 | NP | EEMGX - MFS Emerging Markets Equity Research Fund R4 | 1,412 | 80.10 | 18 | 112.50 | ||||
| 2025-10-30 | 13F | Ridgewood Investments LLC | 74,910 | 59.09 | 656 | 11.21 | ||||
| 2026-02-10 | 13F | Goldman Sachs Group Inc | Put | 2,295,000 | 70.63 | 27,196 | 59.72 | |||
| 2026-02-13 | 13F | Colony Group, LLC | 43,544 | 30.83 | 519 | 23.28 | ||||
| 2026-02-10 | 13F | Goldman Sachs Group Inc | Call | 2,070,000 | 0.00 | 24,530 | -6.40 | |||
| 2026-02-17 | 13F | Laird Norton Trust Company, Llc | 52,156 | 637 | ||||||
| 2026-02-10 | 13F | Goldman Sachs Group Inc | 13,016,686 | 93.94 | 154,248 | 81.54 | ||||
| 2026-01-09 | 13F | Park Place Capital Corp | 884 | 0.00 | 10 | -9.09 | ||||
| 2026-01-13 | 13F | Kathmere Capital Management, LLC | 35,496 | -11.13 | 421 | -16.83 | ||||
| 2026-01-29 | 13F | UMA Financial Services, Inc. | 65 | 1 | ||||||
| 2026-02-17 | 13F | Capital Fund Management S.a. | Call | 345,100 | -0.35 | 4,089 | -6.73 | |||
| 2026-02-06 | 13F | Radnor Capital Management, LLC | 16,300 | -58.52 | 193 | -61.17 | ||||
| 2026-02-13 | 13F | Evelyn Partners Investment Management LLP | 650 | 0.00 | 8 | -12.50 | ||||
| 2026-02-06 | 13F | Pnc Financial Services Group, Inc. | 56,034 | 35.66 | 664 | 27.20 | ||||
| 2026-02-11 | 13F | Cerity Partners LLC | 67,744 | 67.43 | 803 | 56.64 | ||||
| 2026-02-17 | 13F | Capital Fund Management S.a. | Put | 200,300 | 9.16 | 2,374 | 2.15 | |||
| 2026-02-09 | 13F | Harbour Investments, Inc. | 1,256 | 0.00 | 15 | -6.67 | ||||
| 2025-09-23 | NP | VVIFX - Voya VACS Series EME Fund | 130,950 | -23.93 | 1,668 | -14.15 | ||||
| 2026-02-17 | 13F | Jump Financial, LLC | 774,182 | 389.99 | 9,174 | 358.70 | ||||
| 2025-08-27 | NP | THRIVENT SERIES FUND INC - Thrivent Partner Emerging Markets Equity Portfolio Class A | 11,186 | 74.64 | 140 | 52.75 | ||||
| 2025-10-30 | 13F | Twin Peaks Wealth Advisors, LLC | 0 | -100.00 | 0 | |||||
| 2025-08-27 | NP | RYEIX - Energy Fund Investor Class | 16,309 | 1.35 | 204 | -11.30 | ||||
| 2026-01-16 | 13F | Standard Life Aberdeen plc | 608,893 | 112.85 | 7,215 | 96.27 | ||||
| 2026-02-13 | 13F | Inspire Advisors, LLC | 11,502 | 0.75 | 136 | -5.56 | ||||
| 2025-11-13 | 13F | Total Investment Management Inc | 0 | -100.00 | 0 | |||||
| 2025-09-25 | NP | IPAYX - Integrity Dividend Summit Fund Class I | 23,000 | 0.00 | 293 | 13.13 | ||||
| 2026-02-17 | 13F | Quantitative Investment Management, LLC | 0 | -100.00 | 0 | |||||
| 2026-01-12 | 13F | Seacrest Wealth Management, Llc | 66,311 | 21.77 | 765 | 15.21 | ||||
| 2025-08-27 | NP | TPIAX - Timothy Plan International Fund Class A | 81,500 | 0.00 | 1,020 | -12.76 | ||||
| 2026-02-17 | 13F | CWM Advisors, LLC | 6,488 | 77 | ||||||
| 2026-01-23 | 13F | Nbt Bank N A /ny | 2,000 | 0.00 | 24 | -8.00 | ||||
| 2025-09-25 | NP | DAADX - Emerging Markets ex China Core Equity Portfolio Institutional Class | 0 | -100.00 | 0 | -100.00 | ||||
| 2026-01-07 | 13F | St. Louis Financial Planners Asset Management, LLC | 0 | -100.00 | 0 | |||||
| 2026-02-10 | 13F | State of Wyoming | 59,672 | 1.93 | 707 | -4.59 | ||||
| 2026-02-11 | 13F | Winton Capital Group Ltd | 86,000 | 1,019 | ||||||
| 2026-02-11 | 13F | Longfellow Investment Management Co Llc | 182,307 | -13.28 | 2,160 | -18.83 | ||||
| 2026-02-13 | 13F | Verition Fund Management LLC | 0 | -100.00 | 0 | -100.00 | ||||
| 2025-08-27 | NP | Brighthouse Funds Trust I - SSGA Emerging Markets Enhanced Index Portfolio Class B | 55,000 | 198.91 | 688 | 161.60 | ||||
| 2026-02-09 | 13F/A | Fideuram - Intesa Sanpaolo Private Banking S.p.a. | 282,562 | 3,348 | ||||||
| 2026-02-13 | 13F | Stifel Financial Corp | 248,079 | 32.71 | 2,940 | 24.22 | ||||
| 2026-02-18 | 13F | EP Wealth Advisors, Inc. | 0 | -100.00 | 0 | |||||
| 2026-01-15 | 13F | Shrier Wealth Management, Llc | 48,104 | 570 | ||||||
| 2025-10-22 | 13F | Hennion & Walsh Asset Management, Inc. | 0 | -100.00 | 0 | -100.00 | ||||
| 2025-09-29 | NP | TIIV - AAM Todd International Intrinsic Value ETF | 23,169 | 295 | ||||||
| 2026-01-26 | 13F | Annex Advisory Services, LLC | 2,108,579 | 5.73 | 24,987 | -1.03 | ||||
| 2026-01-20 | 13F | Signaturefd, Llc | 31,038 | 6.58 | 368 | -0.27 | ||||
| 2026-02-05 | 13F | Bessemer Group Inc | 13,746 | -1.11 | 0 | |||||
| 2026-02-17 | 13F | Tudor Investment Corp Et Al | Put | 22,500 | -34.21 | 267 | -38.43 | |||
| 2026-02-17 | 13F | Tudor Investment Corp Et Al | Call | 35,500 | 85.86 | 421 | 74.27 | |||
| 2025-09-25 | NP | SEMVX - Hartford Schroders Emerging Markets Equity Fund Class A | 4,629,234 | 6.59 | 58,976 | 20.28 | ||||
| 2025-09-26 | NP | MSTSX - Morningstar Unconstrained Allocation Fund | 69,278 | 15.22 | 883 | 30.09 | ||||
| 2026-01-30 | 13F | Cullinan Associates Inc | 33,200 | 0.00 | 393 | -6.43 | ||||
| 2026-02-13 | 13F | Cloverfields Capital Group, Lp | 226,694 | 1.53 | 2,686 | -4.95 | ||||
| 2026-02-09 | 13F | Todd Asset Management Llc | 3,059,639 | -2.47 | 36,257 | -8.71 | ||||
| 2025-09-25 | NP | PRIJX - T. Rowe Price Emerging Markets Discovery Stock Fund This fund is a listed as child fund of Price T Rowe Associates Inc /md/ and if that institution has disclosed ownership in this security, then these positions will not be double counted when calculating total shares and total value | 2,240,600 | 28,545 | ||||||
| 2026-01-16 | 13F | Ronald Blue Trust, Inc. | 27,048 | -18.21 | 321 | -23.44 | ||||
| 2026-02-12 | 13F | Federation des caisses Desjardins du Quebec | 23,150 | -79.13 | 274 | -80.48 | ||||
| 2026-02-06 | 13F | New Millennium Group LLC | 13,246 | 185.23 | 157 | 168.97 | ||||
| 2026-01-23 | 13F | Rsm Us Wealth Management Llc | 11,377 | -18.26 | 135 | -23.86 | ||||
| 2026-02-10 | 13F | Connor, Clark & Lunn Investment Management Ltd. | 120,783 | 1,431 | ||||||
| 2026-02-11 | 13F | J.Safra Asset Management Corp | 27,797 | 98.59 | 329 | 85.88 | ||||
| 2026-02-13 | 13F | Pinnacle Wealth Planning Services, Inc. | 2,159 | 26 | ||||||
| 2026-02-11 | 13F | Capital International Sarl | 39,177 | 0.00 | 464 | -6.26 | ||||
| 2026-02-17 | 13F | Sagefield Capital LP | 433,731 | 354.04 | 5,140 | 325.06 | ||||
| 2026-01-29 | 13F | RMG Wealth Management LLC | 10 | 0.00 | 0 | |||||
| 2026-01-21 | 13F | Westfuller Advisors, LLC | 6,888 | -0.88 | 84 | -5.62 | ||||
| 2026-02-17 | 13F | Schonfeld Strategic Advisors LLC | 116,030 | -50.80 | 1,375 | -53.97 | ||||
| 2026-02-09 | 13F | Employees Retirement System of Texas | 65,509 | -69.83 | 1 | -100.00 | ||||
| 2026-02-17 | 13F | Abel Hall, LLC | 20,500 | 0.00 | 243 | -6.56 | ||||
| 2026-01-22 | 13F | HHM Wealth Advisors, LLC | 500 | 0.00 | 6 | -16.67 | ||||
| 2025-09-26 | NP | INVESCO ACTIVELY MANAGED EXCHANGE-TRADED FUND TRUST - Invesco Global Equity Net Zero ETF | 6,564 | 84 | ||||||
| 2026-02-05 | 13F | Blume Capital Management, Inc. | 300 | 0.00 | 4 | 0.00 | ||||
| 2026-02-06 | 13F | Kilter Group LLC | 0 | -100.00 | 0 | |||||
| 2026-02-02 | 13F | Fifth Third Bancorp | 43,162 | -6.25 | 511 | -12.20 | ||||
| 2025-09-24 | NP | EMQAX - Ashmore Emerging Markets Active Equity Fund CLASS A | 0 | -100.00 | 0 | -100.00 | ||||
| 2026-02-13 | 13F | VPR Management LLC | 132,846 | 0.00 | 1,574 | -6.37 | ||||
| 2026-01-29 | 13F | Nbc Securities, Inc. | Put | 10 | 1 | |||||
| 2026-02-10 | 13F | Avestar Capital, LLC | 14,523 | -40.31 | 172 | -44.16 | ||||
| 2026-01-29 | 13F | Sava Infond d.o.o. | 23,000 | 0.00 | 273 | -6.53 | ||||
| 2026-01-21 | 13F | Provident Living Financial Services, Inc. | 88,360 | 1,047 | ||||||
| 2026-02-17 | 13F | Redwood Park Advisors LLC | 6,818 | 60.50 | 81 | 50.94 | ||||
| 2026-02-10 | 13F | Natixis Advisors, L.p. | 1,231,385 | -6.68 | 15 | -12.50 | ||||
| 2026-02-12 | 13F | Sprott Inc. | 0 | -100.00 | 0 | |||||
| 2025-08-27 | NP | TPDAX - Timothy Plan Defensive Strategies Fund Class A | 12,064 | 0.00 | 151 | -12.79 | ||||
| 2025-08-28 | NP | GQJPX - GQG PARTNERS INTERNATIONAL QUALITY DIVIDEND INCOME FUND Investor Shares | 964,156 | 16.13 | 12,062 | 1.30 | ||||
| 2026-02-05 | 13F | Atria Investments Llc | 25,140 | 0.89 | 298 | -5.71 | ||||
| 2026-02-20 | 13F/A | CMT Capital Markets Trading GmbH | 31,702 | -79.09 | 0 | -100.00 | ||||
| 2026-02-13 | 13F | Absolute Gestao de Investimentos Ltda. | 72,841 | 863 | ||||||
| 2026-02-12 | 13F | Rossby Financial, LCC | 11,798 | 9.16 | 140 | 2.21 | ||||
| 2026-02-12 | 13F | Skopos Labs, Inc. | 52,920 | 132.02 | 613 | 117.38 | ||||
| 2025-08-28 | NP | RWCIX - RWC Global Emerging Equity Fund Class I Shares | 399,399 | 31.80 | 4,996 | 14.98 | ||||
| 2025-08-27 | 13F/A | Squarepoint Ops LLC | Call | 0 | -100.00 | 0 | -100.00 | |||
| 2025-09-29 | NP | VRAI - Virtus Real Asset Income ETF | 13,126 | 19.38 | 167 | 34.68 | ||||
| 2025-11-25 | 13F | Alexander Labrunerie & Co., Inc. | 10,050 | 0.00 | 127 | 1.60 | ||||
| 2025-11-14 | 13F | Parallax Volatility Advisers, L.P. | 0 | -100.00 | 0 | -100.00 | ||||
| 2026-02-13 | 13F | MAI Capital Management | 3,945 | -15.78 | 47 | -22.03 | ||||
| 2025-09-25 | NP | MFWTX - MFS Global Total Return Fund A | 151,477 | -1.24 | 1,930 | 11.44 | ||||
| 2025-11-13 | 13F | Contrarian Capital Management, L.l.c. | 0 | -100.00 | 0 | -100.00 | ||||
| 2025-09-25 | NP | Dimensional Emerging Markets Value Fund - Dimensional Emerging Markets Value Fund This fund is a listed as child fund of Dimensional Fund Advisors Lp and if that institution has disclosed ownership in this security, then these positions will not be double counted when calculating total shares and total value | 1,849,041 | 0.00 | 23,557 | 12.84 | ||||
| 2025-09-29 | NP | MPEMX - MONDRIAN EMERGING MARKETS VALUE EQUITY FUND | 35,064 | 5.43 | 447 | 18.93 | ||||
| 2026-01-08 | 13F | Brave Asset Management Inc | 0 | -100.00 | 0 | |||||
| 2026-01-22 | 13F | Financial Consulate, Inc | 45 | 1 | ||||||
| 2026-02-17 | 13F | Moneda S.A. Administradora General de Fondos | 394,281 | -12.12 | 4,672 | -10.53 | ||||
| 2026-02-19 | 13F | Invesco Ltd. | 27,974,691 | 55.29 | 331,500 | 45.35 | ||||
| 2026-01-15 | 13F | Foster & Motley Inc | 60,230 | -36.00 | 1 | -100.00 | ||||
| 2026-02-10 | 13F | Channing Global Advisors, Llc | 0 | -100.00 | 0 | |||||
| 2026-02-17 | 13F | Strategic Investment Advisors / MI | 13,741 | -18.31 | 163 | -23.58 | ||||
| 2026-02-06 | 13F | Verde Servicos Internacionais S.A. | 2,400 | 0 | ||||||
| 2025-11-14 | 13F | Axa S.a. | 0 | -100.00 | 0 | |||||
| 2026-02-11 | 13F | BI Asset Management Fondsmaeglerselskab A/S | 0 | -100.00 | 0 | |||||
| 2025-09-26 | NP | FAMKX - Fidelity Advisor Emerging Markets Fund Class A This fund is a listed as child fund of Fmr Llc and if that institution has disclosed ownership in this security, then these positions will not be double counted when calculating total shares and total value | 9,691,147 | -11.16 | 123,465 | 0.25 | ||||
| 2026-02-17 | 13F | Massar Capital Management, LP | 0 | -100.00 | 0 | |||||
| 2026-02-06 | 13F | Global Retirement Partners, LLC | 18,998 | -75.05 | 225 | -76.66 | ||||
| 2026-02-12 | 13F | Hudock, Inc. | 15,498 | 0.73 | 184 | -5.67 | ||||
| 2026-01-15 | 13F | Nisa Investment Advisors, Llc | 1,500 | -31.82 | 19 | -35.71 | ||||
| 2026-02-13 | 13F | Mml Investors Services, Llc | 57,806 | -4.66 | 685 | -10.69 | ||||
| 2026-02-17 | 13F | Engineers Gate Manager LP | 189,726 | -0.10 | 2,248 | -6.49 | ||||
| 2026-01-29 | 13F | Teachers Retirement System Of The State Of Kentucky | 1,969,030 | 0.00 | 23 | -4.17 | ||||
| 2026-02-17 | 13F | Royal Bank Of Canada | Put | 261,000 | 3,093 | |||||
| 2026-02-17 | 13F | Royal Bank Of Canada | Call | 25,000 | 0.00 | 296 | -6.62 | |||
| 2026-02-17 | 13F | Royal Bank Of Canada | 512,246 | 20.54 | 6,070 | 12.83 | ||||
| 2026-02-02 | 13F | Principal Financial Group Inc | 137,994 | 18.22 | 1,635 | 10.70 | ||||
| 2026-02-17 | 13F | Northern Trust Corp | 1,724,470 | -9.98 | 20,435 | -15.75 | ||||
| 2025-09-26 | NP | MSTFX - Morningstar International Equity Fund | 81,481 | -64.45 | 1,038 | -64.45 | ||||
| 2026-02-13 | 13F | FORA Capital, LLC | 0 | -100.00 | 0 | |||||
| 2025-09-26 | NP | FEMSX - Fidelity Series Emerging Markets Opportunities Fund This fund is a listed as child fund of Fmr Llc and if that institution has disclosed ownership in this security, then these positions will not be double counted when calculating total shares and total value | 3,710,035 | 0.00 | 47,266 | 12.84 | ||||
| 2026-02-12 | 13F | Jane Street Group, Llc | Put | 3,317,500 | 216.77 | 39,312 | 196.52 | |||
| 2026-02-12 | 13F | Jane Street Group, Llc | Call | 985,600 | 96.14 | 11,679 | 83.60 | |||
| 2026-02-17 | 13F | Private Advisor Group, LLC | 159,116 | -3.92 | 1,886 | -10.07 | ||||
| 2025-11-13 | 13F | Banque Cantonale Vaudoise | 0 | -100.00 | 0 | |||||
| 2026-02-12 | 13F | Jane Street Group, Llc | 1,455,710 | -28.43 | 17,250 | -33.01 | ||||
| 2026-02-13 | 13F | Hurley Capital, LLC | Call | 45 | 0.00 | 8 | -33.33 | |||
| 2026-02-13 | 13F | Wells Fargo & Company/mn | 1,157,480 | 24.40 | 13,716 | 16.44 | ||||
| 2025-11-03 | 13F | Ballentine Partners, LLC | 0 | -100.00 | 0 | -100.00 | ||||
| 2026-02-02 | 13F | Sachetta, LLC | 0 | -100.00 | 0 | |||||
| 2025-11-12 | 13F | Victory Capital Management Inc | 0 | -100.00 | 0 | |||||
| 2026-02-06 | 13F | Axxcess Wealth Management, Llc | 18,055 | -2.75 | 214 | -9.36 | ||||
| 2026-02-17 | 13F | Parvin Asset Management, LLC | 12,325 | 54.06 | 146 | 44.55 | ||||
| 2026-02-20 | 13F/A | Capital Markets Trading UK LLP | 440,351 | 99.01 | 5 | 150.00 | ||||
| 2026-01-29 | 13F | Sanctuary Advisors, LLC | 109,739 | 5.86 | 1,300 | -0.91 | ||||
| 2026-02-02 | 13F | Horizon Investments, LLC | 55 | 1 | ||||||
| 2026-02-13 | 13F | Segall Bryant & Hamill, Llc | 36,200 | 0.00 | 429 | -6.55 | ||||
| 2026-02-13 | 13F | Squarepoint Ops LLC | Put | 218,000 | -65.93 | 2,583 | -68.11 | |||
| 2026-02-13 | 13F | Squarepoint Ops LLC | 657,453 | 93.54 | 7,791 | 81.16 | ||||
| 2025-11-14 | 13F | Cubist Systematic Strategies, LLC | Call | 354,800 | 5.97 | 4,492 | 7.23 | |||
| 2025-11-14 | 13F | Cubist Systematic Strategies, LLC | 1,932,399 | 508.33 | 24,464 | 515.76 | ||||
| 2026-02-03 | 13F | Wesbanco Bank Inc | 0 | -100.00 | 0 | |||||
| 2026-02-17 | 13F | Balyasny Asset Management Llc | 122,559 | 1,452 | ||||||
| 2026-02-17 | 13F | Balyasny Asset Management Llc | Call | 209,300 | 8.61 | 2,480 | 1.68 | |||
| 2026-02-03 | 13F | Sumitomo Mitsui DS Asset Management Company, Ltd | 11,000 | -31.25 | 130 | -35.64 | ||||
| 2026-02-17 | 13F | Balyasny Asset Management Llc | Put | 64,000 | -34.09 | 758 | -38.32 | |||
| 2025-08-29 | NP | Gabelli Dividend & Income Trust | 25,000 | 0.00 | 313 | -12.85 | ||||
| 2026-01-21 | 13F | Ameliora Wealth Management Ltd. | 4,000 | 0.00 | 47 | -6.00 | ||||
| 2025-08-28 | NP | CSNR - Cohen & Steers Natural Resources Active ETF | 13,840 | 103.74 | 173 | 78.35 | ||||
| 2025-09-26 | NP | RTXAX - Tax-Managed Real Assets Fund Class A | 49,430 | 104.19 | 630 | 130.40 | ||||
| 2026-01-30 | 13F/A | M&t Bank Corp | 21,581 | 0.00 | 256 | -6.59 | ||||
| 2026-01-30 | 13F | Mitsubishi UFJ Trust & Banking Corp | 320,149 | -37.26 | 3,794 | -41.28 | ||||
| 2026-01-15 | 13F | Frank, Rimerman Advisors LLC | 35,055 | -15.67 | 415 | -21.10 | ||||
| 2026-02-05 | 13F | Gabelli Funds Llc | 35,000 | 0.00 | 415 | -6.55 | ||||
| 2026-01-27 | 13F | Checchi Capital Advisers, LLC | 23,434 | -3.74 | 278 | -10.06 | ||||
| 2026-02-06 | 13F | Abn Amro Investment Solutions | 42,100 | 312.75 | 499 | 286.05 | ||||
| 2026-01-23 | 13F | Tyche Wealth Partners LLC | 23,963 | -6.82 | 284 | -12.92 | ||||
| 2026-02-10 | 13F | NINE MASTS CAPITAL Ltd | 410,245 | 4,861 | ||||||
| 2026-02-10 | 13F | Hazlett, Burt & Watson, Inc. | 974 | 0.00 | 0 | |||||
| 2026-01-12 | 13F | Salem Investment Counselors Inc | 502,831 | -6.46 | 5,962 | -12.39 | ||||
| 2026-02-02 | 13F | Truist Financial Corp | 32,726 | 2.60 | 388 | -3.97 | ||||
| 2026-01-23 | 13F | Assetmark, Inc | 1,174,976 | 8.71 | 13,923 | 1.75 | ||||
| 2026-01-15 | 13F | Victory Financial Group, Llc | 21,048 | -0.01 | 249 | -6.39 | ||||
| 2026-02-17 | 13F | Advisor Group Holdings, Inc. | Call | 2 | 0 | |||||
| 2025-09-29 | NP | CVY - Invesco Zacks Multi-Asset Income ETF This fund is a listed as child fund of Invesco Ltd. and if that institution has disclosed ownership in this security, then these positions will not be double counted when calculating total shares and total value | 0 | -100.00 | 0 | -100.00 | ||||
| 2026-02-06 | 13F | Poehling Capital Management, LLC | 239,046 | 1.35 | 2,833 | -5.16 | ||||
| 2026-02-03 | 13F | Horrell Capital Management, Inc. | 500 | 0.00 | 6 | -16.67 | ||||
| 2026-02-17 | 13F | Two Sigma Advisers, Lp | 145,700 | 250.24 | 1,727 | 228.14 | ||||
| 2026-02-09 | 13F | Cypress Capital Management LLC (WY) | 4 | 0.00 | 0 | |||||
| 2026-01-14 | 13F | Spire Wealth Management | 7,035 | 15.75 | 83 | 9.21 | ||||
| 2026-02-11 | 13F | IMA Wealth, Inc. | 118 | 1 | ||||||
| 2025-11-03 | 13F | Kapitalo Investimentos Ltda | 0 | -100.00 | 0 | |||||
| 2026-02-17 | 13F | Aqr Capital Management Llc | 132,396 | 27.47 | 1,569 | 19.33 | ||||
| 2026-02-12 | 13F | Quadrant Capital Group Llc | 20,624 | -46.32 | 244 | -49.79 | ||||
| 2025-11-17 | 13F | FSA Wealth Management LLC | 68 | 0.00 | 1 | |||||
| 2025-11-14 | 13F | Gotham Asset Management, LLC | 0 | -100.00 | 0 | |||||
| 2026-01-21 | 13F | Prime Capital Investment Advisors, LLC | 93,798 | -1.29 | 1,112 | -7.57 | ||||
| 2026-02-12 | 13F | Tocqueville Asset Management L.p. | 25,675 | -7.56 | 304 | -13.39 | ||||
| 2026-01-21 | 13F | Step Capital Management Pte. Ltd. | 60,000 | 676 | ||||||
| 2026-02-10 | 13F | CIBC World Markets Inc. | 67,577 | 38.46 | 801 | 29.66 | ||||
| 2026-02-17 | 13F | D. E. Shaw & Co., Inc. | Put | 525,000 | 62.74 | 6,221 | 52.33 | |||
| 2026-02-17 | 13F | D. E. Shaw & Co., Inc. | 300,303 | -93.80 | 3,559 | -94.20 | ||||
| 2026-02-17 | 13F | D. E. Shaw & Co., Inc. | Call | 235,000 | -69.35 | 2,785 | -71.32 | |||
| 2026-02-17 | 13F | Janus Henderson Group Plc | 282,958 | 3,352 | ||||||
| 2026-02-05 | 13F | DnB Asset Management AS | 1,837,813 | 21,778 | ||||||
| 2026-01-29 | 13F | James Investment Research Inc | 23,219 | -12.63 | 275 | -18.15 | ||||
| 2026-02-20 | 13F/A | CMT Capital Markets Trading GmbH | Put | 779,900 | -29.76 | 9 | -35.71 | |||
| 2026-01-29 | 13F | Deltec Asset Management Llc | 71,000 | 9.23 | 841 | 2.31 | ||||
| 2026-02-20 | 13F/A | CMT Capital Markets Trading GmbH | Call | 1,269,400 | -18.95 | 15 | -21.05 | |||
| 2025-10-06 | 13F | NWF Advisory Services Inc. | 0 | -100.00 | 0 | -100.00 | ||||
| 2026-02-17 | 13F | Blair William & Co/il | 10,861 | 1,314.19 | 129 | 1,322.22 | ||||
| 2026-02-17 | 13F | Susquehanna International Group, Llp | 2,323,782 | 87.14 | 27,537 | 75.17 | ||||
| 2026-02-17 | 13F | Susquehanna International Group, Llp | Put | 9,523,000 | -2.44 | 112,848 | -8.68 | |||
| 2025-08-28 | NP | GQFPX - GQG PARTNERS GLOBAL QUALITY DIVIDEND INCOME FUND Investor Shares | 440,928 | 15.17 | 5,516 | 0.49 | ||||
| 2026-01-08 | 13F | True Wealth Design, LLC | 519 | 41.42 | 6 | 50.00 | ||||
| 2026-02-17 | 13F | PACK Private Wealth, LLC | 10,767 | -21.18 | 128 | -26.16 | ||||
| 2026-02-05 | 13F | Financial Security Advisor, Inc. | 0 | -100.00 | 0 | |||||
| 2026-02-17 | 13F | Susquehanna International Group, Llp | Call | 8,866,200 | 57.85 | 105,064 | 47.75 | |||
| 2025-09-26 | NP | REMSX - Emerging Markets Fund Class S | 0 | -100.00 | 0 | -100.00 | ||||
| 2026-02-10 | 13F | Daiwa Securities Group Inc. | 157,123 | 182.10 | 2 | -66.67 | ||||
| 2026-01-28 | 13F | B. Metzler seel. Sohn & Co. AG | 220,671 | -42.27 | 2,615 | -45.98 | ||||
| 2025-09-25 | NP | DFCEX - Emerging Markets Core Equity Portfolio - Institutional Class This fund is a listed as child fund of Dimensional Fund Advisors Lp and if that institution has disclosed ownership in this security, then these positions will not be double counted when calculating total shares and total value | 297,124 | 0.00 | 3,785 | 12.85 | ||||
| 2026-01-29 | 13F | Pictet Asset Management Holding SA | 0 | -100.00 | 0 | |||||
| 2026-02-13 | 13F | HITE Hedge Asset Management LLC | 45,725 | -51.91 | 542 | -55.03 | ||||
| 2026-01-15 | 13F | J. Safra Sarasin Holding AG | 106,000 | 0.00 | 1,256 | -6.34 | ||||
| 2025-11-14 | 13F | Jain Global LLC | 0 | -100.00 | 0 | |||||
| 2026-01-16 | 13F | FNY Investment Advisers, LLC | 11,420 | 1,868.97 | 0 | |||||
| 2026-02-12 | 13F | Commonwealth Equity Services, Llc | 134,046 | -10.39 | 1,588 | 158,700.00 | ||||
| 2025-09-26 | 13F | Capital A Wealth Management, LLC | 0 | -100.00 | 0 | |||||
| 2026-02-13 | 13F | Pathstone Holdings, LLC | 27,694 | -8.32 | 328 | -14.14 | ||||
| 2026-01-27 | 13F | Evergreen Capital Management Llc | 39,541 | -38.02 | 476 | -41.43 | ||||
| 2026-01-15 | 13F | 25 Llc | 15,645 | 0.00 | 185 | -6.57 | ||||
| 2026-01-21 | 13F | Flagship Harbor Advisors, Llc | 1,209 | 14 | ||||||
| 2026-01-30 | 13F | Activest Wealth Management | 12,400 | 80.65 | 147 | 69.77 | ||||
| 2026-02-12 | 13F | Earnest Partners Llc | 5,335,330 | 9.50 | 63,224 | 2.49 | ||||
| 2025-11-14 | 13F | Graham Capital Management, L.P. | 0 | -100.00 | 0 | -100.00 | ||||
| 2025-10-30 | 13F | Ridgewood Investments LLC | Call | 0 | -100.00 | 0 | -100.00 | |||
| 2026-01-30 | 13F | Caldwell Trust Co | 115 | 1 | ||||||
| 2026-02-17 | 13F/A | RBF Capital, LLC | 100,000 | -16.67 | 1,185 | -21.99 | ||||
| 2026-01-05 | 13F | Union Bancaire Privee, UBP SA | 44,068 | 26.58 | 497 | 9.23 | ||||
| 2026-01-23 | 13F | Baillie Gifford & Co | 29,523,522 | -7.99 | 349,854 | -13.88 | ||||
| 2026-02-17 | 13F | Bank Of America Corp /de/ | 13,767,405 | 61.61 | 163,144 | 51.27 | ||||
| 2026-02-09 | 13F | Hartland & Co., LLC | 2,330 | 273.40 | 28 | 285.71 | ||||
| 2026-02-17 | 13F | United Capital Financial Advisers, Llc | 19,234 | 7.96 | 228 | 0.89 | ||||
| 2026-02-04 | 13F | Abc Arbitrage Sa | 25,949 | -86.80 | 307 | -87.67 | ||||
| 2025-08-28 | NP | Principal Diversified Select Real Asset Fund | 3,043 | 1.87 | 38 | -9.52 | ||||
| 2026-01-29 | 13F | Aprio Wealth Management, LLC | 19,928 | 8.26 | 236 | 1.29 | ||||
| 2026-02-10 | 13F | Bnp Paribas Arbitrage, Sa | Call | 11,231 | 34.55 | 13,309 | 25.94 | |||
| 2026-02-17 | 13F | Limestone Investment Advisors LP | Put | 0 | -100.00 | 0 | ||||
| 2026-02-10 | 13F | Bnp Paribas Arbitrage, Sa | 580,110 | 196.37 | 6,874 | 177.40 | ||||
| 2026-02-02 | 13F | Advisors Preferred, LLC | 20,609 | -89.50 | 246 | -90.10 | ||||
| 2026-02-05 | 13F | Bank Julius Baer & Co. Ltd, Zurich | 163,600 | -3.76 | 1,939 | -9.94 | ||||
| 2026-02-09 | 13F | IPG Investment Advisors LLC | 185,185 | -51.28 | 2,260 | -53.92 | ||||
| 2026-02-10 | 13F | Bnp Paribas Arbitrage, Sa | Put | 11,042 | 5.95 | 13,085 | -0.83 | |||
| 2026-02-13 | 13F | American Century Companies Inc | 3,423,333 | 13.42 | 40,566 | 6.16 | ||||
| 2026-02-03 | 13F | Plan Group Financial, LLC | 0 | -100.00 | 0 | |||||
| 2026-02-11 | 13F | LPL Financial LLC | 462,738 | 33.21 | 5,483 | 24.70 | ||||
| 2026-02-12 | 13F | CIBC Private Wealth Group, LLC | 765 | 6.55 | 9 | 0.00 | ||||
| 2025-09-26 | NP | RMYAX - Multi-Strategy Income Fund Class A | 11,551 | -34.79 | 147 | -26.13 | ||||
| 2026-02-12 | 13F | Sagil Capital Llp | 611,224 | 7,243 | ||||||
| 2026-02-12 | 13F | Sagil Capital Llp | Call | 350,000 | 4,148 | |||||
| 2026-02-17 | 13F | Grantham, Mayo, Van Otterloo & Co. LLC | 24,048 | -16.46 | 285 | -21.98 | ||||
| 2026-02-13 | 13F | Maven Securities LTD | 54,818 | 650 | ||||||
| 2026-02-12 | 13F | Ci Investments Inc. | 582,509 | -64.77 | 6,903 | 34,410.00 | ||||
| 2026-01-29 | 13F | Quest 10 Wealth Builders, Inc. | 0 | -100.00 | 0 | |||||
| 2026-02-10 | 13F | Rothschild Investment Llc | 450 | 0.00 | 5 | 0.00 | ||||
| 2025-11-14 | 13F | Hrt Financial Lp | 0 | -100.00 | 0 | |||||
| 2025-11-14 | 13F | Wood Tarver Financial Group, LLC | 0 | -100.00 | 0 | |||||
| 2026-02-18 | 13F | Vident Advisory, LLC | 116,497 | -9.16 | 1,380 | -14.97 | ||||
| 2026-02-13 | 13F | Centiva Capital, LP | 0 | -100.00 | 0 | |||||
| 2026-02-12 | 13F | DRW Securities, LLC | 203,796 | 207.50 | 2,415 | 188.41 | ||||
| 2026-01-20 | 13F | SOA Wealth Advisors, LLC. | 600 | 0.00 | 7 | 0.00 | ||||
| 2026-01-23 | 13F | U.S. Capital Wealth Advisors, LLC | 14,200 | -1.39 | 168 | -7.69 | ||||
| 2026-02-12 | 13F | Brinker Capital Investments, LLC | 101,951 | 9.54 | 1,208 | 2.55 | ||||
| 2026-02-06 | 13F | IFP Advisors, Inc | 1,003 | 0.00 | 12 | -8.33 | ||||
| 2026-02-12 | 13F | Dimensional Fund Advisors Lp | 3,184,306 | 1.60 | 37,734 | -5.00 | ||||
| 2026-02-09 | 13F | Hantz Financial Services, Inc. | 40,130 | -5.89 | 0 | |||||
| 2026-01-09 | 13F | SG Americas Securities, LLC | 46,329 | -41.71 | 1 | -100.00 | ||||
| 2026-02-13 | 13F | National Bank Of Canada /fi/ | 546 | -68.29 | 6 | -71.43 | ||||
| 2025-11-12 | 13F | HAP Trading, LLC | Put | 18,300 | 5 | |||||
| 2026-02-17 | 13F | Mercer Global Advisors Inc /adv | 13,178 | -19.60 | 156 | -24.64 | ||||
| 2026-02-20 | 13F/A | Capital Markets Trading UK LLP | Put | 1,654,300 | 20.72 | 20 | 11.76 | |||
| 2026-02-20 | 13F/A | Capital Markets Trading UK LLP | Call | 1,600,000 | 61.23 | 19 | 58.33 | |||
| 2025-11-12 | 13F | HAP Trading, LLC | Call | 14,100 | 7 | |||||
| 2026-02-13 | 13F | Mariner, LLC | 81,131 | 110.24 | 961 | 96.93 | ||||
| 2026-02-17 | 13F | Raymond James Financial Inc | 503,374 | 11.84 | 5,965 | 4.69 | ||||
| 2025-09-25 | NP | PRLAX - T. Rowe Price Latin America Fund This fund is a listed as child fund of Price T Rowe Associates Inc /md/ and if that institution has disclosed ownership in this security, then these positions will not be double counted when calculating total shares and total value | 696,277 | 9.62 | 8,871 | 23.69 | ||||
| 2026-02-12 | 13F | Brown Brothers Harriman & Co | 586 | 75.45 | 7 | 50.00 | ||||
| 2025-11-13 | 13F | Hsbc Holdings Plc | 1,078,853 | 23.45 | 13,656 | 24.92 | ||||
| 2025-11-13 | 13F | Hsbc Holdings Plc | Call | 175,700 | -5.89 | 2,221 | -4.93 | |||
| 2025-11-13 | 13F | Hsbc Holdings Plc | Put | 526,500 | -3.31 | 6,655 | -2.31 | |||
| 2026-01-29 | 13F | Vanguard Group Inc | 1,221,885 | 5.68 | 14,479 | -1.08 | ||||
| 2025-09-24 | NP | DAINX - Dunham International Stock Fund Class A | 0 | -100.00 | 0 | -100.00 | ||||
| 2026-01-16 | 13F | Ellsworth Advisors, LLC | 458,421 | 5,781 | ||||||
| 2025-11-13 | 13F | Diametric Capital, LP | 0 | -100.00 | 0 | |||||
| 2026-02-13 | 13F | Marshall Wace, Llp | 0 | -100.00 | 0 | |||||
| 2026-01-29 | 13F | Kestra Private Wealth Services, Llc | 12,037 | 0.74 | 143 | -5.96 | ||||
| 2026-02-19 | 13F | CI Private Wealth, LLC | 48,623 | -17.10 | 563 | -24.26 | ||||
| 2026-02-17 | 13F | Quantinno Capital Management LP | 138,736 | 64.04 | 1,644 | 53.64 | ||||
| 2025-09-26 | NP | RAZAX - Multi-Asset Growth Strategy Fund Class A | 28,548 | -32.83 | 364 | -24.22 | ||||
| 2026-02-12 | 13F | Bank Of Montreal /can/ | 49,454 | -30.65 | 586 | -35.03 | ||||
| 2026-01-20 | 13F | AdvisorNet Financial, Inc | 1,768 | 0.00 | 21 | -9.09 | ||||
| 2026-01-23 | 13F | Lester Murray Antman dba SimplyRich | 34,094 | 17.70 | 0 | |||||
| 2026-02-12 | 13F | Raiffeisen Bank International AG | 90,000 | 1,067 | ||||||
| 2026-02-17 | 13F | LMR Partners LLP | 175,000 | 2,074 | ||||||
| 2025-11-14 | 13F | Capstone Investment Advisors, Llc | 33,948 | 430 | ||||||
| 2026-02-17 | 13F | LMR Partners LLP | Call | 40,700 | 482 | |||||
| 2026-02-17 | 13F | LMR Partners LLP | Put | 188,900 | 2,238 | |||||
| 2026-02-17 | 13F | Aspen Grove Capital, LLC | 0 | -100.00 | 0 | |||||
| 2026-02-06 | 13F | Cullen/frost Bankers, Inc. | 578 | 1.76 | 7 | -14.29 | ||||
| 2026-01-28 | 13F | CAPROCK Group, Inc. | 104,497 | -5.18 | 1,272 | -10.55 | ||||
| 2026-01-27 | 13F | Hennessy Advisors Inc | 372,000 | -5.30 | 4,408 | -11.34 | ||||
| 2025-11-14 | 13F | Cubist Systematic Strategies, LLC | Put | 118,300 | -50.56 | 1,498 | -49.98 | |||
| 2026-02-13 | 13F | Allie Family Office LLC | 13,860 | 0.00 | 164 | -6.82 | ||||
| 2025-10-08 | 13F | FCG Investment Co | 0 | -100.00 | 0 |