Estatísticas Básicas
| Ações Institucionais (Longas) | 255,045,454 - 50.09% (ex 13D/G) - change of -10.54MM shares -3.97% MRQ |
| Valor Institucional (Longa) | $ 12,931,456 USD ($1000) |
Propriedade Institucional e Acionistas
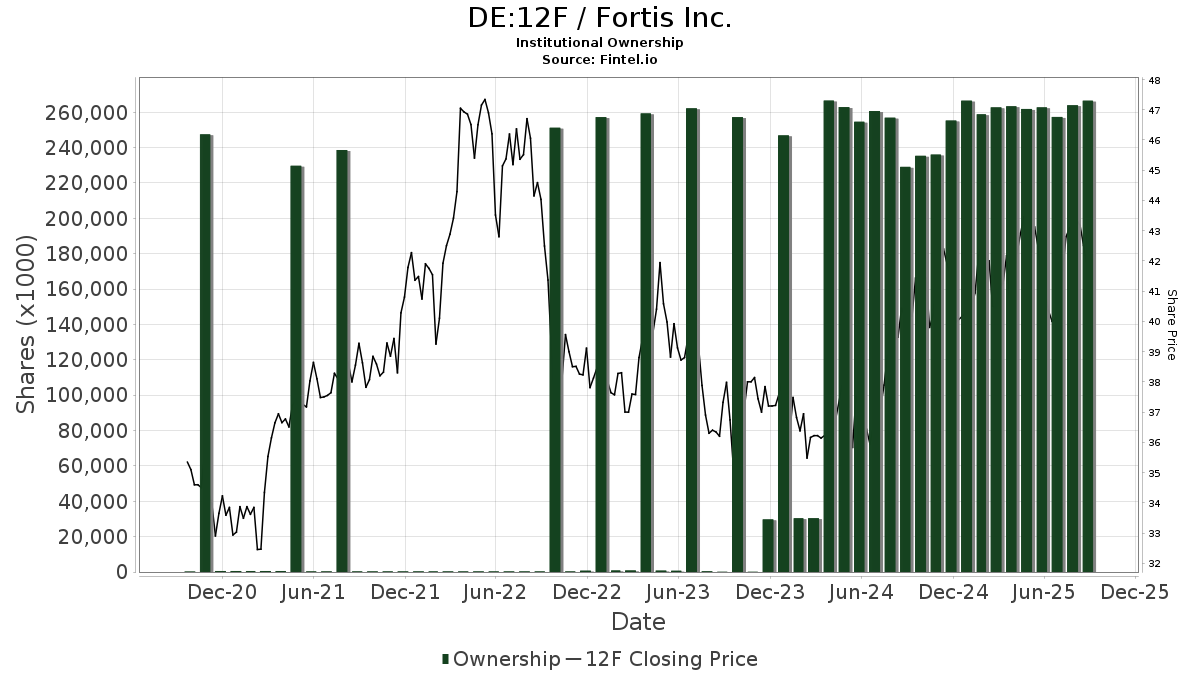
Fortis Inc. (DE:12F) tem 319 proprietários e acionistas institucionais que enviaram os formulários 13D/G ou 13F para a Comissão de Valores Mobiliários (SEC). Essas instituições possuem um total de 255,045,454 ações. Os maiores acionistas incluem Royal Bank Of Canada, Bank Of Montreal /can/, Vanguard Group Inc, FIL Ltd, Td Asset Management Inc, Scotia Capital Inc., CIBC World Markets Inc., 1832 Asset Management L.P., National Bank Of Canada /fi/, and Geode Capital Management, Llc .
Fortis Inc. (DB:12F) a estrutura de propriedade institucional mostra as posições atuais na empresa por instituições e fundos, bem como as últimas mudanças no tamanho da posição. Os principais acionistas podem incluir investidores individuais, fundos mútuos, fundos de cobertura ou instituições. O Schedule 13D indica que o investidor possui (ou possuía) mais de 5% da empresa e pretende (ou pretendia) buscar ativamente uma mudança na estratégia de negócios. O Schedule 13G indica um investimento passivo de mais de 5%.
The share price as of April 24, 2026 is 48.20 / share. Previously, on April 28, 2025, the share price was 42.42 / share. This represents an increase of 13.63% over that period.
Pontuação do Sentimento do Fundo
A Pontuação do Sentimento do Fundo (anteriormente conhecida como Pontuação de Acumulação de Propriedade) identifica as ações que estão sendo mais compradas pelos fundos. É o resultado de um modelo quantitativo sofisticado e multifatorial que identifica empresas com os maiores níveis de acumulação institucional. O modelo de pontuação utiliza uma combinação do aumento total em proprietários divulgados, as mudanças nas alocações de portfólio desses proprietários e outras métricas. O número varia de 0 a 100, com números mais altos indicando um nível maior de acumulação em relação aos seus pares, sendo 50 a média.
Frequência de Atualização: Diariamente
Veja o Explorador de Propriedade, que fornece uma lista das empresas com melhor classificação.
AI+ Ask Fintel’s AI assistant about Fortis Inc..
Select a question to share a public post with an AI-crafted answer.
Thinking of good questions…
Arquivamentos 13F e NPORT
Detalhes sobre Formulários 13F são gratuitos. Detalhes sobre Formulários NP requerem uma assinatura premium. Linhas verdes indicam novas posições. Linhas vermelhas indicam posições fechadas. Clique no ícone de link para ver o histórico completo de transações.
Atualize
para desbloquear dados premium e exportar para Excel ![]() .
.
| Data do Arquivo | Fonte | Investidor | Tipo | Preço Médio (Est) |
Ações | Δ Ações (%) |
Valor Reportado (US$1000) |
Δ Valor (%) |
Aloc. de Portf. (%) |
|
|---|---|---|---|---|---|---|---|---|---|---|
| 2026-02-17 | 13F | Greenland Capital Management LP | 20,120 | -74.69 | 1,047 | -74.04 | ||||
| 2026-02-11 | 13F | Jpmorgan Chase & Co | 2,470,063 | -2.13 | 128,295 | 0.18 | ||||
| 2026-02-13 | 13F | Aviso Financial Inc. | 0 | -100.00 | 0 | |||||
| 2026-02-11 | 13F | Syon Capital Llc | 8,028 | 417 | ||||||
| 2026-02-09 | 13F | Knights of Columbus Asset Advisors LLC | 76,802 | 5.15 | 3,989 | 7.64 | ||||
| 2026-02-17 | 13F | Maryland State Retirement & Pension System | 577,450 | -5.41 | 30,036 | -2.97 | ||||
| 2026-02-04 | 13F | Heronetta Management, L.P. | 86,000 | 0.00 | 6,137 | 1.09 | ||||
| 2026-01-30 | 13F | Bogart Wealth, LLC | 7 | 0.00 | 0 | |||||
| 2026-02-17 | 13F | Man Group plc | 154,126 | 629.69 | 8,005 | 647.43 | ||||
| 2026-02-17 | 13F | Bank Of America Corp /de/ | 2,370,940 | -5.48 | 123,147 | -3.24 | ||||
| 2026-02-17 | 13F | Glenmede Trust Co Na | 0 | -100.00 | 0 | |||||
| 2026-02-12 | 13F | Northwest & Ethical Investments L.P. | 419,102 | -9.03 | 21,790 | -6.76 | ||||
| 2026-04-22 | 13F | Janney Montgomery Scott LLC | 16,458 | -3.77 | 1 | |||||
| 2026-04-24 | 13F | Triasima Portfolio Management inc. | 256,307 | 2.49 | 14,254 | 9.48 | ||||
| 2026-02-11 | 13F | Argonautica Private Wealth Management, Inc | 11,943 | 51.27 | 620 | 55.00 | ||||
| 2026-02-10 | 13F | Bnp Paribas Arbitrage, Sa | 13,352 | 73.61 | 694 | 77.69 | ||||
| 2026-02-17 | 13F | Two Sigma Investments, Lp | 635,815 | 33,024 | ||||||
| 2026-02-11 | 13F | Metis Global Partners, LLC | 14,740 | -23.62 | 766 | -21.68 | ||||
| 2026-02-17 | 13F | Jones Financial Companies Lllp | 70,339 | -23.39 | 3,653 | -20.48 | ||||
| 2026-02-13 | 13F | Wells Fargo & Company/mn | 89,904 | -16.24 | 4,677 | -14.07 | ||||
| 2026-02-12 | 13F | Ensign Peak Advisors, Inc | 32,151 | 0.00 | 1,674 | 2.58 | ||||
| 2026-02-17 | 13F | DZ BANK AG Deutsche Zentral Genossenschafts Bank, Frankfurt am Main | 0 | -100.00 | 0 | -100.00 | ||||
| 2026-04-13 | 13F | JCIC Asset Management Inc. | 6,090 | 1.67 | 339 | 9.00 | ||||
| 2026-04-15 | 13F | Addenda Capital Inc. | 169,950 | -0.72 | 13,190 | 7.97 | ||||
| 2026-04-15 | 13F | Financial Management Professionals, Inc. | 221 | 1.84 | 12 | 9.09 | ||||
| 2026-02-17 | 13F | Energy Income Partners, LLC | 0 | -100.00 | 0 | -100.00 | ||||
| 2026-02-17 | 13F | State Of Wisconsin Investment Board | 176,474 | 9,187 | ||||||
| 2026-02-11 | 13F | Parallel Advisors, LLC | 2,499 | 17.16 | 130 | 19.44 | ||||
| 2026-02-13 | 13F | Clarity Asset Management, Inc. | 612 | 0.66 | 32 | 3.33 | ||||
| 2026-02-18 | 13F | State of Tennessee, Treasury Department | 280,859 | -0.05 | 15,058 | 5.62 | ||||
| 2026-02-17 | 13F | Amundi | 861,275 | 28.03 | 44,735 | 31.73 | ||||
| 2025-11-20 | 13F | Asset Dedication, LLC | 0 | -100.00 | 0 | -100.00 | ||||
| 2026-02-03 | 13F | Crossmark Global Holdings, Inc. | 265,074 | -8.43 | 13,768 | -6.27 | ||||
| 2026-02-12 | 13F | Brinker Capital Investments, LLC | 30,083 | 26.67 | 1,563 | 29.63 | ||||
| 2026-02-20 | 13F | Sunbelt Securities, Inc. | 116 | 0.87 | 6 | 20.00 | ||||
| 2026-02-12 | 13F | Aviva Plc | 1,315,444 | 5.79 | 68,444 | 8.62 | ||||
| 2026-02-13 | 13F | Morgan Stanley | 3,549,885 | 4.81 | 184,381 | 7.29 | ||||
| 2026-03-20 | 13F | Purpose Unlimited Inc. | 64,396 | 3,348 | ||||||
| 2026-02-12 | 13F | Principal Securities, Inc. | 0 | -100.00 | 0 | |||||
| 2026-02-10 | 13F | Norges Bank | 6,462,155 | 335,980 | ||||||
| 2026-04-07 | 13F | Cardinal Capital Management, Inc. | 13,000 | 10.97 | 725 | -13.07 | ||||
| 2026-02-17 | 13F | Agf Management Ltd | 21,824 | 82.90 | 1,361 | 61.64 | ||||
| 2026-02-17 | 13F | SIG North Trading, ULC | Put | 163,900 | 1.42 | 8,513 | 3.82 | |||
| 2026-02-17 | 13F | SIG North Trading, ULC | Call | 376,100 | 46.00 | 19,535 | 49.46 | |||
| 2025-11-14 | 13F | Susquehanna International Group, Llp | Call | 0 | -100.00 | 0 | -100.00 | |||
| 2026-04-13 | 13F | Hm Payson & Co | 368 | 0.00 | 21 | 5.26 | ||||
| 2026-04-23 | 13F | Farmers & Merchants Investments Inc | 95,942 | 4.52 | 5,353 | 12.27 | ||||
| 2025-11-12 | 13F | K.J. Harrison & Partners Inc | 0 | -100.00 | 0 | -100.00 | ||||
| 2025-11-14 | 13F | ExodusPoint Capital Management, LP | 0 | -100.00 | 0 | |||||
| 2026-02-13 | 13F | Towarzystwo Funduszy Inwestycyjnych Pzu Sa | 0 | -100.00 | 0 | |||||
| 2026-01-26 | 13F | Duff & Phelps Investment Management Co | 981,900 | 0.00 | 51,117 | 2.61 | ||||
| 2026-02-12 | 13F | BRYN MAWR TRUST Co | 171 | -95.73 | 9 | -96.06 | ||||
| 2026-01-16 | 13F | Verus Wealth Management, Llc | 0 | -100.00 | 0 | |||||
| 2026-02-12 | 13F | BlackRock, Inc. | 1,414,678 | 16.26 | 73,478 | 19.01 | ||||
| 2026-02-12 | 13F | Concorde Asset Management, LLC | 29,000 | 0.00 | 1,506 | 3.51 | ||||
| 2026-02-05 | 13F | Tucker Asset Management Llc | 43 | 2 | ||||||
| 2026-02-10 | 13F | CIBC World Markets Inc. | 8,564,134 | 8.59 | 445,335 | 11.35 | ||||
| 2026-02-17 | 13F | D. E. Shaw & Co., Inc. | 246,462 | -37.67 | 12,810 | -36.13 | ||||
| 2026-02-06 | 13F | Harvest Portfolios Group Inc. | 85,867 | 5.93 | 4,464 | 8.59 | ||||
| 2026-02-13 | 13F | Candriam Luxembourg S.C.A. | 6,773 | 0.00 | 353 | 2.62 | ||||
| 2026-02-10 | 13F | CIBC Asset Management Inc | 2,655,787 | -8.20 | 138,443 | -5.74 | ||||
| 2026-02-17 | 13F | Toronto Dominion Bank | 3,806,142 | -29.34 | 197,894 | -27.50 | ||||
| 2026-02-17 | 13F | Toronto Dominion Bank | Put | 171,000 | 3.89 | 8,891 | 6.51 | |||
| 2026-02-17 | 13F | Toronto Dominion Bank | Call | 243,500 | -57.86 | 12,660 | -56.80 | |||
| 2026-01-27 | 13F | Lorne Steinberg Wealth Management Inc. | 5,779 | 301 | ||||||
| 2026-02-13 | 13F | Barclays Plc | 80,809 | 416.45 | 4,197 | 429.26 | ||||
| 2026-02-19 | 13F | Invesco Ltd. | 1,314,274 | 1.57 | 68,263 | 3.97 | ||||
| 2026-02-17 | 13F | Twinbeech Capital Lp | 0 | -100.00 | 0 | |||||
| 2026-04-09 | 13F | Pacifica Partners Inc. | 9,486 | -1.04 | 528 | 6.45 | ||||
| 2026-01-30 | 13F/A | M&t Bank Corp | 9,498 | 1.05 | 493 | 3.57 | ||||
| 2026-02-12 | 13F | Jane Street Group, Llc | 82,242 | -34.10 | 4,272 | -32.54 | ||||
| 2026-02-13 | 13F | Kilter Group LLC | 7 | 75.00 | 0 | |||||
| 2026-02-13 | 13F | Great West Life Assurance Co /can/ | 591,059 | -1.65 | 31 | 0.00 | ||||
| 2026-02-13 | 13F | Citigroup Inc | 360,376 | 14.89 | 18,761 | 17.90 | ||||
| 2026-02-17 | 13F | Lazard Asset Management Llc | 22,391 | -7.73 | 1,164 | -5.37 | ||||
| 2026-04-24 | 13F | Mitchell & Pahl Private Wealth, Llc | 18,046 | 3.04 | 1,007 | 10.67 | ||||
| 2026-02-13 | 13F | JustInvest LLC | 6,198 | -15.49 | 322 | -13.71 | ||||
| 2026-02-13 | 13F/A | Ontario Teachers Pension Plan Board | 0 | -100.00 | 0 | -100.00 | ||||
| 2026-02-13 | 13F | Bank Of Nova Scotia | 4,405,195 | -12.52 | 229,024 | -10.33 | ||||
| 2026-02-12 | 13F | Grey Fox Wealth Advisors, LLC | 0 | -100.00 | 0 | |||||
| 2026-04-21 | 13F | Value Partners Investments Inc. | 98,796 | -12.60 | 5,501 | -6.54 | ||||
| 2026-02-17 | 13F | Tower Research Capital LLC (TRC) | 997 | -90.43 | 52 | -90.34 | ||||
| 2026-04-07 | 13F | Mb, Levis & Associates, Llc | 77 | 0.00 | 4 | 33.33 | ||||
| 2026-04-21 | 13F | Financial Consulate, Inc | 84 | 600.00 | 5 | |||||
| 2026-01-23 | 13F | LOM Asset Management Ltd | 835 | 60 | ||||||
| 2026-01-23 | 13F | Westside Investment Management, Inc. | 345 | 0.00 | 18 | 0.00 | ||||
| 2026-02-04 | 13F | Swiss Life Asset Management Ltd | 69,944 | 8.82 | 3,636 | 11.37 | ||||
| 2026-03-03 | 13F/A | Caitong International Asset Management Co., Ltd | 2,197 | 85.40 | 114 | 90.00 | ||||
| 2026-02-06 | 13F | ProShare Advisors LLC | 57,233 | 5.42 | 2,976 | 8.06 | ||||
| 2026-02-11 | 13F | Simplex Trading, Llc | Call | 600 | -40.00 | 31 | ||||
| 2026-02-13 | 13F | First Trust Advisors Lp | 880,443 | -2.00 | 45,739 | 0.34 | ||||
| 2026-01-26 | 13F | Private Trust Co Na | 330 | -23.08 | 17 | -19.05 | ||||
| 2026-01-29 | 13F | Richard C. Young & CO., LTD. | 134,237 | -2.62 | 6,972 | -0.31 | ||||
| 2025-11-07 | 13F | Shell Asset Management Co | 45,623 | -38.37 | 2 | -33.33 | ||||
| 2026-02-17 | 13F | Guardian Partners Inc. | 307,660 | 2.41 | 16,638 | 9.63 | ||||
| 2025-10-30 | 13F | Ridgewood Investments LLC | 0 | -100.00 | 0 | -100.00 | ||||
| 2026-04-21 | 13F | Vise Technologies, Inc. | 19,842 | 0.00 | 1,031 | 0.00 | ||||
| 2026-02-06 | 13F | Newport Trust Co | 9,909 | 1.80 | 515 | 4.26 | ||||
| 2026-02-11 | 13F | Group One Trading, L.p. | 0 | -100.00 | 0 | -100.00 | ||||
| 2026-04-22 | 13F | Viewpoint Investment Partners Corp | 10,247 | 537 | ||||||
| 2026-01-27 | 13F | Evergreen Capital Management Llc | 6,398 | -5.99 | 332 | -3.77 | ||||
| 2026-01-29 | 13F | Copeland Capital Management, LLC | 57 | 0.00 | 3 | 0.00 | ||||
| 2026-02-17 | 13F | Wellington Management Group Llp | 0 | -100.00 | 0 | |||||
| 2026-02-10 | 13F | Quantbot Technologies LP | 0 | -100.00 | 0 | |||||
| 2026-01-20 | 13F | Cromwell Holdings LLC | 1,850 | 0.71 | 96 | 3.23 | ||||
| 2026-02-17 | 13F | Susquehanna International Group, Llp | 8,661 | 37.26 | 450 | 40.31 | ||||
| 2025-11-10 | 13F | Clear Creek Financial Management, LLC | 0 | -100.00 | 0 | -100.00 | ||||
| 2026-02-17 | 13F | Voloridge Investment Management, Llc | 0 | -100.00 | 0 | |||||
| 2026-02-13 | 13F | Squarepoint Ops LLC | 0 | -100.00 | 0 | |||||
| 2026-04-22 | 13F | Stone House Investment Management, LLC | 14 | 0.00 | 1 | |||||
| 2026-02-06 | 13F | Larson Financial Group LLC | 1,343 | 81.73 | 70 | 86.49 | ||||
| 2026-02-13 | 13F | BNP Paribas Asset Management Holding S.A. | 49,413 | 4 | ||||||
| 2026-04-21 | 13F | Hennessy Advisors Inc | 94,176 | 0.00 | 5,254 | 7.42 | ||||
| 2026-02-10 | 13F | Gulf International Bank (UK) Ltd | 24,578 | 0.17 | 1 | 0.00 | ||||
| 2026-04-22 | 13F | Pictet Asset Management Holding SA | 291,583 | -1.78 | 16,216 | 4.93 | ||||
| 2026-04-08 | 13F | Community Financial Services Group, LLC | 1,727 | 97 | ||||||
| 2026-02-11 | 13F | Allianz Asset Management GmbH | 7,919 | -72.84 | 412 | -72.12 | ||||
| 2026-01-21 | 13F | Newbridge Financial Services Group, Inc. | 400 | 21 | ||||||
| 2026-02-17 | 13F | Creative Planning | 205,655 | 97.13 | 10,682 | 101.79 | ||||
| 2026-02-24 | 13F | DGS Capital Management, LLC | 49,334 | 6.52 | 2,562 | 9.02 | ||||
| 2026-02-13 | 13F | Sienna Gestion | 0 | -100.00 | 0 | |||||
| 2026-02-17 | 13F | Advisor Group Holdings, Inc. | 6,373 | 11.12 | 331 | 14.53 | ||||
| 2026-02-17 | 13F | Advisory Services Network, LLC | 5,002 | 35.67 | 260 | 38.50 | ||||
| 2026-02-12 | 13F | Steward Partners Investment Advisory, Llc | 295 | 0.00 | 15 | 7.14 | ||||
| 2026-04-23 | 13F | Lansforsakringar Fondforvaltning AB (publ) | 115,172 | 1.82 | 6,405 | 8.76 | ||||
| 2026-02-12 | 13F | UniSuper Management Pty Ltd | 10,100 | 18.82 | 721 | 20.00 | ||||
| 2026-01-23 | 13F | Assetmark, Inc | 114 | 0.00 | 6 | 0.00 | ||||
| 2026-01-29 | 13F | Washington Capital Management Inc | 18,740 | -0.40 | 973 | 1.99 | ||||
| 2026-02-13 | 13F | Aigen Investment Management, Lp | 18,890 | 1,146 | ||||||
| 2026-04-13 | 13F | Mather Group, Llc. | 25 | 1 | ||||||
| 2026-02-11 | 13F | Letko, Brosseau & Associates Inc | 7,900 | 0.00 | 411 | 2.75 | ||||
| 2026-02-11 | 13F | West Family Investments, Inc. | 5,219 | -4.12 | 271 | -1.81 | ||||
| 2026-02-13 | 13F | SRS Capital Advisors, Inc. | 957 | -75.07 | 50 | -74.74 | ||||
| 2025-11-13 | 13F | Glenmede Investment Management, LP | 11,878 | 0.00 | 603 | 6.36 | ||||
| 2026-02-18 | 13F | Guardian Capital Lp | 737,570 | 3.62 | 38,365 | 6.24 | ||||
| 2026-04-20 | 13F | Ritholtz Wealth Management | 6,821 | 381 | ||||||
| 2026-02-18 | 13F | Vident Advisory, LLC | 15,822 | -13.01 | 822 | -10.95 | ||||
| 2025-12-18 | 13F | Danske Bank A/s | 0 | -100.00 | 0 | |||||
| 2026-02-10 | 13F | Forsta Ap-fonden | 139,700 | -6.05 | 7,273 | -3.61 | ||||
| 2026-02-13 | 13F | Mariner, LLC | 39,564 | 14.24 | 2,055 | 16.96 | ||||
| 2026-04-22 | 13F | Canoe Financial LP | 6,919 | -8.91 | 386 | -2.28 | ||||
| 2026-02-13 | 13F | Beutel, Goodman & Co Ltd. | 4,319,468 | -36.68 | 225 | -35.26 | ||||
| 2026-02-11 | 13F | Fiera Capital Corp | 838,298 | -10.51 | 43,598 | -8.21 | ||||
| 2026-02-13 | 13F | Public Sector Pension Investment Board | 0 | -100.00 | 0 | |||||
| 2026-02-13 | 13F | Arrowstreet Capital, Limited Partnership | 682,972 | -52.71 | 35,502 | -51.53 | ||||
| 2026-04-20 | 13F | Assenagon Asset Management S.A. | 19,052 | -98.07 | 1,060 | -97.93 | ||||
| 2026-04-22 | 13F | Gold Investment Management Ltd. | 81,445 | 1.93 | 4,539 | 9.27 | ||||
| 2026-02-13 | 13F | Verition Fund Management LLC | 67,855 | 3,524 | ||||||
| 2026-02-17 | 13F | Ewing Morris & Co. Investment Partners Ltd. | 64,408 | 0.22 | 3,394 | 4.11 | ||||
| 2026-01-26 | 13F | Cwm, Llc | 371 | 0.00 | 0 | |||||
| 2026-02-17 | 13F | Graham Capital Management, L.P. | 33,914 | 1,761 | ||||||
| 2026-02-13 | 13F | National Bank Of Canada /fi/ | Call | 4,673 | -5.19 | 24,293 | -2.84 | |||
| 2026-02-06 | 13F | GPS Wealth Strategies Group, LLC | 0 | -100.00 | 0 | |||||
| 2026-04-21 | 13F | Nemes Rush Group LLC | 102 | 0.99 | 6 | 0.00 | ||||
| 2026-02-10 | 13F | Savant Capital, LLC | 24,317 | 4.31 | 1,263 | 6.85 | ||||
| 2026-04-13 | 13F | Trust Co | 13 | 0.00 | 1 | |||||
| 2026-02-17 | 13F | Cetera Investment Advisers | 23,240 | 5.30 | 1,207 | 7.86 | ||||
| 2026-02-13 | 13F | National Bank Of Canada /fi/ | Put | 291 | -7.91 | 1,513 | -5.62 | |||
| 2026-01-29 | 13F | Dunhill Financial, LLC | 318 | 0.00 | 17 | 0.00 | ||||
| 2026-02-17 | 13F | Millennium Management Llc | 0 | -100.00 | 0 | |||||
| 2026-01-30 | 13F | Us Bancorp \de\ | 19,231 | 4.69 | 999 | 7.08 | ||||
| 2026-02-06 | 13F | EverSource Wealth Advisors, LLC | 3,303 | -0.42 | 172 | 1.79 | ||||
| 2026-02-17 | 13F | Nearwater Capital Markets, Ltd | 0 | -100.00 | 0 | |||||
| 2026-02-17 | 13F | Trexquant Investment LP | 117,951 | 61.82 | 6,126 | 65.66 | ||||
| 2026-04-14 | 13F | American State Bank (Iowa) | 0 | -100.00 | 0 | |||||
| 2026-02-12 | 13F | Renaissance Technologies Llc | 658,952 | -35.19 | 34,226 | -33.66 | ||||
| 2026-01-15 | 13F | J. Safra Sarasin Holding AG | 6,784 | 35.33 | 353 | 38.98 | ||||
| 2026-01-28 | 13F | Davis-rea Ltd. | 165,411 | 1.75 | 8,605 | 4.29 | ||||
| 2026-04-20 | 13F | Miller Howard Investments Inc /ny | 24,613 | 7.58 | 1,373 | 15.57 | ||||
| 2026-04-24 | 13F | Root Financial Partners, LLC | 24 | 50.00 | 1 | |||||
| 2026-02-13 | 13F | Neuberger Berman Group LLC | 123,901 | 4.01 | 6,450 | 6.74 | ||||
| 2026-01-16 | 13F | Ronald Blue Trust, Inc. | 0 | -100.00 | 0 | |||||
| 2026-04-22 | 13F | QV Investors Inc. | 853,037 | -5.19 | 47 | 2.17 | ||||
| 2026-02-04 | 13F | Beverly Hills Private Wealth, LLC | 7,394 | 0.00 | 375 | 0.00 | ||||
| 2026-02-05 | 13F | Gabelli Funds Llc | 166,150 | -0.48 | 8,649 | 2.10 | ||||
| 2026-04-06 | 13F | Versant Capital Management, Inc | 10,609 | 9.03 | 592 | 17.03 | ||||
| 2026-02-05 | 13F | AlphaCore Capital LLC | 7,387 | -6.38 | 384 | -4.25 | ||||
| 2026-02-17 | 13F | Ninepoint Partners LP | 59,008 | -1.15 | 3,065 | 1.19 | ||||
| 2026-02-17 | 13F | Northern Trust Corp | 293,571 | -25.49 | 15,248 | -23.73 | ||||
| 2026-02-17 | 13F | Investment Management Corp of Ontario | 61,954 | 232.98 | 3,218 | 240.78 | ||||
| 2026-03-18 | 13F | Employees Provident Fund Board | 0 | -100.00 | 0 | |||||
| 2026-02-17 | 13F | Brevan Howard Capital Management LP | 0 | -100.00 | 0 | |||||
| 2026-04-21 | 13F | Venturi Wealth Management, LLC | 5,155 | 288 | ||||||
| 2026-02-10 | 13F | Envestnet Asset Management Inc | 141,751 | -6.07 | 7,363 | -3.85 | ||||
| 2026-02-05 | 13F | Cambridge Investment Research Advisors, Inc. | 6,852 | 1.56 | 0 | |||||
| 2026-02-17 | 13F | Aqr Capital Management Llc | 211,926 | 599.59 | 11,016 | 616.72 | ||||
| 2026-02-13 | 13F | Stifel Financial Corp | 45,088 | 1.14 | 2,342 | 3.49 | ||||
| 2026-02-13 | 13F | Baird Financial Group, Inc. | 36,987 | 8.01 | 1,921 | 10.59 | ||||
| 2026-02-13 | 13F | Van Eck Associates Corp | 197,441 | 7.73 | 10 | 11.11 | ||||
| 2026-02-05 | 13F | Allworth Financial LP | 1,154 | -11.84 | 60 | -10.61 | ||||
| 2026-02-17 | 13F | Balyasny Asset Management Llc | 125,117 | -24.13 | 6,499 | -22.34 | ||||
| 2026-02-12 | 13F | Bank Of Nova Scotia Trust Co | 391,593 | -1.54 | 20,339 | 0.79 | ||||
| 2026-02-11 | 13F | Deutsche Bank Ag\ | 984,532 | 0.07 | 51,137 | 2.44 | ||||
| 2026-02-02 | 13F | Intact Investment Management Inc. | 921,744 | -2.46 | 47,920 | -0.04 | ||||
| 2026-02-04 | 13F | Kepler Cheuvreux (Suisse) SA | 0 | -100.00 | 0 | |||||
| 2026-02-04 | 13F | Mascoma Wealth Management LLC | 91 | 0.00 | 5 | 0.00 | ||||
| 2026-04-13 | 13F | Baskin Financial Services Inc. | 6,089 | -18.26 | 0 | |||||
| 2026-01-29 | 13F | Vanguard Group Inc | 24,129,958 | 2.27 | 1,254,541 | 4.83 | ||||
| 2026-02-09 | 13F | Huntington National Bank | 3,021 | 0.00 | 157 | 1.96 | ||||
| 2026-02-12 | 13F | Federation des caisses Desjardins du Quebec | 1,315,586 | 0.55 | 68,375 | 3.64 | ||||
| 2026-02-11 | 13F | Tacita Capital Inc | 57,596 | 1.27 | 2,996 | 3.81 | ||||
| 2026-02-06 | 13F | Bare Financial Services, Inc | 111 | 0.00 | 6 | 0.00 | ||||
| 2026-04-07 | 13F | Signaturefd, Llc | 37,839 | 0.74 | 2,111 | 8.26 | ||||
| 2026-02-10 | 13F | Godfrey Financial Associates, Inc. | 16 | 1 | ||||||
| 2026-02-12 | 13F | Brown Brothers Harriman & Co | 253 | 488.37 | 13 | 550.00 | ||||
| 2026-02-13 | 13F | Kestra Advisory Services, LLC | 2,277 | 118 | ||||||
| 2026-02-13 | 13F | MAI Capital Management | 1,370 | -26.07 | 71 | -24.47 | ||||
| 2026-02-17 | 13F | Private Advisor Group, LLC | 18,129 | -0.26 | 942 | 2.06 | ||||
| 2026-02-13 | 13F | Natixis | 26,499 | 38.72 | 1,376 | 42.00 | ||||
| 2026-04-24 | 13F | Ninety One UK Ltd | 93,518 | -26.83 | 5,201 | -21.84 | ||||
| 2026-02-13 | 13F | Rhumbline Advisers | 12,470 | -11.65 | 648 | -9.64 | ||||
| 2026-02-17 | 13F | Utah Retirement Systems | 55,938 | 0.00 | 2,912 | 2.64 | ||||
| 2026-02-19 | 13F | Atomi Financial Group, Inc. | 5,247 | 15.67 | 273 | 18.26 | ||||
| 2026-02-12 | 13F | Quadrant Capital Group Llc | 3,009 | 1.28 | 156 | 4.00 | ||||
| 2026-02-17 | 13F | BCV Asset Management Inc. | 104,845 | 7,755 | ||||||
| 2026-02-17 | 13F | Laird Norton Trust Company, Llc | 11,897 | 618 | ||||||
| 2026-04-10 | 13F | Country Trust Bank | 0 | -100.00 | 0 | |||||
| 2026-02-17 | 13F | Ameriprise Financial Inc | 16,244 | -1.25 | 984 | 0.61 | ||||
| 2026-02-17 | 13F | Millennium Management Llc | Put | 25,000 | 0.00 | 1,784 | 1.13 | |||
| 2026-02-14 | 13F | Rockefeller Capital Management L.P. | 2,082 | 0.53 | 108 | 2.86 | ||||
| 2026-02-17 | 13F | Mercer Global Advisors Inc /adv | 9,995 | 11.60 | 519 | 14.32 | ||||
| 2026-02-09 | 13F | Harbour Investments, Inc. | 339 | 0.00 | 18 | 0.00 | ||||
| 2026-02-13 | 13F | Ubs Asset Management Americas Inc | 651 | 34 | ||||||
| 2026-02-13 | 13F | Alberta Investment Management Corp | 100,300 | 5,215 | ||||||
| 2026-02-05 | 13F | John G Ullman & Associates Inc | 3,900 | 203 | ||||||
| 2026-02-17 | 13F | FIL Ltd | 19,898,613 | 9.14 | 1,034,545 | 11.87 | ||||
| 2026-02-17 | 13F | Silvercrest Asset Management Group Llc | 6,182 | 0.00 | 321 | 2.56 | ||||
| 2026-04-13 | 13F | True Wealth Design, LLC | 300 | 114.29 | 17 | 128.57 | ||||
| 2026-04-15 | 13F | Trust Co Of Toledo Na /oh/ | 597 | 0.00 | 33 | 6.45 | ||||
| 2026-02-05 | 13F | Bessemer Group Inc | 621 | 31.57 | 0 | |||||
| 2026-02-12 | 13F | Swiss National Bank | 1,334,782 | -7.51 | 69,538 | -5.04 | ||||
| 2026-02-17 | 13F | PDT Partners, LLC | 11,600 | 0.00 | 603 | 2.38 | ||||
| 2026-02-10 | 13F/A | Northwestern Mutual Wealth Management Co | 10,410 | 131.44 | 541 | 136.84 | ||||
| 2026-02-12 | 13F | APG Asset Management N.V. | 255,797 | -6.92 | 11,338 | -4.44 | ||||
| 2026-02-11 | 13F | Westerkirk Capital Inc. | 1,410 | -93.32 | 73 | -93.18 | ||||
| 2026-04-14 | 13F | Nbc Securities, Inc. | 1,048 | -3.14 | 58 | 3.57 | ||||
| 2026-02-13 | 13F | Healthcare Of Ontario Pension Plan Trust Fund | 146,000 | 0.00 | 7,591 | 2.54 | ||||
| 2026-03-20 | 13F/A | Hsbc Holdings Plc | 0 | -100.00 | 0 | -100.00 | ||||
| 2026-01-29 | 13F | Concord Wealth Partners | 300 | 0.00 | 16 | 0.00 | ||||
| 2026-02-06 | 13F | HighTower Advisors, LLC | 4,220 | 219 | ||||||
| 2026-02-09 | 13F | Legal & General Group Plc | 5,954,579 | 1.55 | 309,966 | 4.19 | ||||
| 2026-04-13 | 13F | IFP Advisors, Inc | 70 | 0.00 | 4 | 0.00 | ||||
| 2025-11-14 | 13F | Cubist Systematic Strategies, LLC | 7,868 | 399 | ||||||
| 2025-11-14 | 13F | SIG North Trading, ULC | 0 | -100.00 | 0 | -100.00 | ||||
| 2026-02-10 | 13F | State of Wyoming | 0 | -100.00 | 0 | |||||
| 2026-04-20 | 13F | Cardinal Point Capital Management, ULC | 10,615 | 0.13 | 591 | 7.26 | ||||
| 2026-02-12 | 13F | Bank Of Montreal /can/ | Put | 3,800 | -19.15 | 198 | -17.23 | |||
| 2026-02-12 | 13F | Bank Of Montreal /can/ | Call | 240,000 | 8,471.43 | 12,478 | 8,749.65 | |||
| 2026-02-12 | 13F | Bank Of Montreal /can/ | 24,521,460 | 6.01 | 1,274,917 | 8.69 | ||||
| 2026-02-17 | 13F | Quadrature Capital Ltd | 314,801 | 16,387 | ||||||
| 2026-02-13 | 13F | Dixon Mitchell Investment Counsel Inc. | 2,640 | 137 | ||||||
| 2026-02-18 | 13F | Mackenzie Financial Corp | 3,343,961 | 4.55 | 173,752 | 7.12 | ||||
| 2026-02-13 | 13F | Ieq Capital, Llc | 8,921 | 8.71 | 463 | 11.30 | ||||
| 2026-02-17 | 13F | Wiley Bros.-aintree Capital, Llc | 9,092 | 7.29 | 472 | 10.02 | ||||
| 2025-11-12 | 13F | Group One Trading, L.p. | Call | 0 | -100.00 | 0 | -100.00 | |||
| 2026-02-13 | 13F | Mml Investors Services, Llc | 17,545 | -4.59 | 911 | -2.36 | ||||
| 2026-04-10 | 13F | Pure Financial Advisors, Inc. | 4,542 | 253 | ||||||
| 2026-02-13 | 13F | BRITISH COLUMBIA INVESTMENT MANAGEMENT Corp | 264,928 | -8.59 | 13,774 | -6.28 | ||||
| 2026-01-14 | 13F | Eastern Bank | 0 | -100.00 | 0 | |||||
| 2026-02-06 | 13F | Global Retirement Partners, LLC | 50 | -98.00 | 3 | -98.41 | ||||
| 2026-04-08 | 13F | Wealth Enhancement Advisory Services, Llc | 4,263 | 242 | ||||||
| 2026-02-10 | 13F | Intech Investment Management Llc | 13,693 | 58.54 | 713 | 62.56 | ||||
| 2026-02-13 | 13F | Bollard Group LLC | 149,996 | -12.67 | 8 | -12.50 | ||||
| 2026-02-23 | 13F | Mv Capital Management, Inc. | 5 | 0 | ||||||
| 2026-02-17 | 13F | Canada Pension Plan Investment Board | 2,441,148 | -9.10 | 126,920 | -6.80 | ||||
| 2026-04-06 | 13F | GAMMA Investing LLC | 416 | 0.00 | 23 | 9.52 | ||||
| 2026-02-10 | 13F | Hillsdale Investment Management Inc. | 783,178 | -3.69 | 40,791 | -1.08 | ||||
| 2026-04-17 | 13F | Ignite Planners, LLC | 7,832 | -2.19 | 435 | 1.87 | ||||
| 2026-02-02 | 13F | Truist Financial Corp | 14,757 | -6.13 | 766 | -3.89 | ||||
| 2026-02-12 | 13F | Campbell & CO Investment Adviser LLC | 0 | -100.00 | 0 | |||||
| 2026-04-17 | 13F | AdvisorNet Financial, Inc | 0 | -100.00 | 0 | |||||
| 2026-02-11 | 13F | Franklin Resources Inc | 811,632 | 2.43 | 42,198 | 5.02 | ||||
| 2026-04-21 | 13F | Aaron Wealth Advisors LLC | 8,960 | 500 | ||||||
| 2026-02-17 | 13F | Captrust Financial Advisors | 6,426 | 0.94 | 334 | 3.10 | ||||
| 2025-11-21 | 13F/A | Royal Bank Of Canada | Call | 0 | -100.00 | 0 | -100.00 | |||
| 2026-04-15 | 13F | Compagnie Lombard Odier SCmA | 1,488 | 0.00 | 83 | 6.49 | ||||
| 2026-01-15 | 13F | Mn Services Vermogensbeheer B.V. | 193,104 | 2.99 | 10 | 11.11 | ||||
| 2026-02-17 | 13F | Credit Agricole S A | 12,069 | 4.80 | 627 | 7.19 | ||||
| 2026-02-13 | 13F | Golden State Wealth Management, LLC | 919 | 0.55 | 48 | 2.17 | ||||
| 2026-01-27 | 13F | Zurcher Kantonalbank (Zurich Cantonalbank) | 175,760 | 40.46 | 9,150 | 44.12 | ||||
| 2026-02-06 | 13F | Pnc Financial Services Group, Inc. | 2,813 | 54.90 | 146 | 58.70 | ||||
| 2026-02-03 | 13F | SBI Securities Co., Ltd. | 36 | 0.00 | 2 | 0.00 | ||||
| 2026-02-12 | 13F | Scotia Capital Inc. | 9,372,669 | 2.28 | 486,866 | 5.44 | ||||
| 2026-02-17 | 13F | Russell Investments Group, Ltd. | 193,754 | 10.39 | 10,083 | 13.45 | ||||
| 2025-10-30 | 13F | Twin Peaks Wealth Advisors, LLC | 0 | -100.00 | 0 | -100.00 | ||||
| 2026-02-13 | 13F | Woodbridge CO LTD | 601,750 | 0.00 | 31,255 | 2.36 | ||||
| 2025-11-14 | 13F | Atom Investors LP | 0 | -100.00 | 0 | -100.00 | ||||
| 2025-11-12 | 13F | NewSquare Capital LLC | 0 | -100.00 | 0 | -100.00 | ||||
| 2026-04-13 | 13F | Creative Financial Designs Inc /adv | 2,382 | -21.41 | 133 | -15.92 | ||||
| 2026-02-09 | 13F | Geode Capital Management, Llc | 6,593,417 | 5.99 | 357,381 | 9.20 | ||||
| 2026-02-11 | 13F | CoreFirst Bank & Trust | 0 | -100.00 | 0 | |||||
| 2026-02-13 | 13F | American Century Companies Inc | 133,156 | 18.73 | 6,923 | 21.69 | ||||
| 2026-02-13 | 13F | National Bank Of Canada /fi/ | 7,340,045 | 4.86 | 380,973 | 7.69 | ||||
| 2026-04-17 | 13F | Cache Advisors, LLC | 147 | 11 | ||||||
| 2026-01-15 | 13F | Bernard Wealth Management Corp. | 195 | 0.00 | 10 | 11.11 | ||||
| 2026-04-17 | 13F | Brown, Lisle/cummings, Inc. | 10 | 1 | ||||||
| 2026-02-11 | 13F | Capital World Investors | 41,721 | 23.49 | 2,169 | 26.62 | ||||
| 2026-02-09 | 13F | Kingsview Wealth Management, LLC | 4,954 | 7.58 | 257 | 10.30 | ||||
| 2026-02-17 | 13F | Raymond James Financial Inc | 40,358 | -4.12 | 2,096 | -1.83 | ||||
| 2026-02-13 | 13F | Parkside Financial Bank & Trust | 117 | 67.14 | 6 | 100.00 | ||||
| 2026-02-11 | 13F | Coleford Investment Management Ltd. | 206,705 | -0.41 | 10,753 | 2.26 | ||||
| 2026-02-13 | 13F | Kayne Anderson Rudnick Investment Management Llc | 807,749 | -3.12 | 41,955 | -0.83 | ||||
| 2026-02-17 | 13F | Citadel Advisors Llc | 346,192 | 281.37 | 17,981 | 290.47 | ||||
| 2026-02-17 | 13F | Optiver Holding B.V. | 0 | -100.00 | 0 | |||||
| 2026-02-02 | 13F | Benjamin Edwards Inc | 5,153 | 6.93 | 268 | 9.43 | ||||
| 2026-02-12 | 13F | Commonwealth Equity Services, Llc | 11,331 | 4.98 | 589 | |||||
| 2026-02-13 | 13F | Marshall Wace, Llp | 31,590 | 1,641 | ||||||
| 2026-02-03 | 13F | Strengthening Families & Communities, LLC | 0 | -100.00 | 0 | |||||
| 2026-02-11 | 13F | Cerity Partners LLC | 10,315 | -3.89 | 536 | -1.65 | ||||
| 2026-02-10 | 13F | Bank of New York Mellon Corp | 560,021 | -1.58 | 29,088 | 0.75 | ||||
| 2026-02-12 | 13F | Penserra Capital Management LLC | 30 | 0.00 | 0 | |||||
| 2026-02-02 | 13F | Addison Capital Co | 32,508 | -11.20 | 1,688 | -9.10 | ||||
| 2026-02-17 | 13F | Citadel Advisors Llc | Call | 0 | -100.00 | 0 | ||||
| 2026-02-13 | 13F | Charles Schwab Investment Management Inc | 1,447,016 | 1.60 | 75,330 | 4.26 | ||||
| 2026-01-22 | 13F | Bartlett & Co. Wealth Management Llc | 94 | 0.00 | 5 | 0.00 | ||||
| 2026-02-06 | 13F | Cumberland Partners Ltd | 19,400 | 0.26 | 1,010 | 2.85 | ||||
| 2026-02-17 | 13F | Point72 Asset Management, L.P. | 0 | -100.00 | 0 | -100.00 | ||||
| 2026-02-17 | 13F | Sciencast Management LP | 13,082 | 679 | ||||||
| 2026-02-05 | 13F | Td Private Client Wealth Llc | 6 | 0 | ||||||
| 2025-11-06 | 13F | Versor Investments LP | 0 | -100.00 | 0 | -100.00 | ||||
| 2025-11-14 | 13F | Wetherby Asset Management Inc | 11,284 | -6.13 | 573 | -0.17 | ||||
| 2026-04-17 | 13F | Weaver Capital Management LLC | 4,368 | -4.67 | 244 | 2.53 | ||||
| 2026-04-20 | 13F | Hilton Head Capital Partners, LLC | 30 | 0.00 | 2 | 0.00 | ||||
| 2026-01-27 | 13F | WealthCollab, LLC | 260 | -9.41 | 14 | -7.14 | ||||
| 2025-11-14 | 13F/A | Skopos Labs, Inc. | 0 | -100.00 | 0 | -100.00 | ||||
| 2026-02-13 | 13F | 1832 Asset Management L.P. | 8,408,188 | -0.69 | 436,721 | 1.66 | ||||
| 2026-04-22 | 13F | Caledonia Investments Plc | 410,000 | -10.23 | 22,784 | -4.09 | ||||
| 2026-02-12 | 13F | Alps Advisors Inc | 22,692 | 27.78 | 1,179 | 30.74 | ||||
| 2026-02-17 | 13F | Qube Research & Technologies Ltd | 44,835 | -78.75 | 2,331 | -78.23 | ||||
| 2026-02-10 | 13F | Connor, Clark & Lunn Investment Management Ltd. | 4,240,412 | 14.37 | 220,461 | 17.26 | ||||
| 2026-02-17 | 13F | Ancora Advisors, LLC | 26 | 1 | ||||||
| 2026-02-11 | 13F | Clearbridge Investments, LLC | 2,128,320 | -2.93 | 110,545 | -0.64 | ||||
| 2026-02-13 | 13F | Royal London Asset Management Ltd | 27,063 | 7.02 | 1,406 | 9.51 | ||||
| 2025-11-04 | 13F | Frank, Rimerman Advisors LLC | 0 | -100.00 | 0 | -100.00 | ||||
| 2026-01-20 | 13F | Cigna Investments Inc /new | 8,970 | 0.00 | 0 | |||||
| 2026-02-17 | 13F | Magnetar Financial LLC | 0 | -100.00 | 0 | |||||
| 2026-02-17 | 13F | Engineers Gate Manager LP | 0 | -100.00 | 0 | |||||
| 2026-02-18 | 13F | GWM Advisors LLC | 1,283 | 0.08 | 67 | 1.54 | ||||
| 2026-02-10 | 13F | Goldman Sachs Group Inc | 4,871,309 | -5.76 | 253,016 | -3.53 | ||||
| 2026-02-03 | 13F | Sequoia Financial Advisors, LLC | 21,836 | 27.98 | 1,134 | 31.10 | ||||
| 2026-02-02 | 13F | Cornerstone Planning Group LLC | 121 | 47.56 | 6 | 50.00 | ||||
| 2026-02-13 | 13F | Korea Investment CORP | 383,165 | -5.00 | 19,947 | -2.52 | ||||
| 2026-04-22 | 13F | Spire Wealth Management | 99 | 0.00 | 6 | 0.00 | ||||
| 2026-01-27 | 13F | TD Waterhouse Canada Inc. | 5,138,553 | 4.14 | 266,942 | 7.24 | ||||
| 2026-02-12 | 13F | Federated Hermes, Inc. | 179,005 | -1.63 | 9,298 | 0.70 | ||||
| 2026-02-10 | 13F | One Capital Management, LLC | 4,538 | 236 | ||||||
| 2026-02-13 | 13F | Gen-Wealth Partners Inc | 32 | 0.00 | 2 | 0.00 | ||||
| 2026-02-17 | 13F | Susquehanna International Group, Llp | Put | 0 | -100.00 | 0 | ||||
| 2026-02-10 | 13F | Td Asset Management Inc | 13,523,672 | -0.06 | 704,030 | 2.55 | ||||
| 2026-02-12 | 13F | Dimensional Fund Advisors Lp | 678,764 | 3.28 | 35,256 | 5.73 | ||||
| 2026-04-07 | 13F | CoreCap Advisors, LLC | 305 | 72.32 | 17 | 88.89 | ||||
| 2026-01-30 | 13F | Mitsubishi UFJ Trust & Banking Corp | 0 | -100.00 | 0 | |||||
| 2026-02-17 | 13F | Blair William & Co/il | 5,443 | 0.00 | 283 | 2.17 | ||||
| 2026-02-10 | 13F | Natixis Advisors, L.p. | 67,765 | 2.43 | 4 | 0.00 | ||||
| 2026-02-17 | 13F | Fmr Llc | 68,628 | -1.33 | 3,568 | 1.16 | ||||
| 2026-02-12 | 13F | Hrt Financial Lp | 7,617 | 32.52 | 0 | |||||
| 2026-02-13 | 13F | Mufg Securities (canada), Ltd. | 769,632 | -7.64 | 40,023 | -5.30 | ||||
| 2026-04-07 | 13F | Farther Finance Advisors, LLC | 1,377 | 0.58 | 77 | 8.45 | ||||
| 2026-02-17 | 13F | Royal Bank Of Canada | Put | 1,500,000 | 0.00 | 77,910 | 2.36 | |||
| 2026-02-11 | 13F | LPL Financial LLC | 60,140 | 0.94 | 3,124 | 3.31 | ||||
| 2025-11-07 | 13F | Sierra Ocean, Llc | 0 | -100.00 | 0 | -100.00 | ||||
| 2026-02-17 | 13F | Alliancebernstein L.p. | 48,194 | 0.37 | 2,503 | 2.75 | ||||
| 2026-01-23 | 13F | Baillie Gifford & Co | 265,404 | -15.87 | 13,817 | -13.67 | ||||
| 2026-02-17 | 13F | Two Sigma Advisers, Lp | 479,419 | 82.00 | 24,901 | 86.32 | ||||
| 2026-04-22 | 13F | Louisbourg Investments Inc. | 19,054 | -57.78 | 1,061 | -54.87 | ||||
| 2025-11-07 | 13F | Fifth Third Bancorp | 0 | -100.00 | 0 | -100.00 | ||||
| 2026-02-13 | 13F | Pathstone Holdings, LLC | 10,901 | 7.17 | 566 | 9.69 | ||||
| 2026-02-10 | 13F | Basepoint Wealth LLC | 97 | 5 | ||||||
| 2026-02-13 | 13F | Manufacturers Life Insurance Company, The | 0 | -100.00 | 0 | |||||
| 2026-02-05 | 13F | 1620 Investment Advisors, Inc. | 2,715 | 0.67 | 141 | 3.68 | ||||
| 2026-02-17 | 13F | Janus Henderson Group Plc | 23,977 | 0.00 | 1,248 | 2.97 | ||||
| 2026-02-12 | 13F | Nuveen, LLC | 358,714 | 0.63 | 18,674 | 3.27 | ||||
| 2026-02-13 | 13F | Smartleaf Asset Management LLC | 1,933 | 76.05 | 101 | 81.82 | ||||
| 2026-02-17 | 13F | Quantinno Capital Management LP | 242,000 | 19.15 | 12,570 | 21.98 | ||||
| 2026-04-17 | 13F | Cidel Asset Management Inc | 981,216 | 82.54 | 54,568 | 95.00 | ||||
| 2026-02-12 | 13F | CIBC Private Wealth Group, LLC | 363 | 0.00 | 19 | 0.00 | ||||
| 2026-02-12 | 13F | Andra AP-fonden | 32,654 | 2,330 | ||||||
| 2026-02-10 | 13F | Keyvantage Wealth, Llc | 20,845 | 0.05 | 1,083 | 2.37 | ||||
| 2026-01-29 | 13F | UBS Group AG | 464,259 | -12.43 | 24,114 | -10.36 | ||||
| 2026-02-17 | 13F | Public Employees Retirement System Of Ohio | 95,072 | 0.24 | 4,949 | 2.85 | ||||
| 2026-01-29 | 13F | Aprio Wealth Management, LLC | 4,279 | 222 | ||||||
| 2026-02-17 | 13F | XTX Topco Ltd | 43,143 | -51.39 | 2,241 | -50.26 | ||||
| 2026-01-28 | 13F | DekaBank Deutsche Girozentrale | 377,359 | 0.00 | 16 | -11.11 | ||||
| 2026-02-13 | 13F | PCM Encore, LLC | 5,906 | 307 | ||||||
| 2026-02-11 | 13F | O'shaughnessy Asset Management, Llc | 28,034 | -33.49 | 1,457 | -31.87 | ||||
| 2026-02-13 | 13F | Macquarie Group Ltd | 0 | -100.00 | 0 | |||||
| 2025-11-12 | 13F | 111 Capital | 0 | -100.00 | 0 | -100.00 | ||||
| 2026-02-17 | 13F | Royal Bank Of Canada | 35,184,008 | -6.09 | 1,827,459 | -3.87 | ||||
| 2026-02-17 | 13F | Worldquant Millennium Advisors Llc | 0 | -100.00 | 0 |