Estatísticas Básicas
| Ações Institucionais (Longas) | 522,615,097 - 97.71% (ex 13D/G) - change of -114.05MM shares -17.91% MRQ |
| Valor Institucional (Longa) | $ 42,127,088 USD ($1000) |
Propriedade Institucional e Acionistas
American International Group, Inc. (US:AIG) tem 1155 proprietários e acionistas institucionais que enviaram os formulários 13D/G ou 13F para a Comissão de Valores Mobiliários (SEC). Essas instituições possuem um total de 522,615,097 ações. Os maiores acionistas incluem Vanguard Group Inc, BlackRock, Inc., Capital Research Global Investors, Wellington Management Group Llp, State Street Corp, Harris Associates L P, Price T Rowe Associates Inc /md/, Invesco Ltd., Franklin Resources Inc, and GQG Partners LLC .
American International Group, Inc. (NYSE:AIG) a estrutura de propriedade institucional mostra as posições atuais na empresa por instituições e fundos, bem como as últimas mudanças no tamanho da posição. Os principais acionistas podem incluir investidores individuais, fundos mútuos, fundos de cobertura ou instituições. O Schedule 13D indica que o investidor possui (ou possuía) mais de 5% da empresa e pretende (ou pretendia) buscar ativamente uma mudança na estratégia de negócios. O Schedule 13G indica um investimento passivo de mais de 5%.
The share price as of April 17, 2026 is 78.68 / share. Previously, on April 21, 2025, the share price was 79.38 / share. This represents a decline of 0.88% over that period.

Pontuação do Sentimento do Fundo
A Pontuação do Sentimento do Fundo (anteriormente conhecida como Pontuação de Acumulação de Propriedade) identifica as ações que estão sendo mais compradas pelos fundos. É o resultado de um modelo quantitativo sofisticado e multifatorial que identifica empresas com os maiores níveis de acumulação institucional. O modelo de pontuação utiliza uma combinação do aumento total em proprietários divulgados, as mudanças nas alocações de portfólio desses proprietários e outras métricas. O número varia de 0 a 100, com números mais altos indicando um nível maior de acumulação em relação aos seus pares, sendo 50 a média.
Frequência de Atualização: Diariamente
Veja o Explorador de Propriedade, que fornece uma lista das empresas com melhor classificação.
AI+ Ask Fintel’s AI assistant about American International Group, Inc..
Select a question to share a public post with an AI-crafted answer.
Thinking of good questions…
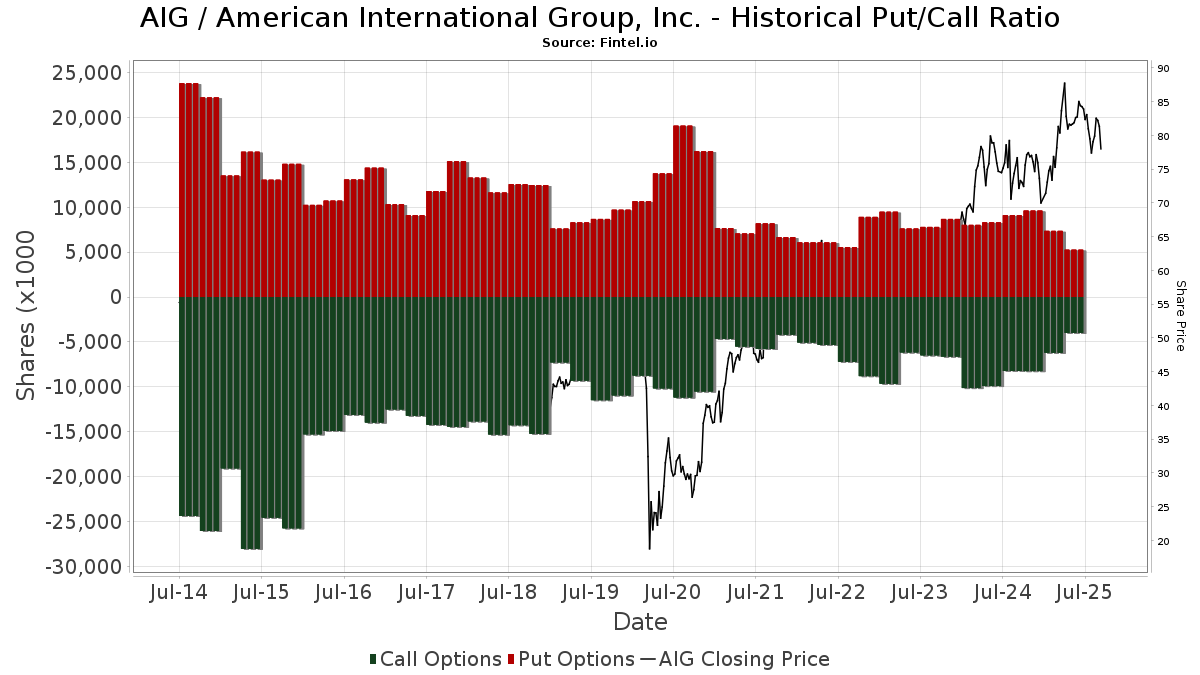
Relação Institucional de Put/Call
Além de relatar questões padrão de ações e dívidas, instituições com mais de 100MM sob gestão devem também divulgar suas posições em opções de venda (put) e compra (call). Uma vez que as opções de venda geralmente indicam um sentimento negativo, e as opções de compra indicam um sentimento positivo, podemos obter uma noção do sentimento institucional geral ao traçar a relação de puts para calls. O gráfico à direita traça a relação histórica de put/call para este instrumento.
Usar a Relação de Put/Call como um indicador do sentimento do investidor supera uma das principais deficiências de usar a propriedade institucional total, que é que uma quantidade significativa de ativos sob gestão são investidos passivamente para acompanhar índices. Fundos geridos passivamente geralmente não compram opções, então o indicador de relação de put/call acompanha mais de perto o sentimento de fundos geridos ativamente.
Arquivamentos 13D/G
Apresentamos os arquivamentos 13D/G separadamente dos arquivamentos 13F devido ao tratamento diferente pela SEC. Arquivamentos 13D/G podem ser feitos por grupos de investidores (com um líder), enquanto arquivamentos 13F não podem. Isso resulta em situações em que um investidor pode arquivar um 13D/G reportando um valor para o total de ações (representando todas as ações possuídas pelo grupo de investidores), mas depois arquivar um 13F reportando um valor diferente para o total de ações (representando estritamente a sua própria propriedade). Isso significa que a propriedade de ações dos arquivamentos 13D/G e 13F muitas vezes não são diretamente comparáveis, então os apresentamos separadamente.
Nota: A partir de 16 de maio de 2021, não mostramos mais proprietários que não enviaram um 13D/G nos últimos anos. Anteriormente, estávamos mostrando o histórico completo de arquivamentos 13D/G. Em geral, entidades que são obrigadas a arquivar 13D/G devem arquivar pelo menos anualmente antes de enviar um arquivamento de encerramento. No entanto, fundos às vezes saem de posições sem enviar um arquivamento de encerramento (ou seja, eles se desfazem), então mostrar o histórico completo às vezes resultava em confusão sobre a propriedade atual. Para evitar confusão, agora mostramos apenas os proprietários atuais - ou seja - proprietários que arquivaram dentro do último ano.
Upgrade to unlock premium data.
| Data do Arquivo | Formulário | Investidor | Ações Anterior |
Últimas Ações |
Δ Ações (Percentual) |
Propriedade (Percentual) |
Δ Propriedade (Percentual) |
|
|---|---|---|---|---|---|---|---|---|
| 2026-02-12 | Capital Research Global Investors | 28,534,448 | 26,228,641 | -8.08 | 4.90 | -5.77 | ||
| 2025-10-30 | VANGUARD GROUP INC | 71,962,174 | 68,482,752 | -4.84 | 12.36 | 20.59 | ||
| 2025-04-17 | BlackRock, Inc. | 62,640,753 | 41,200,202 | -34.23 | 6.90 | -22.47 |
Arquivamentos 13F e NPORT
Detalhes sobre Formulários 13F são gratuitos. Detalhes sobre Formulários NP requerem uma assinatura premium. Linhas verdes indicam novas posições. Linhas vermelhas indicam posições fechadas. Clique no ícone de link para ver o histórico completo de transações.
Atualize
para desbloquear dados premium e exportar para Excel ![]() .
.
Important Note
In an effort to reduce load times for our mobile users, we are testing some ways to deliver lighter pages.
In this first test, we will deliver only the most recent 750 transactions (out of 1439 for this stock). If you are interested in loading *all* the transactions for this company, click the "load all" button below. This is just a test and if you don't like it, please let us know by submitting some gentle feedback via the link at the bottom of this page.
Load All| Data do Arquivo | Fonte | Investidor | Tipo | Preço Médio (Est) |
Ações | Δ Ações (%) |
Valor Reportado (US$1000) |
Δ Valor (%) |
Aloc. de Portf. (%) |
|
|---|---|---|---|---|---|---|---|---|---|---|
| 2026-02-09 | 13F | Frazier Financial Advisors, LLC | 230 | 0.00 | 20 | 5.56 | ||||
| 2026-04-13 | 13F | Artemis Investment Management LLP | 94,021 | 18.31 | 7,075 | 4.07 | ||||
| 2026-04-14 | 13F | Cornerstone National Bank & Trust Co | 92 | 0.00 | 7 | -14.29 | ||||
| 2026-02-13 | 13F | Ausdal Financial Partners, Inc. | 5,527 | 1.45 | 473 | 10.54 | ||||
| 2026-03-13 | 13F/A | Pensionmark Financial Group, Llc | 10,755 | 5.00 | 920 | 14.43 | ||||
| 2026-02-20 | 13F | Kovitz Investment Group Partners, LLC | 147,660 | -14.44 | 12,632 | -6.80 | ||||
| 2025-11-14 | 13F | Horiko Capital Management Llc | 0 | -100.00 | 0 | |||||
| 2026-01-27 | 13F | GHP Investment Advisors, Inc. | 4,141 | 0.41 | 354 | 9.60 | ||||
| 2026-02-13 | 13F | Sterling Capital Management LLC | 1,771 | -34.99 | 152 | -29.11 | ||||
| 2026-02-17 | 13F | Cardiff Park Advisors, Llc | 2,565 | 0.00 | 219 | 8.96 | ||||
| 2026-04-10 | 13F | Finivi Inc. | 6,027 | 0.00 | 454 | -12.04 | ||||
| 2026-01-16 | 13F | Ronald Blue Trust, Inc. | 1,697 | -1.45 | 145 | 7.41 | ||||
| 2026-04-07 | 13F | Farther Finance Advisors, LLC | 11,540 | 8.30 | 872 | -4.39 | ||||
| 2026-02-17 | 13F | Equitable Holdings, Inc. | 3,917 | 15.14 | 335 | 25.47 | ||||
| 2026-02-05 | 13F | Cambridge Investment Research Advisors, Inc. | 15,784 | -3.32 | 1 | 0.00 | ||||
| 2026-02-13 | 13F | Verition Fund Management LLC | Call | 13,000 | -77.66 | 1,112 | -75.67 | |||
| 2026-02-13 | 13F | Verition Fund Management LLC | 55,679 | -58.57 | 4,763 | -54.87 | ||||
| 2026-04-02 | 13F | Lvm Capital Management Ltd/mi | 0 | -100.00 | 0 | |||||
| 2026-02-11 | 13F | Hughes Financial Services, LLC | 12 | -55.56 | 1 | -50.00 | ||||
| 2026-02-23 | 13F | Mv Capital Management, Inc. | 2,057 | -20.76 | 176 | -21.17 | ||||
| 2026-02-17 | 13F | Hotchkis & Wiley Capital Management Llc | 10,270,323 | 0.14 | 878,626 | 9.07 | ||||
| 2026-02-17 | 13F | Credit Agricole S A | 150,113 | -22.32 | 12,842 | -15.39 | ||||
| 2026-02-13 | 13F | Verition Fund Management LLC | Put | 36,400 | -60.69 | 3,114 | -57.18 | |||
| 2026-01-07 | 13F | Harbor Investment Advisory, Llc | 1,635 | 173.41 | 140 | 202.17 | ||||
| 2026-01-12 | 13F | CVA Family Office, LLC | 2,648 | -0.94 | 227 | 8.13 | ||||
| 2026-02-13 | 13F | First Trust Advisors Lp | 1,227,076 | 62.73 | 104,976 | 77.25 | ||||
| 2026-02-03 | 13F | Credit Industriel Et Commercial | 0 | -100.00 | 0 | -100.00 | ||||
| 2026-02-13 | 13F | Public Sector Pension Investment Board | 137,414 | 15.03 | 11,756 | 25.29 | ||||
| 2026-01-29 | 13F | Dunhill Financial, LLC | 132 | -19.02 | 11 | -8.33 | ||||
| 2026-02-09 | 13F | Hartland & Co., LLC | 6,741 | 10.44 | 577 | 20.25 | ||||
| 2026-01-20 | 13F | Independence Bank of Kentucky | 24 | 2 | ||||||
| 2026-02-13 | 13F | Cornerstone Financial Management LLC | 77 | 7 | ||||||
| 2025-11-14 | 13F | Wolverine Trading, Llc | Call | 73,900 | 5,757 | |||||
| 2025-11-14 | 13F | Wolverine Trading, Llc | Put | 60,400 | 4,705 | |||||
| 2025-11-12 | 13F | Claro Advisors LLC | 0 | -100.00 | 0 | -100.00 | ||||
| 2026-02-06 | 13F | Vestmark Advisory Solutions, Inc. | 20,581 | 39.59 | 1,761 | 52.12 | ||||
| 2025-10-24 | 13F | ORG Wealth Partners, LLC | 0 | -100.00 | 0 | -100.00 | ||||
| 2026-02-17 | 13F | Capital Fund Management S.a. | Put | 22,200 | -51.42 | 1,899 | -47.09 | |||
| 2026-02-11 | 13F | Zions Bancorporation, National Association /ut/ | 6,654 | 18.48 | 569 | 29.02 | ||||
| 2026-02-17 | 13F | Capital Fund Management S.a. | Call | 17,900 | -78.06 | 1,531 | -76.11 | |||
| 2026-02-02 | 13F | Caisse Des Depots Et Consignations | 20,619 | 207.33 | 1,764 | 235.17 | ||||
| 2026-02-05 | 13F | Pinnacle Associates Ltd | 7,678 | 0.29 | 657 | 9.15 | ||||
| 2026-02-10 | 13F | Bruce G. Allen Investments, LLC | 555 | 0.00 | 47 | 9.30 | ||||
| 2026-02-10 | 13F | Axq Capital, Lp | 6,901 | 590 | ||||||
| 2026-02-11 | 13F | Buckingham Strategic Partners | 9,261 | -28.85 | 792 | -21.27 | ||||
| 2026-02-12 | 13F | Hollencrest Capital Management | 5,013 | 0.00 | 429 | 8.91 | ||||
| 2026-04-09 | 13F | Goelzer Investment Management, Inc. | 20,634 | -3.08 | 1,553 | -14.77 | ||||
| 2026-01-26 | 13F | AE Wealth Management LLC | 4,133 | 14.81 | 354 | 25.18 | ||||
| 2026-02-11 | 13F | Meeder Advisory Services, Inc. | 17,927 | 1,534 | ||||||
| 2026-01-21 | 13F | Albion Financial Group /ut | 36 | -30.77 | 3 | -25.00 | ||||
| 2026-02-11 | 13F | Fox Run Management, L.l.c. | 6,547 | 560 | ||||||
| 2026-02-10 | 13F | Argent Trust Co | 27,137 | 0.25 | 2,322 | 9.17 | ||||
| 2026-02-17 | 13F | Ancora Advisors, LLC | 1,445 | 20.42 | 124 | 30.85 | ||||
| 2026-02-17 | 13F | Sherbrooke Park Advisers Llc | 0 | -100.00 | 0 | |||||
| 2026-01-22 | 13F | Financial Consulate, Inc | 5 | -54.55 | 0 | |||||
| 2026-02-04 | 13F | Catalyst Financial Partners Llc | 6,471 | 1.33 | 554 | 10.38 | ||||
| 2026-02-04 | 13F | Mascoma Wealth Management LLC | 15 | 1 | ||||||
| 2026-01-28 | 13F | United Asset Strategies, Inc. | 129,932 | 2.52 | 11,116 | 11.67 | ||||
| 2026-04-08 | 13F | Wealth Science Advisors LLC | 2,462 | 0.00 | 211 | 0.00 | ||||
| 2026-02-10 | 13F | Godfrey Financial Associates, Inc. | 32 | 3 | ||||||
| 2026-02-13 | 13F | Sumitomo Life Insurance Co | 9,382 | 1.11 | 803 | 10.16 | ||||
| 2025-11-14 | 13F | Viking Global Investors Lp | 0 | -100.00 | 0 | |||||
| 2025-10-31 | 13F | Barrett & Company, Inc. | 0 | -100.00 | 0 | |||||
| 2026-01-22 | 13F | Premier Path Wealth Partners, LLC | 5,461 | 2.98 | 467 | 12.26 | ||||
| 2026-02-13 | 13F | Baird Financial Group, Inc. | 46,223 | 17.83 | 3,954 | 28.38 | ||||
| 2026-01-22 | 13F | Argus Investors' Counsel, Inc. | 5,954 | 6.13 | 509 | 15.68 | ||||
| 2026-02-12 | 13F | Triumph Capital Management | 2,827 | 3.48 | 242 | 12.62 | ||||
| 2026-02-06 | 13F | Motco | 420 | 0.00 | 36 | 9.38 | ||||
| 2026-02-19 | 13F | CI Private Wealth, LLC | 330,137 | 43.15 | 22,912 | 28.55 | ||||
| 2026-01-23 | 13F | Legacy Bridge, LLC | 99 | 8 | ||||||
| 2026-01-26 | 13F | Childress Capital Advisors, Llc | 5,955 | 28.06 | 509 | 39.45 | ||||
| 2026-01-15 | 13F | Fifth Third Wealth Advisors LLC | 19,361 | -9.28 | 1,656 | -1.19 | ||||
| 2026-02-13 | 13F | Soros Fund Management Llc | 186,001 | 15,912 | ||||||
| 2026-02-12 | 13F | UniSuper Management Pty Ltd | 51,633 | -9.47 | 4,417 | -1.38 | ||||
| 2026-02-13 | 13F | Healthcare Of Ontario Pension Plan Trust Fund | 136,330 | 11.81 | 11,663 | 21.79 | ||||
| 2026-02-13 | 13F | Virtus ETF Advisers LLC | 175 | 15 | ||||||
| 2026-02-10 | 13F | Peapack Gladstone Financial Corp | 17,371 | -6.41 | 1 | 0.00 | ||||
| 2026-02-10 | 13F | Kentucky Retirement Systems | 36,174 | 0.00 | 3,095 | 8.91 | ||||
| 2026-02-12 | 13F | Lansforsakringar Fondforvaltning AB (publ) | 178,416 | -2.32 | 15,263 | 6.40 | ||||
| 2026-02-12 | 13F | Empirical Finance, LLC | 24,376 | -4.46 | 2,085 | 4.09 | ||||
| 2026-02-17 | 13F | Cresset Asset Management, LLC | 123,296 | 5.57 | 10,548 | 14.98 | ||||
| 2026-04-10 | 13F | Country Trust Bank | 135 | 0.00 | 10 | -9.09 | ||||
| 2026-02-11 | 13F | LPL Financial LLC | 517,509 | -12.23 | 44,273 | -4.40 | ||||
| 2026-02-17 | 13F | Vinva Investment Management Ltd | 292,445 | 527.09 | 25,188 | 593.50 | ||||
| 2026-02-19 | 13F | Mcguire Capital Advisors Inc | 336 | 29 | ||||||
| 2026-02-06 | 13F | Resona Asset Management Co.,Ltd. | 167,256 | -6.59 | 14,336 | 2.07 | ||||
| 2026-02-12 | 13F | Hrt Financial Lp | 33,980 | 3 | ||||||
| 2026-04-08 | 13F | Mma Asset Management Llc | 4,507 | 11.98 | 339 | -1.45 | ||||
| 2026-02-11 | 13F | SOUTH STATE Corp | 240 | 11.63 | 21 | 25.00 | ||||
| 2025-11-12 | 13F | Westfield Capital Management Co Lp | 0 | -100.00 | 0 | |||||
| 2026-02-17 | 13F | ExodusPoint Capital Management, LP | 0 | -100.00 | 0 | -100.00 | ||||
| 2026-02-13 | 13F | L2 Asset Management, LLC | 2,783 | 3.19 | 238 | 12.80 | ||||
| 2025-11-05 | 13F | AdvisorShares Investments LLC | 0 | -100.00 | 0 | -100.00 | ||||
| 2026-04-03 | 13F | Investors Research Corp | 1,000 | 0.00 | 75 | -11.76 | ||||
| 2026-02-12 | 13F | Xponance, Inc. | 114,922 | 6.28 | 9,832 | 15.77 | ||||
| 2026-02-13 | 13F | Greenline Wealth Management LLC | 21 | 2 | ||||||
| 2026-02-17 | 13F | Jones Financial Companies Lllp | 20,628 | 10.44 | 1,765 | 21.07 | ||||
| 2026-02-17 | 13F | Freestone Grove Partners LP | 22,451 | 1,921 | ||||||
| 2026-02-04 | 13F | Asahi Life Asset Management Co., Ltd. | 5,480 | 469 | ||||||
| 2026-02-09 | 13F | Knights of Columbus Asset Advisors LLC | 114,741 | -4.87 | 9,816 | 3.62 | ||||
| 2026-01-14 | 13F | Mitchell & Pahl Private Wealth, Llc | 7,145 | -0.01 | 611 | 8.91 | ||||
| 2026-02-10 | 13F | Commonwealth Of Pennsylvania Public School Empls Retrmt Sys | 125,508 | -5.66 | 10,737 | 2.77 | ||||
| 2026-02-17 | 13F | State Of Wisconsin Investment Board | 296,607 | -29.72 | 25,375 | -23.45 | ||||
| 2026-02-05 | 13F | Atria Investments Llc | 51,909 | -5.06 | 4,441 | 3.40 | ||||
| 2026-02-12 | 13F | Principal Securities, Inc. | 10,373 | -16.68 | 887 | -9.21 | ||||
| 2026-02-13 | 13F | American Century Companies Inc | 1,204,488 | 10.17 | 103,044 | 20.01 | ||||
| 2026-02-17 | 13F | Integrated Advisors Network LLC | 13,666 | 7.41 | 1,169 | 17.02 | ||||
| 2026-02-05 | 13F | iA Global Asset Management Inc. | 51,016 | 4.11 | 4 | 33.33 | ||||
| 2026-02-09 | 13F | Arista Wealth Management, LLC | 7,532 | 0.00 | 644 | 8.97 | ||||
| 2026-04-13 | 13F | St Germain D J Co Inc | 16 | 1 | ||||||
| 2026-04-16 | 13F | Baron Wealth Management LLC | 3,026 | 1.58 | 228 | -10.63 | ||||
| 2026-02-13 | 13F | Pathstone Holdings, LLC | 110,795 | 19.84 | 9,479 | 30.53 | ||||
| 2025-11-20 | 13F | First Affirmative Financial Network | 0 | -100.00 | 0 | |||||
| 2026-02-10 | 13F | Rothschild Investment Llc | 129,950 | -2.06 | 11,117 | 6.68 | ||||
| 2026-02-17 | 13F | Schonfeld Strategic Advisors LLC | 73,810 | 520.36 | 6,314 | 576.02 | ||||
| 2025-10-30 | 13F | Traub Capital Management LLC | 0 | -100.00 | 0 | |||||
| 2026-02-13 | 13F | Minot DeBlois Advisors LLC | 50 | 0.00 | 4 | 33.33 | ||||
| 2026-02-13 | 13F | Schroder Investment Management Group | 296,850 | -2.63 | 25,568 | 7.66 | ||||
| 2026-01-14 | 13F | Pallas Capital Advisors LLC | 16,451 | -15.99 | 1,407 | -8.46 | ||||
| 2026-02-13 | 13F | Corps Capital Advisors, LLC | 7,238 | 619 | ||||||
| 2026-02-06 | 13F | Lsv Asset Management | 3,990,872 | 2.26 | 341 | 11.44 | ||||
| 2026-02-06 | 13F | Redmont Wealth Advisors Llc | 75 | 0.00 | 6 | 20.00 | ||||
| 2026-04-13 | 13F | Clayton Financial Group LLC | 112 | 0.00 | 8 | -11.11 | ||||
| 2026-01-21 | 13F | Sound Income Strategies, LLC | 159 | 205.77 | 12 | 175.00 | ||||
| 2026-02-14 | 13F | Berkshire Asset Management Llc/pa | 0 | -100.00 | 0 | |||||
| 2026-02-12 | 13F | Andra AP-fonden | 0 | -100.00 | 0 | |||||
| 2026-02-09 | 13F | Syverson Strege & Co | 3,325 | -1.74 | 284 | 7.17 | ||||
| 2026-03-04 | 13F | SHP Wealth Management | 402 | 34 | ||||||
| 2026-02-13 | 13F | Ostrum Asset Management | 12,011 | -24.88 | 1,028 | -18.17 | ||||
| 2026-01-21 | 13F | Flagship Harbor Advisors, Llc | 2,416 | 207 | ||||||
| 2026-04-07 | 13F | CoreCap Advisors, LLC | 479 | -2.04 | 36 | -12.20 | ||||
| 2026-02-17 | 13F | Bank Of America Corp /de/ | Put | 0 | -100.00 | 0 | ||||
| 2026-04-16 | 13F | Davis Capital Management | 3 | -25.00 | 0 | |||||
| 2026-02-17 | 13F | Clear Street Markets Llc | 802 | -15.93 | 69 | -8.11 | ||||
| 2026-01-26 | 13F | JNBA Financial Advisors | 44 | 4 | ||||||
| 2026-04-07 | 13F | Abner Herrman & Brock Llc | 166,738 | 0.98 | 13 | -14.29 | ||||
| 2026-02-06 | 13F | Paradigm Capital Management, LLC/NV | 5,268 | 0.00 | 0 | |||||
| 2026-02-17 | 13F | California State Teachers Retirement System | 987,656 | -7.50 | 84,494 | 0.75 | ||||
| 2026-04-16 | 13F | Toth Financial Advisory Corp | 410 | -8.89 | 31 | -21.05 | ||||
| 2026-01-14 | 13F | Jfs Wealth Advisors, Llc | 962 | 10.32 | 82 | 20.59 | ||||
| 2026-02-04 | 13F | LRI Investments, LLC | 3,764 | -10.08 | 322 | -1.83 | ||||
| 2026-01-29 | 13F | Vanguard Group Inc | 67,783,183 | -1.02 | 5,798,851 | 7.81 | ||||
| 2026-02-10 | 13F | Envestnet Asset Management Inc | 989,164 | -14.61 | 84,623 | -6.99 | ||||
| 2026-02-11 | 13F | Fjarde Ap-fonden /fourth Swedish National Pension Fund | 95,437 | 8,165 | ||||||
| 2026-02-17 | 13F | Creative Planning | 81,004 | -16.23 | 6,930 | -8.76 | ||||
| 2025-11-14 | 13F | Sofos Investments, Inc. | 0 | 0 | ||||||
| 2026-02-17 | 13F | Private Advisor Group, LLC | 24,303 | -3.72 | 2,079 | 4.89 | ||||
| 2026-02-05 | 13F | Northwestern Mutual Investment Management Company, Llc | 17,240 | -2.36 | 1,475 | 6.35 | ||||
| 2026-02-06 | 13F | EverSource Wealth Advisors, LLC | 4,566 | -9.28 | 391 | -1.27 | ||||
| 2026-02-13 | 13F | Dai-Ichi Life Insurance Company, Ltd | 21,285 | 0.00 | 1,821 | 8.92 | ||||
| 2026-02-17 | 13F | Janus Henderson Group Plc | 73,841 | 1.44 | 6,320 | 10.53 | ||||
| 2026-04-09 | 13F | Pacifica Partners Inc. | 27,445 | 2,065 | ||||||
| 2026-01-30 | 13F | State of New Jersey Common Pension Fund D | 182,982 | -3.14 | 15,654 | 5.51 | ||||
| 2026-02-17 | 13F | SummitTX Capital, L.P. | 10,911 | 15.12 | 933 | 25.40 | ||||
| 2026-02-17 | 13F | Sagewood Asset Management LP | 3,214 | 275 | ||||||
| 2026-01-06 | 13F | Ransom Advisory, Ltd | 200 | 0.00 | 17 | 13.33 | ||||
| 2026-01-27 | 13F | First Horizon Corp | 1,260 | -19.59 | 108 | -13.01 | ||||
| 2026-04-16 | 13F | SG Americas Securities, LLC | 2,703,304 | 42.27 | 203 | 25.31 | ||||
| 2025-11-14 | 13F | Point72 (DIFC) Ltd | Call | 100 | -66.67 | 8 | -72.00 | |||
| 2026-02-13 | 13F | Williams Jones Wealth Management, LLC. | 7,536 | 1.34 | 645 | 10.27 | ||||
| 2026-02-11 | 13F | West Family Investments, Inc. | 0 | -100.00 | 0 | -100.00 | ||||
| 2025-11-13 | 13F | GeoWealth Management, LLC | 0 | -100.00 | 0 | |||||
| 2026-02-17 | 13F | Point72 Asset Management, L.P. | Put | 107,400 | -46.19 | 9,188 | -41.39 | |||
| 2026-02-13 | 13F | Integrated Wealth Concepts LLC | 3,454 | -51.07 | 296 | -46.75 | ||||
| 2026-02-10 | 13F | Ellevest, Inc. | 3,560 | -3.13 | 305 | 5.56 | ||||
| 2026-02-10 | 13F | Core Wealth Advisors, Llc | 27 | 2 | ||||||
| 2026-02-17 | 13F | Point72 Asset Management, L.P. | Call | 74,000 | -53.63 | 6,331 | -49.50 | |||
| 2026-02-11 | 13F | Jpmorgan Chase & Co | 1,405,083 | -9.14 | 120,205 | -1.04 | ||||
| 2026-02-11 | 13F | Jpmorgan Chase & Co | Call | 711,500 | 35.60 | 60,869 | 47.71 | |||
| 2026-02-11 | 13F | Jpmorgan Chase & Co | Put | 827,000 | 2.26 | 70,750 | 11.39 | |||
| 2026-02-17 | 13F | Raymond James Financial Inc | 2,890,298 | -11.76 | 247,265 | -3.88 | ||||
| 2026-02-12 | 13F | Wedbush Securities Inc | 5,230 | -30.87 | 0 | |||||
| 2026-04-06 | 13F | CX Institutional | 6,252 | -11.68 | 0 | |||||
| 2026-02-13 | 13F | Resources Investment Advisors, LLC. | 4,718 | 13.63 | 404 | 23.62 | ||||
| 2026-02-10 | 13F | Td Asset Management Inc | 357,707 | -14.96 | 30,602 | -7.37 | ||||
| 2026-02-13 | 13F | MAI Capital Management | 14,066 | 5.50 | 1,203 | 14.90 | ||||
| 2026-02-13 | 13F | Citigroup Inc | 891,395 | 2.87 | 76,259 | 12.05 | ||||
| 2026-02-13 | 13F | Citigroup Inc | Call | 250,000 | 66.67 | 21,388 | 81.54 | |||
| 2026-02-02 | 13F | Oppenheimer & Co Inc | 0 | -100.00 | 0 | |||||
| 2026-02-13 | 13F | Citigroup Inc | Put | 232,500 | 0.00 | 19,890 | 8.93 | |||
| 2026-01-08 | 13F | Maridea Wealth Management LLC | 0 | -100.00 | 0 | |||||
| 2026-02-13 | 13F | Zuckerman Investment Group, LLC | 2,500 | 214 | ||||||
| 2026-02-17 | 13F | Quantitative Investment Management, LLC | 25,642 | 2 | ||||||
| 2026-03-02 | 13F | Bank Of Hawaii | 16,041 | 2.68 | 1,372 | 11.82 | ||||
| 2026-01-21 | 13F | Y.D. More Investments Ltd | 389 | -15.98 | 33 | -8.33 | ||||
| 2026-03-06 | 13F | Hsbc Holdings Plc | 1,481,688 | -19.75 | 126,952 | -12.22 | ||||
| 2026-01-30 | 13F | Citizens Financial Group Inc/ri | 8,382 | -10.63 | 717 | -2.58 | ||||
| 2026-04-07 | 13F | Retirement Wealth Solutions LLC | 23 | -30.30 | 2 | -50.00 | ||||
| 2026-04-17 | 13F | Stephenson National Bank & Trust | 4,977 | 1.01 | 375 | -11.16 | ||||
| 2026-02-13 | 13F | Cetera Trust Company, N.A | 17,329 | 11.20 | 1,482 | 21.18 | ||||
| 2026-02-13 | 13F | Seneschal Advisors, LLC | 8 | 0.00 | 1 | |||||
| 2026-01-16 | 13F | Standard Life Aberdeen plc | 432,046 | 0.82 | 36,962 | 10.72 | ||||
| 2026-02-12 | 13F | BlackRock, Inc. | 48,707,016 | 4.24 | 4,166,885 | 13.54 | ||||
| 2026-01-27 | 13F | Cannon Global Investment Management, LLC | 6,500 | 556 | ||||||
| 2026-04-10 | 13F | Piscataqua Savings Bank | 322 | 0.00 | 24 | -11.11 | ||||
| 2026-01-20 | 13F | Steel Peak Wealth Management LLC | 23,004 | 44.28 | 1,968 | 57.11 | ||||
| 2026-04-14 | 13F | Opal Wealth Advisors, LLC | 2,839 | -65.62 | 214 | -69.83 | ||||
| 2026-02-13 | 13F | Meixler Investment Management, Ltd. | 7,897 | -7.96 | 676 | 0.30 | ||||
| 2025-11-05 | 13F | Thompson Davis & Co., Inc. | 0 | -100.00 | 0 | -100.00 | ||||
| 2026-01-20 | 13F | American National Bank | 6 | 0.00 | 1 | |||||
| 2026-02-05 | 13F | Center for Financial Planning, Inc. | 300 | 0.00 | 26 | 8.70 | ||||
| 2026-04-17 | 13F | Total Clarity Wealth Management, Inc. | 12,721 | 2.02 | 957 | -10.23 | ||||
| 2026-02-12 | 13F | JPL Wealth Management, LLC | 0 | -100.00 | 0 | -100.00 | ||||
| 2025-11-14 | 13F | Scientech Research LLC | 0 | -100.00 | 0 | -100.00 | ||||
| 2026-04-10 | 13F | Daytona Street Capital LLC | 4,000 | 0.00 | 303 | -11.40 | ||||
| 2025-12-09 | 13F/A | Tudor Investment Corp Et Al | 0 | -100.00 | 0 | -100.00 | ||||
| 2026-02-03 | 13F | SBI Securities Co., Ltd. | 2,628 | 4.29 | 225 | 13.71 | ||||
| 2025-11-13 | 13F | Inceptionr Llc | 0 | -100.00 | 0 | -100.00 | ||||
| 2026-02-14 | 13F | Frec Markets, Inc. | 3,943 | 337 | ||||||
| 2026-02-13 | 13F | Brown Advisory Inc | 1,430,478 | -11.85 | 122,377 | -3.99 | ||||
| 2026-02-17 | 13F | Aquatic Capital Management LLC | 0 | -100.00 | 0 | |||||
| 2026-02-17 | 13F | Engineers Gate Manager LP | 0 | -100.00 | 0 | -100.00 | ||||
| 2026-02-12 | 13F | Mount Yale Investment Advisors, LLC | 12,656 | 88.17 | 1,083 | 104.92 | ||||
| 2026-02-12 | 13F | Colonial Trust Co / SC | 114 | -30.49 | 10 | -25.00 | ||||
| 2025-11-14 | 13F | Clough Capital Partners L P | 0 | -100.00 | 0 | |||||
| 2026-04-07 | 13F | U.S. Capital Wealth Advisors, LLC | 7,997 | 7.08 | 602 | -5.80 | ||||
| 2026-04-08 | 13F | Arlington Trust Co LLC | 137 | 24.55 | 10 | 11.11 | ||||
| 2025-11-14 | 13F | Fayez Sarofim & Co | 0 | -100.00 | 0 | |||||
| 2026-02-17 | 13F | Laird Norton Trust Company, Llc | 13,572 | 1,161 | ||||||
| 2026-01-23 | 13F | Rsm Us Wealth Management Llc | 24,708 | 1.48 | 2,128 | 11.30 | ||||
| 2026-01-26 | 13F | Private Trust Co Na | 3,851 | -0.59 | 329 | 8.22 | ||||
| 2026-01-28 | 13F | Chicago Partners Investment Group LLC | 3,328 | -41.86 | 241 | -46.43 | ||||
| 2026-02-17 | 13F | Advanced Portfolio Management, LLC | 0 | -100.00 | 0 | |||||
| 2026-04-15 | 13F | Journey Strategic Wealth Llc | 3,510 | 17.63 | 264 | 3.53 | ||||
| 2026-02-10 | 13F | Mutual Of America Capital Management Llc | 57,941 | -3.52 | 4,957 | 5.09 | ||||
| 2026-02-17 | 13F | Kemnay Advisory Services Inc. | 214 | 18 | ||||||
| 2026-02-17 | 13F | Price T Rowe Associates Inc /md/ | 16,371,853 | 39.80 | 1,401 | 52.34 | ||||
| 2026-02-13 | 13F | Ossiam | 5,004 | -53.22 | 428 | -49.05 | ||||
| 2026-02-11 | 13F | Erste Asset Management GmbH | 5,375 | 465 | ||||||
| 2026-01-23 | 13F | Sage Mountain Advisors LLC | 7,729 | 6.56 | 661 | 16.17 | ||||
| 2026-02-12 | 13F | Saiph Capital, LLC | 0 | -100.00 | 0 | |||||
| 2026-02-10 | 13F/A | Northwestern Mutual Wealth Management Co | 73,396 | 44.45 | 6,279 | 57.37 | ||||
| 2026-01-21 | 13F | Portside Wealth Group, LLC | 15,998 | 2.95 | 1,369 | 12.13 | ||||
| 2026-04-15 | 13F | Avanza Fonder AB | 50,770 | 0.00 | 3,820 | -12.04 | ||||
| 2026-02-02 | 13F | Ashton Thomas Securities, Llc | 9,890 | 0.17 | 846 | 9.16 | ||||
| 2026-01-16 | 13F | First Pacific Financial | 0 | -100.00 | 0 | |||||
| 2025-11-14 | 13F | PineBridge Investments, L.P. | 3,286 | 258 | ||||||
| 2026-02-17 | 13F | Toms Capital Investment Management Lp | Call | 2,500,000 | 213,875 | |||||
| 2026-02-12 | 13F | APG Asset Management N.V. | 283,588 | -30.04 | 20,657 | -23.76 | ||||
| 2026-02-04 | 13F | Valeo Financial Advisors, LLC | 13,375 | 6.99 | 1,144 | 16.62 | ||||
| 2026-02-13 | 13F | Diametric Capital, LP | 0 | -100.00 | 0 | |||||
| 2026-04-13 | 13F | Wolff Wiese Magana Llc | 65 | 0.00 | 5 | -20.00 | ||||
| 2026-01-29 | 13F | Inscription Capital, LLC | 4,802 | -1.44 | 411 | 7.33 | ||||
| 2026-02-17 | 13F | Gillson Capital LP | 226,900 | 0 | ||||||
| 2026-02-17 | 13F | Utah Retirement Systems | 94,010 | -1.15 | 8,043 | 7.67 | ||||
| 2026-02-02 | 13F | Varma Mutual Pension Insurance Co | 141,330 | 0.00 | 12,091 | 8.92 | ||||
| 2026-01-27 | 13F | Forum Financial Management, LP | 12,287 | -0.34 | 1,051 | 8.57 | ||||
| 2026-02-24 | 13F | SG Trading Solutions, LLC | 2,485 | 0 | ||||||
| 2026-01-27 | 13F | MASTERINVEST Kapitalanlage GmbH | 2,655 | 0.00 | 229 | 9.62 | ||||
| 2026-02-11 | 13F | Tiaa Trust, National Association | 6,033 | -5.56 | 516 | 2.99 | ||||
| 2026-01-26 | 13F | Consilium Wealth Advisory, LLC | 3,638 | 0.00 | 311 | 9.12 | ||||
| 2026-01-23 | 13F | Optima Capital Llc | 22 | 2 | ||||||
| 2026-02-13 | 13F | Chevy Chase Trust Holdings, Inc. | 273,898 | -3.15 | 23,432 | 5.49 | ||||
| 2026-01-23 | 13F | Transcend Wealth Collective, Llc | 2,729 | -36.65 | 233 | -31.07 | ||||
| 2026-02-13 | 13F | Victory Capital Management Inc | 1,348,574 | 4.13 | 115,371 | 13.43 | ||||
| 2026-02-13 | 13F | Blueshift Asset Management, LLC | 0 | -100.00 | 0 | |||||
| 2026-01-21 | 13F | Signature Resources Capital Management, LLC | 95 | 0.00 | 8 | 14.29 | ||||
| 2026-02-13 | 13F | Kayne Anderson Rudnick Investment Management Llc | 157 | 1.95 | 13 | 8.33 | ||||
| 2026-01-23 | 13F | Patton Fund Management, Inc. | 2,906 | 7.19 | 249 | 16.98 | ||||
| 2026-02-06 | 13F | Americana Partners, LLC | 6,859 | -49.97 | 587 | -45.54 | ||||
| 2026-02-02 | 13F | New England Capital Financial Advisors LLC | 302 | 0.00 | 26 | 8.70 | ||||
| 2026-02-09 | 13F | Kestra Investment Management, LLC | 3,287 | -6.67 | 281 | 1.81 | ||||
| 2026-04-08 | 13F | Miracle Mile Advisors, LLC | 7,430 | -8.20 | 559 | -19.22 | ||||
| 2026-04-15 | 13F | Silverlake Wealth Management Llc | 6,242 | 0.58 | 470 | -11.51 | ||||
| 2026-02-02 | 13F | Oppenheimer Asset Management Inc. | 0 | -100.00 | 0 | |||||
| 2026-02-09 | 13F | Alta Advisers Ltd | 0 | -100.00 | 0 | -100.00 | ||||
| 2026-04-08 | 13F | Community Financial Services Group, LLC | 429 | 32 | ||||||
| 2026-02-12 | 13F | Great Valley Advisor Group, Inc. | 3,934 | -13.12 | 337 | -5.35 | ||||
| 2026-02-17 | 13F | BTG Pactual Asset Management US LLC | 3,126 | 267 | ||||||
| 2026-02-17 | 13F | SageView Advisory Group, LLC | 8,454 | -10.24 | 723 | -2.17 | ||||
| 2026-01-26 | 13F | Townsend & Associates, Inc | 401,885 | 1.90 | 29,752 | -2.49 | ||||
| 2026-02-13 | 13F | Charles Schwab Investment Management Inc | 4,130,936 | -0.31 | 353,402 | 8.59 | ||||
| 2026-02-17 | 13F | Blair William & Co/il | 17,115 | -0.91 | 1,464 | 7.96 | ||||
| 2026-04-09 | 13F | Generali Investments, Management Co LLC | 6,628 | -34.02 | 499 | -42.03 | ||||
| 2026-02-03 | 13F | Farmers & Merchants Investments Inc | 457 | -4.19 | 39 | 5.41 | ||||
| 2025-11-04 | 13F | ASB Consultores, LLC | 0 | -100.00 | 0 | -100.00 | ||||
| 2026-02-03 | 13F | Luken Investment Analytics, LLC | 107 | 9 | ||||||
| 2026-01-28 | 13F | DekaBank Deutsche Girozentrale | 144,616 | 0.00 | 12 | 9.09 | ||||
| 2026-02-13 | 13F | Rhumbline Advisers | 992,476 | -4.71 | 84,906 | 3.79 | ||||
| 2026-01-23 | 13F | Inlight Wealth Management, LLC | 35 | 0.00 | 3 | 0.00 | ||||
| 2026-01-23 | 13F | Halbert Hargrove Global Advisors, Llc | 0 | -100.00 | 0 | |||||
| 2026-01-30 | 13F | Interchange Capital Partners, LLC | 3,694 | 2.21 | 316 | 10.92 | ||||
| 2026-02-02 | 13F | Principal Financial Group Inc | 593,497 | -1.57 | 50,774 | 7.22 | ||||
| 2026-02-06 | 13F | Pnc Financial Services Group, Inc. | 206,986 | 5.19 | 17,708 | 14.58 | ||||
| 2026-02-09 | 13F | Atlantic Trust, LLC | 68 | -43.80 | 6 | -44.44 | ||||
| 2026-02-12 | 13F | Skandinaviska Enskilda Banken AB (publ) | 119,859 | 1.90 | 10,254 | 10.99 | ||||
| 2026-04-17 | 13F | HHM Wealth Advisors, LLC | 248 | 0.00 | 19 | -14.29 | ||||
| 2025-11-14 | 13F | Texas Permanent School Fund | 0 | -100.00 | 0 | |||||
| 2026-02-13 | 13F | Walleye Capital LLC | Call | 38,800 | 145.57 | 3,319 | 167.66 | |||
| 2026-04-08 | 13F | Sapient Capital Llc | 3,657 | 275 | ||||||
| 2026-02-10 | 13F | Natixis Advisors, L.p. | 726,817 | -0.68 | 62 | 8.77 | ||||
| 2026-02-13 | 13F | Walleye Capital LLC | Put | 55,900 | 55.28 | 4,782 | 69.15 | |||
| 2026-04-14 | 13F | Nova Wealth Management, Inc. | 0 | -100.00 | 0 | |||||
| 2026-02-13 | 13F | Walleye Capital LLC | 43,060 | 3,684 | ||||||
| 2026-01-15 | 13F | Mn Services Vermogensbeheer B.V. | 223,764 | 1.34 | 19 | 11.76 | ||||
| 2025-11-14 | 13F | Point72 Asia (Singapore) Pte. Ltd. | 0 | -100.00 | 0 | |||||
| 2026-01-16 | 13F | Louisiana State Employees Retirement System | 27,600 | -5.15 | 2,361 | 3.33 | ||||
| 2026-01-21 | 13F | Newbridge Financial Services Group, Inc. | 283 | -19.37 | 24 | -11.11 | ||||
| 2026-02-02 | 13F | Cornerstone Planning Group LLC | 67 | -35.58 | 5 | -50.00 | ||||
| 2026-02-17 | 13F | FIL Ltd | 35,814 | -65.43 | 3,064 | -62.36 | ||||
| 2026-02-09 | 13F | Hantz Financial Services, Inc. | 197,771 | -5.72 | 17 | 0.00 | ||||
| 2025-11-07 | 13F | Beacon Capital Management, LLC | 0 | -100.00 | 0 | |||||
| 2026-04-14 | 13F | Beacon Investment Advisory Services, Inc. | 4,002 | 0.00 | 301 | -11.99 | ||||
| 2026-02-13 | 13F | Motiv8 Investments LLC | 117 | 0 | ||||||
| 2026-02-11 | 13F | Sunrise Financial Services, LLC | 31 | 3 | ||||||
| 2026-01-12 | 13F | Salem Investment Counselors Inc | 0 | -100.00 | 0 | |||||
| 2026-02-17 | 13F | Two Sigma Advisers, Lp | 0 | -100.00 | 0 | |||||
| 2025-11-14 | 13F | AXA Investment Managers S.A. | 11,131 | 874 | ||||||
| 2026-04-17 | 13F | Leeward Investments, LLC - MA | 99,712 | -3.29 | 7,503 | -14.93 | ||||
| 2026-02-17 | 13F | LMR Partners LLP | 0 | -100.00 | 0 | |||||
| 2025-11-10 | 13F | Bowen Hanes & Co Inc | 0 | -100.00 | 0 | |||||
| 2026-02-05 | 13F | AustralianSuper Pty Ltd | 1,115,734 | 14.79 | 95,451 | 25.03 | ||||
| 2026-01-22 | 13F | Personal Cfo Solutions, Llc | 9,082 | 11.55 | 777 | 21.44 | ||||
| 2026-04-15 | 13F | NorthAvenue LLC | 4 | 0.00 | 0 | |||||
| 2025-10-30 | 13F | Ridgewood Investments LLC | 0 | -100.00 | 0 | -100.00 | ||||
| 2026-02-28 | 13F | Corecam Pte. Ltd. | 0 | -100.00 | 0 | |||||
| 2026-02-03 | 13F | American Assets Investment Management, LLC | 50,000 | 0.00 | 4,278 | 8.91 | ||||
| 2026-02-13 | 13F | Neo Ivy Capital Management | 20,396 | 1,745 | ||||||
| 2026-02-11 | 13F | Simplex Trading, Llc | Put | 116,900 | 33.14 | 10,001 | 166,566.67 | |||
| 2026-02-11 | 13F | Simplex Trading, Llc | Call | 155,900 | 20.29 | 13,337 | 133,270.00 | |||
| 2025-11-10 | 13F | Verus Capital Partners, Llc | 0 | -100.00 | 0 | -100.00 | ||||
| 2026-02-06 | 13F | Diamond Hill Capital Management Inc | 10,817,462 | -10.68 | 925,434 | -2.71 | ||||
| 2026-02-12 | 13F | New York State Common Retirement Fund | 695,971 | -29.63 | 59,540 | -23.35 | ||||
| 2026-02-03 | 13F | Ethic Inc. | 107,973 | -5.30 | 9,237 | 3.16 | ||||
| 2026-01-28 | 13F | Salomon & Ludwin, LLC | 35 | -75.18 | 3 | -81.82 | ||||
| 2026-04-10 | 13F | Oak Thistle LLC | 71,208 | 215.78 | 5,358 | 177.76 | ||||
| 2026-02-04 | 13F | Clark Wealth Partners | 27 | 0.00 | 2 | 0.00 | ||||
| 2026-02-13 | 13F | Pine Valley Investments Ltd Liability Co | 0 | -100.00 | 0 | |||||
| 2026-01-13 | 13F | Sendero Wealth Management, LLC | 37,417 | -2.46 | 3,201 | 6.27 | ||||
| 2025-11-12 | 13F | Park Square Financial Group, LLC | 0 | -100.00 | 0 | -100.00 | ||||
| 2026-01-16 | 13F | Crewe Advisors LLC | 1,010 | 3.80 | 86 | 13.16 | ||||
| 2026-02-12 | 13F | Keel Point, LLC | 6,899 | -3.91 | 590 | 4.80 | ||||
| 2026-02-17 | 13F | Two Sigma Securities, Llc | 0 | -100.00 | 0 | |||||
| 2026-02-17 | 13F | Fmr Llc | 2,898,861 | 10.52 | 247,998 | 20.39 | ||||
| 2025-11-14 | 13F | Blue Capital, Inc. | 0 | -100.00 | 0 | -100.00 | ||||
| 2026-04-17 | 13F | McHugh Group, LLC | 0 | -100.00 | 0 | |||||
| 2026-01-16 | 13F | PFS Partners, LLC | Put | 650 | -25.20 | |||||
| 2026-02-13 | 13F | Umb Bank N A/mo | 2,246 | 1.17 | 192 | 10.34 | ||||
| 2026-02-05 | 13F | Elyxium Wealth, LLC | 6,973 | -11.14 | 596 | -3.25 | ||||
| 2026-02-17 | 13F | Russell Investments Group, Ltd. | 1,071,093 | -20.00 | 91,739 | -12.56 | ||||
| 2026-02-12 | 13F | Cibc World Markets Corp | 82,540 | 13.33 | 7,061 | 13.28 | ||||
| 2026-02-17 | 13F | Jain Global LLC | 685,948 | 58,683 | ||||||
| 2026-03-26 | 13F | Leonteq Securities AG | Call | 0 | -100.00 | 0 | -100.00 | |||
| 2026-02-17 | 13F | Nissay Asset Management Corp /japan/ /adv | 70,890 | -2.47 | 6,065 | 6.24 | ||||
| 2025-10-21 | 13F | Amplius Wealth Advisors, LLC | 0 | -100.00 | 0 | |||||
| 2026-02-17 | 13F | Cape Investment Advisory, Inc. | 179 | 171.21 | 15 | 200.00 | ||||
| 2026-02-13 | 13F | BNP Paribas Asset Management Holding S.A. | 228,979 | -57.68 | 20 | -54.76 | ||||
| 2026-02-17 | 13F | Polymer Capital Management (US) LLC | 3,315 | -52.48 | 284 | -48.26 | ||||
| 2026-01-28 | 13F | Arizona State Retirement System | 155,983 | -7.32 | 13,344 | 0.95 | ||||
| 2026-02-13 | 13F | Cullen Capital Management, LLC | 494,273 | 42,285 | ||||||
| 2026-02-17 | 13F | Aster Capital Management (DIFC) Ltd | 0 | -100.00 | 0 | |||||
| 2026-02-13 | 13F | Alyeska Investment Group, L.P. | 427,239 | 36,550 | ||||||
| 2026-01-28 | 13F | Quent Long Short Global Small Cap Fund, LP | 3,888 | 333 | ||||||
| 2026-02-02 | 13F | One Wealth Advisors, LLC | 5,761 | 123.04 | 493 | 143.56 | ||||
| 2026-02-13 | 13F | Adams Diversified Equity Fund, Inc. | 255,000 | 2.74 | 21,815 | 11.91 | ||||
| 2026-03-12 | 13F/A | Peak6 Llc | Call | 56,500 | 337.98 | 4,834 | 377.10 | |||
| 2026-01-29 | 13F | Courier Capital Llc | 6,950 | -0.71 | 595 | 8.20 | ||||
| 2026-02-02 | 13F | Mutual Advisors, LLC | 2,349 | 201 | ||||||
| 2026-03-12 | 13F/A | Peak6 Llc | Put | 7,800 | 212.00 | 667 | 240.31 | |||
| 2026-01-26 | 13F | KBC Group NV | 324,942 | 5.98 | 28 | 12.50 | ||||
| 2026-02-17 | 13F | Css Llc/il | 5,940 | 508 | ||||||
| 2026-02-05 | 13F | 1st Source Bank | 3,300 | 0.00 | 282 | 8.88 | ||||
| 2026-02-17 | 13F | National Asset Management, Inc. | 4,519 | -22.22 | 387 | -15.35 | ||||
| 2026-02-11 | 13F | Winnow Wealth Llc | 25 | 0.00 | 2 | 100.00 | ||||
| 2026-02-12 | 13F | Commonwealth Equity Services, Llc | 309,448 | -0.22 | 26,473 | 110,204.17 | ||||
| 2026-02-18 | 13F | Strong Retirement Solutions LLC | 3,982 | 341 | ||||||
| 2026-01-22 | 13F | Venturi Wealth Management, LLC | 5,428 | 7.85 | 464 | 17.47 | ||||
| 2026-02-06 | 13F/A | Rathbone Brothers plc | 3,329 | -4.59 | 285 | 3.65 | ||||
| 2026-01-28 | 13F | Boston Trust Walden Corp | 2,500 | -28.57 | 214 | -22.26 | ||||
| 2026-02-03 | 13F | Ballentine Partners, LLC | 2,552 | -13.34 | 218 | -5.63 | ||||
| 2026-04-16 | 13F | Diversified Trust Co | 3,226 | -8.33 | 243 | -19.60 | ||||
| 2026-02-13 | 13F | Jacobs Levy Equity Management, Inc | 127,093 | -51.40 | 10,873 | -47.06 | ||||
| 2026-01-23 | 13F | Bridgewater Advisors Inc. | 6,048 | -15.23 | 435 | -20.22 | ||||
| 2026-02-13 | 13F | 17 Capital Partners, Llc | 14,975 | -0.13 | 1,281 | 8.84 | ||||
| 2026-02-10 | 13F | Catalyst Capital Advisors LLC | 0 | -100.00 | 0 | |||||
| 2026-02-10 | 13F | CIBC World Markets Inc. | 102,648 | 10.64 | 8,782 | 20.52 | ||||
| 2026-02-17 | 13F | Royal Bank Of Canada | 1,831,859 | -2.55 | 156,716 | 6.15 | ||||
| 2026-04-14 | 13F | Zrc Wealth Management, Llc | 0 | -100.00 | 0 | |||||
| 2026-02-13 | 13F | Mariner, LLC | 83,040 | 0.08 | 7,107 | 9.05 | ||||
| 2026-01-29 | 13F | IMC-Chicago, LLC | 126,644 | 10,834 | ||||||
| 2026-01-29 | 13F | IMC-Chicago, LLC | Put | 107,000 | -12.30 | 9,154 | -4.47 | |||
| 2026-01-29 | 13F | IMC-Chicago, LLC | Call | 451,600 | 137.93 | 38,634 | 159.18 | |||
| 2026-02-17 | 13F | Optiver Holding B.V. | 3,038 | 260 | ||||||
| 2026-02-09 | 13F | Jefferies Financial Group Inc. | 16,983 | 1,453 | ||||||
| 2025-12-18 | 13F | Danica Pension, Livsforsikringsaktieselskab | 0 | -100.00 | 0 | |||||
| 2026-01-27 | 13F | Asset Management One Co., Ltd. | 235,524 | -7.25 | 20,365 | 2.11 | ||||
| 2025-10-20 | 13F | Weaver Capital Management LLC | 0 | -100.00 | 0 | |||||
| 2026-02-26 | 13F | Anchor Investment Management, LLC | 39 | 0.00 | 3 | 0.00 | ||||
| 2026-01-27 | 13F | Zurcher Kantonalbank (Zurich Cantonalbank) | 360,597 | -3.78 | 30,849 | 4.81 | ||||
| 2026-02-17 | 13F | Weiss Asset Management LP | 5,588 | 478 | ||||||
| 2026-02-10 | 13F | Bnp Paribas | 1,975 | 0.00 | 169 | 8.39 | ||||
| 2025-11-13 | 13F | Limestone Investment Advisors LP | Put | 0 | -100.00 | 0 | -100.00 | |||
| 2026-02-13 | 13F | Bank Of Nova Scotia | 85,448 | 23.17 | 7,310 | 34.18 | ||||
| 2026-02-12 | 13F | Great Lakes Advisors, Llc | 9,382 | 20.27 | 803 | 31.05 | ||||
| 2026-02-06 | 13F | Profund Advisors Llc | 5,614 | -23.26 | 480 | -16.38 | ||||
| 2026-02-04 | 13F | Plato Investment Management Ltd | 4,589 | 0.00 | 395 | 10.36 | ||||
| 2026-02-20 | 13F | Talisman Wealth Advisors LLC | 2,338 | -38.55 | 200 | -32.89 | ||||
| 2026-01-23 | 13F | Brown, Lisle/cummings, Inc. | 82 | 0.00 | 7 | 16.67 | ||||
| 2026-02-17 | 13F | Voleon Capital Management Lp | 0 | -100.00 | 0 | -100.00 | ||||
| 2025-11-13 | 13F | Texas Capital Bancshares Inc/tx | 13 | 1 | ||||||
| 2026-02-10 | 13F | Private Wealth Asset Management, LLC | 273 | 0.00 | 23 | 9.52 | ||||
| 2026-02-13 | 13F | Ubs Asset Management Americas Inc | 4,203,663 | -4.83 | 359,623 | 3.67 | ||||
| 2026-02-17 | 13F | Ameriflex Group, Inc. | 403 | -51.79 | 34 | -47.69 | ||||
| 2026-01-30 | 13F | New York State Teachers Retirement System | 427,700 | -5.36 | 37 | 2.86 | ||||
| 2025-11-13 | 13F | Invenio Wealth Partners Llc | 0 | -100.00 | 0 | |||||
| 2026-02-13 | 13F | Gts Securities Llc | 7,360 | 630 | ||||||
| 2026-01-29 | 13F | Kestra Private Wealth Services, Llc | 10,902 | 3.79 | 933 | 13.11 | ||||
| 2026-02-13 | 13F | Pin Oak Investment Advisors Inc | 336 | 0.00 | 0 | -100.00 | ||||
| 2026-02-12 | 13F | Connecticut Wealth Management, LLC | 0 | -100.00 | 0 | |||||
| 2026-01-22 | 13F | Massachusetts Financial Services Co /ma/ | 2,264,785 | -33.20 | 193,752 | -27.23 | ||||
| 2026-01-30 | 13F/A | M&t Bank Corp | 64,890 | 3.50 | 5,551 | 12.76 | ||||
| 2026-01-26 | 13F | Parcion Private Wealth LLC | 2,923 | -8.51 | 250 | 0.00 | ||||
| 2026-01-29 | 13F | Teachers Retirement System Of The State Of Kentucky | 350,682 | 9.35 | 30 | 20.00 | ||||
| 2026-02-05 | 13F | HighMark Wealth Management LLC | 166 | 16.90 | 14 | 27.27 | ||||
| 2026-02-09 | 13F | Fidelis Capital Partners, LLC | 3,440 | -0.26 | 294 | 8.89 | ||||
| 2026-02-13 | 13F | Change Path, LLC | 6,020 | 0.10 | 515 | 9.11 | ||||
| 2026-02-17 | 13F | Keebeck Alpha, LP | 0 | -100.00 | 0 | |||||
| 2026-04-16 | 13F | Brookstone Capital Management | 2,690 | -12.83 | 202 | -23.48 | ||||
| 2026-02-12 | 13F | IFM Investors Pty Ltd | 115,852 | -5.47 | 10 | -99.91 | ||||
| 2026-02-11 | 13F | Franklin Resources Inc | 15,618,321 | 36.91 | 1,336,147 | 49.12 | ||||
| 2026-02-10 | 13F | CIBC Asset Management Inc | 134,763 | 55.41 | 11,529 | 69.28 | ||||
| 2026-03-04 | 13F/A | Pure Financial Advisors, Inc. | 3,001 | 257 | ||||||
| 2026-01-13 | 13F | Kathmere Capital Management, LLC | 9,372 | 5.24 | 802 | 14.59 | ||||
| 2026-02-13 | 13F | 1832 Asset Management L.P. | 22,814 | -12.45 | 1,952 | -4.64 | ||||
| 2026-04-15 | 13F | Bayforest Capital Ltd | 668 | -65.35 | 50 | -69.51 | ||||
| 2026-04-17 | 13F | Western Pacific Wealth Management, LP | 5,673 | 0.00 | 427 | -12.16 | ||||
| 2026-01-20 | 13F | SOA Wealth Advisors, LLC. | 576 | 0.00 | 49 | 8.89 | ||||
| 2026-02-04 | 13F | Securian Asset Management, Inc | 14,672 | -45.16 | 1,255 | -40.27 | ||||
| 2026-01-29 | 13F | Pictet Asset Management Holding SA | 268,053 | -5.30 | 22,932 | 3.15 | ||||
| 2026-01-28 | 13F | Philo Smith Capital Corp | 319,500 | 0.00 | 27,333 | 8.93 | ||||
| 2026-04-15 | 13F | Cohen Klingenstein LLC | 21,788 | 0.00 | 1,640 | -12.02 | ||||
| 2026-04-17 | 13F | Cidel Asset Management Inc | 11,037 | 23.22 | 831 | 8.36 | ||||
| 2026-02-05 | 13F | North Dakota State Investment Board | 19,780 | 1,692 | ||||||
| 2026-01-20 | 13F | Cigna Investments Inc /new | 5,353 | -4.90 | 0 | |||||
| 2026-02-17 | 13F | Guardian Wealth Advisors, Llc / Nc | 3,714 | 7.97 | 318 | 17.41 | ||||
| 2026-04-15 | 13F | Tema Etfs Llc | 13,676 | 0.51 | 1,029 | -11.52 | ||||
| 2026-02-13 | 13F | PCM Encore, LLC | 5,619 | 481 | ||||||
| 2026-01-27 | 13F | Evergreen Capital Management Llc | 39,965 | -2.78 | 3,419 | 5.92 | ||||
| 2026-02-05 | 13F | Navalign, LLC | 333 | 29 | ||||||
| 2026-02-17 | 13F | XTX Topco Ltd | 0 | -100.00 | 0 | |||||
| 2026-03-06 | 13F | Hsbc Holdings Plc | Call | 0 | -100.00 | 0 | ||||
| 2026-02-11 | 13F | Havemeyer Place LP | 25,982 | 2,223 | ||||||
| 2026-03-06 | 13F | Hsbc Holdings Plc | Put | 0 | -100.00 | 0 | ||||
| 2026-04-07 | 13F | Eastern Bank | 15 | -34.78 | 1 | 0.00 | ||||
| 2026-02-17 | 13F | Caption Management, LLC | Put | 40,000 | 3,422 | |||||
| 2026-02-13 | 13F | Entropy Technologies, LP | 63,530 | 5,435 | ||||||
| 2025-12-01 | 13F | Groupama Asset Managment | 0 | -100.00 | 0 | -100.00 | ||||
| 2026-02-03 | 13F | Allegiance Financial Group Advisory Services LLC | 2,372 | -28.01 | 203 | -21.71 | ||||
| 2026-02-17 | 13F | Dark Forest Capital Management Lp | 0 | -100.00 | 0 | -100.00 | ||||
| 2026-01-23 | 13F | Gibbs Wealth Management | 8,891 | -4.92 | 671 | -8.72 | ||||
| 2026-02-10 | 13F | Bnp Paribas Arbitrage, Sa | Call | 6,226 | 3.66 | 53,263 | 12.91 | |||
| 2026-02-10 | 13F | Bnp Paribas Arbitrage, Sa | 974,848 | -4.15 | 83,398 | 4.41 | ||||
| 2026-02-10 | 13F | Bnp Paribas Arbitrage, Sa | Put | 12,802 | 79.00 | 109,521 | 94.98 | |||
| 2026-02-13 | 13F | Royal London Asset Management Ltd | 227,137 | -4.44 | 19,432 | 4.09 | ||||
| 2026-04-02 | 13F | Collective Family Office Llc | 0 | -100.00 | 0 | |||||
| 2026-02-09 | 13F | Cary Street Partners Financial Llc | 5,088 | 0.02 | 435 | 9.02 | ||||
| 2026-01-22 | 13F | Bartlett & Co. Wealth Management Llc | 7,190 | 0.00 | 615 | 9.04 | ||||
| 2026-02-13 | 13F | Arete Wealth Advisors, LLC | 3,736 | -9.30 | 0 | |||||
| 2026-02-13 | 13F | Wbi Investments, Inc. | 0 | -100.00 | 0 | |||||
| 2026-02-13 | 13F | Capula Management Ltd | Call | 1,300 | -94.98 | 111 | -94.54 | |||
| 2026-02-24 | 13F/A | Pacer Advisors, Inc. | 66,480 | 49.04 | 5,687 | 62.35 | ||||
| 2026-02-12 | 13F | Marex Group plc | 3,075 | -49.17 | 263 | -44.63 | ||||
| 2026-02-13 | 13F | Capula Management Ltd | 132 | -99.23 | 11 | -99.18 | ||||
| 2026-02-13 | 13F | Capula Management Ltd | Put | 1,000 | -96.09 | 86 | -95.77 | |||
| 2026-01-16 | 13F | Trust Co Of Vermont | 500 | -15.54 | 43 | -8.70 | ||||
| 2026-02-10 | 13F | a16z Perennial Management, L.P. | 3,124 | -2.47 | 267 | 6.37 | ||||
| 2026-02-02 | 13F | Sachetta, LLC | 389 | -7.16 | 33 | 3.13 | ||||
| 2026-02-23 | 13F | Phillip James Consulting Co. | 3 | 0 | ||||||
| 2026-02-11 | 13F | Deseret Mutual Benefit Administrators | 2,154 | 4.31 | 184 | 13.58 | ||||
| 2026-02-17 | 13F | Amundi | 1,592,744 | -20.00 | 136,259 | -17.57 | ||||
| 2026-01-22 | 13F | Red Tortoise LLC | 173 | 0.00 | 15 | 7.69 | ||||
| 2026-02-02 | 13F | Farmers & Merchants Trust Co of Chambersburg PA | 97 | 0.00 | 0 | |||||
| 2026-02-06 | 13F | Banque Cantonale Vaudoise | 3,809 | -24.92 | 326 | |||||
| 2026-02-11 | 13F | Barrow Hanley Mewhinney & Strauss Llc | 7,482,558 | 10.84 | 640,133 | 20.73 | ||||
| 2026-02-11 | 13F | GW&K Investment Management, LLC | 1,917 | 8.12 | 0 | |||||
| 2026-01-16 | 13F | Marquette Asset Management, LLC | 0 | -100.00 | 0 | |||||
| 2026-01-21 | 13F | Aaron Wealth Advisors LLC | 16,619 | 5.78 | 1,422 | 15.25 | ||||
| 2026-02-13 | 13F | Sei Investments Co | 1,406,237 | 4.66 | 120,304 | 14.00 | ||||
| 2025-11-07 | 13F | Gsa Capital Partners Llp | 0 | -100.00 | 0 | |||||
| 2026-02-13 | 13F | Missouri Trust & Investment Co | 4,900 | 0.00 | 419 | 9.11 | ||||
| 2026-01-26 | 13F | Whittier Trust Co Of Nevada Inc | 1,227 | -24.63 | 96 | -27.48 | ||||
| 2026-02-17 | 13F | Canada Pension Plan Investment Board | 1,143,940 | 10.76 | 97,864 | 20.64 | ||||
| 2026-01-21 | 13F | Quilter Plc | 42,805 | -6.19 | 3,662 | 2.18 | ||||
| 2026-02-09 | 13F | Kingsview Wealth Management, LLC | 7,487 | -82.41 | 641 | -80.85 | ||||
| 2025-10-22 | 13F | Compass Planning Associates Inc | 0 | -100.00 | 0 | -100.00 | ||||
| 2026-04-08 | 13F | Wealth Enhancement Trust Services, Inc. | 2,117 | 5.96 | 159 | -6.47 | ||||
| 2026-02-13 | 13F | Walleye Trading LLC | Put | 63,300 | 81.90 | 5,415 | 98.13 | |||
| 2026-02-11 | 13F | TT Capital Management LLC | 2,401 | 205 | ||||||
| 2026-01-27 | 13F | Bolthouse Investments, LLC | 11,820 | 0.00 | 1,011 | 8.94 | ||||
| 2026-02-13 | 13F | Walleye Trading LLC | Call | 64,400 | -57.38 | 5,509 | -53.58 | |||
| 2026-02-10 | 13F | 3Chopt Investment Partners, LLC | 3,819 | 0.58 | 327 | 9.40 | ||||
| 2026-02-11 | 13F | Dorsey & Whitney Trust CO LLC | 2,845 | 243 | ||||||
| 2026-02-17 | 13F | Steadfast Capital Management Lp | 682,605 | -42.82 | 58,397 | -37.71 | ||||
| 2026-02-11 | 13F | Deutsche Bank Ag\ | 1,669,840 | -8.56 | 142,855 | -0.40 | ||||
| 2026-01-22 | 13F | Pinnacle Bancorp, Inc. | 146 | 0.00 | 12 | 9.09 | ||||
| 2026-02-06 | 13F | Fortis Group Advisors, LLC | 5 | 0.00 | 0 | |||||
| 2026-04-06 | 13F | Highline Wealth Partners Llc | 25 | -19.35 | 2 | -50.00 | ||||
| 2026-01-29 | 13F | Comerica Bank | 158,040 | -0.54 | 13,520 | 8.33 | ||||
| 2026-02-09 | 13F | Huntington National Bank | 3,244 | 22.42 | 278 | 33.17 | ||||
| 2026-04-16 | 13F | Security National Bank | 174 | 13 | ||||||
| 2026-02-05 | 13F | New York Life Investment Management Llc | 74,154 | -1.63 | 6,344 | 7.15 | ||||
| 2026-02-12 | 13F/A | Pinebridge Investments Llc | 8,155 | 698 | ||||||
| 2026-02-17 | 13F | Bank Of America Corp /de/ | Call | 0 | -100.00 | 0 | ||||
| 2026-01-20 | 13F | Harbor Capital Advisors, Inc. | 309 | -82.83 | 0 | |||||
| 2026-02-17 | 13F | NorthRock Partners, LLC | 3,442 | -71.54 | 294 | -69.02 | ||||
| 2026-02-12 | 13F | Brinker Capital Investments, LLC | 23,383 | 1.48 | 2,000 | 10.56 | ||||
| 2026-02-03 | 13F | Generali Asset Management SPA SGR | 41,083 | 493.77 | 3,515 | 547.15 | ||||
| 2026-02-12 | 13F | Benson Wealth Management INC | 26 | 2 | ||||||
| 2026-01-29 | 13F | Munich Reinsurance Co Stock Corp in Munich | 618,422 | -36.97 | 53,265 | -30.87 | ||||
| 2026-01-20 | 13F | Savvy Advisors, Inc. | 6,943 | 67.14 | 594 | 82.21 | ||||
| 2026-02-04 | 13F | Sentry Investment Management Llc | 1,426 | 0.00 | 0 | |||||
| 2026-01-23 | 13F | Galvin, Gaustad & Stein, LLC | 4,000 | 0.00 | 342 | 8.92 | ||||
| 2026-02-09 | 13F/A | Swedbank AB | 1,298,095 | -1.45 | 111,052 | 7.35 | ||||
| 2026-02-02 | 13F | Core Alternative Capital | 0 | -100.00 | 0 | |||||
| 2026-02-12 | 13F | Chilton Capital Management Llc | 16 | 1 | ||||||
| 2026-02-13 | 13F | Quarry LP | 1,062 | -83.35 | 91 | -82.04 | ||||
| 2026-02-09 | 13F | Harbour Investments, Inc. | 688 | -7.77 | 59 | 0.00 | ||||
| 2026-04-10 | 13F | Baker Tilly Financial, Llc | 4,707 | 12.80 | 354 | -0.84 | ||||
| 2026-01-21 | 13F | Ledyard National Bank | 29,868 | 3.01 | 2,555 | 12.21 | ||||
| 2026-01-30 | 13F | Kohmann Bosshard Financial Services, LLC | 608 | 52 | ||||||
| 2026-02-17 | 13F | Lighthouse Investment Partners, LLC | 0 | -100.00 | 0 | |||||
| 2026-02-18 | 13F | EP Wealth Advisors, Inc. | 9,772 | 23.96 | 836 | 24.04 | ||||
| 2026-04-17 | 13F | Webster Bank, N. A. | 1,035 | 0.00 | 78 | -12.50 | ||||
| 2026-01-29 | 13F | Calamos Wealth Management LLC | 3,494 | 13.48 | 299 | 23.65 | ||||
| 2026-02-13 | 13F | University Of Texas/texas Am Investment Managment Co | 70,850 | 679.60 | 6,061 | 750.07 | ||||
| 2026-04-09 | 13F | Wedmont Private Capital | 13,416 | 1.26 | 1,039 | 1.67 | ||||
| 2026-01-30 | 13F | United Community Bank | 124 | -14.48 | 11 | -9.09 | ||||
| 2026-02-12 | 13F | Johnson Financial Group, Inc. | 1,720 | -4.55 | 147 | 4.26 | ||||
| 2026-02-13 | 13F | Silvant Capital Management LLC | 665 | 0.00 | 57 | 7.69 | ||||
| 2026-02-17 | 13F | Prana Capital Management, LP | 745,309 | 17.74 | 63,761 | 28.25 | ||||
| 2025-11-14 | 13F | WealthTrak Capital Management LLC | 0 | -100.00 | 0 | |||||
| 2026-02-13 | 13F | Aptus Capital Advisors, LLC | 11,451 | 7.82 | 980 | 17.39 | ||||
| 2026-02-10 | 13F | Cherry Tree Wealth Management, LLC | 10 | 0.00 | 1 | |||||
| 2026-02-12 | 13F | Elo Mutual Pension Insurance Co | 87,347 | 2.80 | 7,473 | 11.97 | ||||
| 2026-02-10 | 13F | State of Wyoming | 5,417 | 9.21 | 463 | 19.02 | ||||
| 2026-02-04 | 13F | Centric Wealth Management | 36,928 | 0.27 | 2,730 | -6.12 | ||||
| 2026-02-11 | 13F | Prestige Wealth Management Group LLC | 1,203 | 0.00 | 103 | 8.51 | ||||
| 2026-01-21 | 13F | Prime Capital Investment Advisors, LLC | 9,448 | 5.19 | 808 | 14.61 | ||||
| 2026-01-21 | 13F | Stock Yards Bank & Trust Co | 6,400 | 0.00 | 548 | 8.96 | ||||
| 2026-01-21 | 13F | Prime Capital Investment Advisors, LLC | Put | 200 | 0.00 | 0 | ||||
| 2026-02-02 | 13F | Horizon Investments, LLC | 11,661 | 2.71 | 998 | 11.90 | ||||
| 2026-01-23 | 13F | Factory Mutual Insurance Co | 121,900 | -3.86 | 10,429 | 4.72 | ||||
| 2026-02-10 | 13F | Jupiter Asset Management Ltd | 1,504,602 | -6.87 | 128,719 | 1.44 | ||||
| 2025-11-12 | 13F | Accredited Wealth Management, LLC | 210 | 98.11 | 8 | -11.11 | ||||
| 2026-01-28 | 13F | Oversea-Chinese Banking CORP Ltd | 0 | -100.00 | 0 | -100.00 | ||||
| 2026-01-20 | 13F | Princeton Global Asset Management LLC | 151 | 0.00 | 13 | 9.09 | ||||
| 2026-02-13 | 13F | Allianz Se | 108,378 | 0.00 | 9,272 | 8.92 | ||||
| 2025-11-13 | 13F | Glenmede Investment Management, LP | 126,926 | 2.01 | 9,969 | -6.40 | ||||
| 2026-01-30 | 13F | Valued Wealth Advisors LLC | 475 | 7.22 | 41 | 17.65 | ||||
| 2026-02-12 | 13F | Skopos Labs, Inc. | 29,624 | 77.13 | 2,562 | 81.12 | ||||
| 2026-02-12 | 13F | Rossby Financial, LCC | 108 | 184.21 | 9 | 200.00 | ||||
| 2026-02-17 | 13F | Wiley Bros.-aintree Capital, Llc | 31,915 | -1.89 | 2,732 | 7.22 | ||||
| 2026-02-02 | 13F | Stuart Chaussee & Associates, Inc. | 0 | -100.00 | 0 | |||||
| 2026-02-10 | 13F | Hazlett, Burt & Watson, Inc. | 20 | -75.61 | 0 | |||||
| 2026-01-20 | 13F | Aspiriant, Llc | 3,055 | -2.15 | 261 | 6.53 | ||||
| 2026-04-08 | 13F | DiNuzzo Private Wealth, Inc. | 75 | -1.32 | 6 | -16.67 | ||||
| 2026-02-17 | 13F | Financial Avengers, Inc. | 49 | 0.00 | 4 | 0.00 | ||||
| 2026-04-06 | 13F | Rosenberg Matthew Hamilton | 27 | 0.00 | 2 | 0.00 | ||||
| 2026-02-06 | 13F | Bare Financial Services, Inc | 35 | 52.17 | 3 | 100.00 | ||||
| 2026-02-13 | 13F | Atlas Capital Advisors Llc | 583 | 0.34 | 50 | 0.00 | ||||
| 2026-01-27 | 13F | Shayne & Co., Llc | 22,780 | 0.00 | 1,949 | 8.89 | ||||
| 2026-02-11 | 13F | Rise Advisors, LLC | 0 | -100.00 | 0 | |||||
| 2026-02-13 | 13F | Golden State Wealth Management, LLC | 1,448 | -1.76 | 124 | 6.96 | ||||
| 2026-02-05 | 13F | High Note Wealth, LLC | 123 | 2.50 | 11 | 11.11 | ||||
| 2026-02-05 | 13F | Thrivent Financial For Lutherans | 1,052,920 | 0.63 | 90 | 9.76 | ||||
| 2026-02-17 | 13F | Two Sigma Investments, Lp | 30,305 | -96.17 | 2,593 | -95.82 | ||||
| 2026-04-10 | 13F | Northside Capital Management, LLC | 7,413 | 0.00 | 558 | -12.15 | ||||
| 2025-11-10 | 13F | Monetta Financial Services Inc | 0 | -100.00 | 0 | |||||
| 2026-02-17 | 13F | Pinnacle Financial Partners, Inc. | 52,409 | 4,484 | ||||||
| 2025-11-12 | 13F | HFG Advisors, Inc. | 0 | -100.00 | 0 | |||||
| 2026-02-17 | 13F | Sig Brokerage, Lp | 35,942 | 3,075 | ||||||
| 2026-02-17 | 13F | Sig Brokerage, Lp | Call | 90,000 | 1,736.73 | 7,700 | 1,904.95 | |||
| 2026-02-17 | 13F | Abel Hall, LLC | 3,141 | 269 | ||||||
| 2026-02-18 | 13F | Vident Advisory, LLC | 344,525 | -2.24 | 29,474 | 6.49 | ||||
| 2026-02-04 | 13F | Atlantic Union Bankshares Corp | 360 | 0.00 | 31 | 7.14 | ||||
| 2026-01-23 | 13F | Bingham Private Wealth, Llc | 6,325 | 12.24 | 541 | 12.24 | ||||
| 2026-02-05 | 13F | Convergence Investment Partners, LLC | 17,407 | 1,489 | ||||||
| 2026-02-11 | 13F | Empowered Funds, LLC | 24,421 | 15.48 | 2,089 | 25.84 | ||||
| 2026-04-14 | 13F | Bay Harbor Wealth Management, LLC | 70 | 34.62 | 5 | 25.00 | ||||
| 2026-02-10 | 13F | Goldman Sachs Group Inc | Call | 1,650,800 | 2,428.02 | 141,226 | 2,654.00 | |||
| 2026-02-10 | 13F | Goldman Sachs Group Inc | Put | 277,700 | 902.53 | 23,757 | 992.28 | |||
| 2026-04-09 | 13F | Everhart Financial Group, Inc. | 13,452 | -3.02 | 1,012 | -14.67 | ||||
| 2026-02-10 | 13F | Sittner & Nelson, Llc | 165 | 1,400.00 | 13 | |||||
| 2026-02-10 | 13F | Goldman Sachs Group Inc | 5,352,142 | 8.93 | 457,876 | 18.65 | ||||
| 2026-04-06 | 13F | GAMMA Investing LLC | 17,556 | 9.04 | 1,321 | -4.07 | ||||
| 2026-02-17 | 13F | Millennium Management Llc | Call | 18,700 | -18.70 | 1,600 | -11.46 | |||
| 2026-04-16 | 13F | E. Ohman J:or Asset Management AB | 19,614 | 0.00 | 1,476 | -12.05 | ||||
| 2026-02-10 | 13F | Acadian Asset Management Llc | 13,547 | 1 | ||||||
| 2026-02-12 | 13F | Annandale Capital, LLC | 3,151 | 0.00 | 0 | -100.00 | ||||
| 2026-02-17 | 13F | Millennium Management Llc | 190,427 | -35.35 | 16,291 | -29.58 | ||||
| 2026-02-12 | 13F | Sit Investment Associates Inc | 0 | -100.00 | 0 | |||||
| 2026-02-17 | 13F | Millennium Management Llc | Put | 41,400 | 31.85 | 3,542 | 43.59 | |||
| 2026-02-10 | 13F | Basepoint Wealth LLC | 123 | 11 | ||||||
| 2026-02-13 | 13F | Parkside Financial Bank & Trust | 2,996 | 38.90 | 256 | 51.48 | ||||
| 2026-02-11 | 13F | Jessup Wealth Management, Inc | 473 | 40 | ||||||
| 2025-10-31 | 13F | National Wealth Management Group, LLC | 0 | -100.00 | 0 | |||||
| 2026-01-14 | 13F | TrueMark Investments, LLC | 82,196 | 29.21 | 7,032 | 40.73 | ||||
| 2026-01-26 | 13F | Asset Dedication, LLC | 191 | 0.00 | 16 | 6.67 | ||||
| 2026-02-13 | 13F | Centerpoint Advisors, LLC | 33 | 0.00 | 0 | |||||
| 2026-01-15 | 13F | Foster & Motley Inc | 38,554 | 11.86 | 3 | 50.00 | ||||
| 2026-02-17 | 13F | LMR Partners LLP | Put | 9,800 | 0.00 | 838 | 8.97 | |||
| 2026-02-23 | 13F | Kera Capital Partners, Inc. | 2,848 | 213 | ||||||
| 2026-02-17 | 13F | LMR Partners LLP | Call | 228,300 | 706.71 | 19,531 | 778.98 | |||
| 2026-04-14 | 13F | Moisand Fitzgerald Tamayo, LLC | 27 | 0.00 | 2 | 0.00 | ||||
| 2026-02-12 | 13F | Aviva Plc | 464,845 | 2.66 | 39,767 | 11.83 | ||||
| 2026-02-18 | 13F | Achmea Investment Management B.V. | 0 | -100.00 | 0 | |||||
| 2026-02-17 | 13F | DZ BANK AG Deutsche Zentral Genossenschafts Bank, Frankfurt am Main | 9,083 | 16.14 | 777 | 26.55 | ||||
| 2026-04-02 | 13F | Ares Financial Consulting, LLC | 207 | 0.00 | 16 | -11.76 | ||||
| 2026-02-05 | 13F | May Hill Capital, LLC | 6,134 | 94.61 | 525 | 112.15 | ||||
| 2026-02-09 | 13F | Texas Capital Bank Wealth Management Services Inc | 3,145 | 269 | ||||||
| 2026-01-23 | 13F | Avion Wealth | 136 | 12.40 | 0 | |||||
| 2026-02-09 | 13F | Annis Gardner Whiting Capital Advisors, LLC | 14,195 | 0.61 | 1,214 | 9.57 | ||||
| 2026-04-09 | 13F | Chemistry Wealth Management LLC | 3,427 | -20.30 | 258 | -29.97 | ||||
| 2026-04-13 | 13F | True Wealth Design, LLC | 368 | -48.46 | 28 | -55.74 | ||||
| 2026-02-12 | 13F | Jane Street Group, Llc | 575,599 | 42.54 | 49,242 | 55.26 | ||||
| 2026-02-13 | 13F/A | Ontario Teachers Pension Plan Board | 0 | -100.00 | 0 | -100.00 | ||||
| 2026-02-12 | 13F | Jane Street Group, Llc | Put | 130,000 | 168.04 | 11,122 | 191.97 | |||
| 2026-02-12 | 13F | Jane Street Group, Llc | Call | 532,600 | 298.95 | 45,564 | 334.55 | |||
| 2026-02-13 | 13F | National Bank Of Canada /fi/ | 186,257 | -45.73 | 15,933 | -40.90 | ||||
| 2026-03-02 | 13F | Tobam | 804 | -58.10 | 0 | |||||
| 2026-02-13 | 13F | GQG Partners LLC | 15,492,942 | -16.09 | 1,325,423 | -8.60 | ||||
| 2026-02-10 | 13F | National Pension Service | 887,460 | -1.82 | 75,922 | 6.94 | ||||
| 2026-04-17 | 13F | Bell Investment Advisors, Inc | 589 | 2.61 | 44 | -10.20 | ||||
| 2026-02-13 | 13F | USS Investment Management Ltd | 95,892 | 0.05 | 8,207 | 9.02 | ||||
| 2026-01-29 | 13F | Concurrent Investment Advisors, LLC | 15,575 | 34.33 | 1,332 | 46.37 | ||||
| 2025-11-07 | 13F | Sierra Ocean, Llc | 0 | -100.00 | 0 | -100.00 | ||||
| 2026-01-30 | 13F | Torren Management, LLC | 1,057 | 90 | ||||||
| 2026-02-12 | 13F | Penserra Capital Management LLC | 48 | 0.00 | 0 | |||||
| 2026-02-17 | 13F | Spears Abacus Advisors LLC | 2,976 | 0.24 | 255 | 9.01 | ||||
| 2026-02-11 | 13F | Capital Research Global Investors | 26,208,447 | -8.15 | 2,242,136 | 0.05 | ||||
| 2026-02-10 | 13F | Westpac Banking Corp | 0 | -100.00 | 0 | |||||
| 2026-02-17 | 13F | Auxier Asset Management | 119,708 | 1.73 | 10,241 | 10.81 | ||||
| 2025-11-13 | 13F | Limestone Investment Advisors LP | Call | 0 | -100.00 | 0 | -100.00 | |||
| 2026-02-11 | 13F | Nemes Rush Group LLC | 29,490 | -0.50 | 2,523 | 8.38 | ||||
| 2026-02-13 | 13F | Smartleaf Asset Management LLC | 8,941 | 12.61 | 770 | 24.60 | ||||
| 2026-02-13 | 13F | Wealth Alliance | 3,210 | 2.62 | 275 | 11.84 | ||||
| 2026-02-05 | 13F | Gabelli Funds Llc | 59,200 | 0.00 | 5,065 | 8.93 | ||||
| 2026-02-13 | 13F | Financial Network Wealth Advisors LLC | 660 | 0.46 | 56 | 9.80 | ||||
| 2026-02-17 | 13F | Captrust Financial Advisors | 57,426 | -1.14 | 4,913 | 7.67 | ||||
| 2026-01-23 | 13F | Westside Investment Management, Inc. | 0 | -100.00 | 0 | |||||
| 2026-02-10 | 13F | JTC Employer Solutions Trusteee Ltd | 171,000 | 0.00 | 15 | 7.69 | ||||
| 2026-02-11 | 13F | Compass Rose Asset Management, LP | 61,000 | 5,219 | ||||||
| 2025-11-03 | 13F | SYM FINANCIAL Corp | 0 | -100.00 | 0 | -100.00 | ||||
| 2026-02-10 | 13F | Thompson Siegel & Walmsley Llc | 58,195 | 288.10 | 5 | 300.00 | ||||
| 2026-02-06 | 13F | Tortoise Investment Management, LLC | 0 | -100.00 | 0 | -100.00 | ||||
| 2026-02-06 | 13F | ProShare Advisors LLC | 127,876 | 14.54 | 10,940 | 24.76 | ||||
| 2026-02-09 | 13F | Allstate Corp | 43,149 | 100.62 | 3,691 | 118.53 | ||||
| 2026-02-17 | 13F | Centennial Bank/AR/ | 10,073 | 0.00 | 862 | 8.85 | ||||
| 2026-02-09 | 13F | Quest Partners LLC | 15,130 | -56.38 | 1,294 | -52.50 | ||||
| 2026-04-15 | 13F | Hartford Investment Management Co | 30,800 | -1.18 | 2,318 | -13.09 | ||||
| 2026-01-29 | 13F | Quent Capital, LLC | 3,888 | 3.60 | 333 | 12.93 | ||||
| 2026-02-11 | 13F | First Command Advisory Services, Inc. | 126 | 61.54 | 11 | 66.67 | ||||
| 2026-02-17 | 13F | Humankind Investments LLC | 0 | -100.00 | 0 | -100.00 | ||||
| 2026-02-11 | 13F | Ameritas Investment Partners, Inc. | 4,829 | 413 | ||||||
| 2026-02-12 | 13F | Kinneret Advisory, LLC | 6,146 | -2.66 | 526 | 6.06 | ||||
| 2026-02-12 | 13F | Great Lakes Retirement, Inc. | 5,860 | 4.36 | 501 | 13.61 | ||||
| 2026-02-11 | 13F | Hilton Head Capital Partners, LLC | 535 | 46 | ||||||
| 2026-02-11 | 13F | J.w. Cole Advisors, Inc. | 2,491 | -19.59 | 213 | -12.76 | ||||
| 2026-01-27 | 13F | Krilogy Financial LLC | 0 | -100.00 | 0 | |||||
| 2026-02-13 | 13F | Wilkerson Advisory Group LLC | 114 | 10 | ||||||
| 2026-02-10 | 13F | Kentucky Retirement Systems Insurance Trust Fund | 15,163 | 0.00 | 1,297 | 8.99 | ||||
| 2026-02-12 | 13F | Quadrant Capital Group Llc | 14,281 | 0.12 | 1,222 | 9.02 | ||||
| 2026-01-20 | 13F | Tritonpoint Wealth, Llc | 11,441 | -2.01 | 979 | 6.65 | ||||
| 2026-01-30 | 13F | NJ State Employees Deferred Compensation Plan | 0 | -100.00 | 0 | |||||
| 2025-10-31 | 13F | Symphony Financial, Ltd. Co. | 0 | -100.00 | 0 | -100.00 | ||||
| 2026-02-12 | 13F | Callan Family Office, LLC | 22,904 | 31.18 | 1,959 | 42.89 | ||||
| 2026-01-15 | 13F | Nisa Investment Advisors, Llc | 197,994 | -10.09 | 16,938 | -2.07 | ||||
| 2026-01-07 | 13F | Aventura Private Wealth, LLC | 451 | 1.12 | 39 | 8.57 | ||||
| 2026-02-09 | 13F | Keating Financial Advisory Services, Inc. | 581 | 50 | ||||||
| 2026-01-13 | 13F | Stonehage Fleming Financial Services Holdings Ltd | 9,241 | -15.75 | 791 | -8.25 | ||||
| 2026-01-26 | 13F | BCS Private Wealth Management, Inc. | 0 | -100.00 | 0 | |||||
| 2025-11-12 | 13F | Cobblestone Capital Advisors Llc /ny/ | 4,762 | 3.34 | 374 | -5.08 | ||||
| 2026-04-10 | 13F | First Bank & Trust | 6,123 | 0.54 | 461 | -11.71 | ||||
| 2026-01-30 | 13F | Bogart Wealth, LLC | 86 | 43.33 | 7 | 75.00 | ||||
| 2026-02-10 | 13F | Fort Sheridan Advisors Llc | 2,500 | 214 | ||||||
| 2026-02-13 | 13F | Bollard Group LLC | 0 | -100.00 | 0 | |||||
| 2026-02-12 | 13F | Empire Financial Management Company, LLC | 9,711 | 0.00 | 831 | 8.92 | ||||
| 2026-04-17 | 13F | Vermillion Wealth Management, Inc. | 100 | 40.85 | 7 | 16.67 | ||||
| 2026-02-10 | 13F | Essex Financial Services, Inc. | 5,760 | -15.06 | 493 | -7.52 | ||||
| 2026-01-22 | 13F | Apollon Wealth Management, LLC | 15,716 | -0.27 | 1,344 | 8.65 | ||||
| 2026-02-17 | 13F | Aristotle Capital Management, LLC | 10,987,850 | -5.00 | 940,017 | 3.48 | ||||
| 2026-01-26 | 13F | PDS Planning, Inc | 4,344 | 2.48 | 372 | 11.75 | ||||
| 2026-02-13 | 13F | Stifel Financial Corp | 493,269 | -3.49 | 42,199 | 5.12 | ||||
| 2026-02-13 | 13F | Solstein Capital, LLC | 0 | -100.00 | 0 | |||||
| 2026-02-17 | 13F | Wealth Watch Advisors, INC | 19 | -72.06 | 2 | -80.00 | ||||
| 2026-02-10 | 13F/A | Algebris (uk) Ltd | 451,264 | 135.59 | 38,643 | 157.07 | ||||
| 2026-02-05 | 13F | IMG Wealth Management, Inc. | 83 | 7 | ||||||
| 2026-02-13 | 13F | Edgestream Partners, L.P. | 3,332 | 285 | ||||||
| 2026-02-17 | 13F | Nomura Holdings Inc | 13,958 | -2.38 | 1,194 | 6.42 | ||||
| 2026-04-13 | 13F | Gateway Investment Advisers Llc | 6,725 | -51.32 | 506 | -57.15 | ||||
| 2026-02-03 | 13F | Mitsubishi UFJ Kokusai Asset Management Co., Ltd. | 1,156,343 | 4.59 | 97,445 | 12.22 | ||||
| 2026-01-23 | 13F | Timber Creek Capital Management LLC | 17,199 | -9.56 | 1,471 | -1.47 | ||||
| 2026-02-09 | 13F | Bleakley Financial Group, LLC | 17,344 | -3.32 | 1,484 | 5.33 | ||||
| 2026-02-17 | 13F | Signature Equity Partners, LLC | 593 | 51 | ||||||
| 2026-02-17 | 13F | Aqr Capital Management Llc | 2,774,979 | -2.41 | 237,399 | 7.12 | ||||
| 2026-02-12 | 13F | Tocqueville Asset Management L.p. | 4,355 | 373 | ||||||
| 2026-02-17 | 13F | Wellington Management Group Llp | 25,915,253 | -0.50 | 2,217,050 | 8.38 | ||||
| 2026-01-21 | 13F | Yousif Capital Management, Llc | 83,440 | 2.03 | 6,044 | -5.90 | ||||
| 2026-04-17 | 13F | Signal Advisors Wealth, LLC | 3,542 | -24.56 | 267 | -33.67 | ||||
| 2026-01-08 | 13F | Sound View Wealth Advisors Group, LLC | 0 | -100.00 | 0 | |||||
| 2026-02-03 | 13F | Costello Asset Management, INC | 190 | 0.00 | 16 | 14.29 | ||||
| 2026-01-27 | 13F | Institute for Wealth Management, LLC. | 15,497 | -1.92 | 1,326 | 6.77 | ||||
| 2026-04-15 | 13F | Valley National Advisers Inc | 0 | -100.00 | 0 | |||||
| 2025-11-04 | 13F | Guerra Advisors Inc | 20 | 2 | ||||||
| 2026-02-06 | 13F | Cedar Wealth Management, LLC | 28 | 0.00 | 2 | 0.00 | ||||
| 2026-02-09 | 13F | Mizuho Securities Usa Llc | 39,288 | -2.63 | 2,992 | -8.81 | ||||
| 2026-02-05 | 13F | HFM Investment Advisors, LLC | 61 | 258.82 | 5 | 400.00 | ||||
| 2026-02-17 | 13F | Summit Trail Advisors, Llc | 17,511 | -25.37 | 1,498 | -18.68 | ||||
| 2026-01-26 | 13F | La Banque Postale Asset Management SA | 13,165 | 0.00 | 1,126 | 9.00 | ||||
| 2026-02-17 | 13F | Tudor Investment Corp Et Al | Put | 3,000 | -73.91 | 257 | -71.65 | |||
| 2026-02-17 | 13F | Tudor Investment Corp Et Al | Call | 7,500 | -85.90 | 642 | -84.66 | |||
| 2026-02-18 | 13F | Beacon Pointe Advisors, LLC | 13,183 | -12.05 | 1,128 | -4.25 | ||||
| 2026-01-29 | 13F | Rakuten Securities, Inc. | 0 | -100.00 | 0 | |||||
| 2026-02-14 | 13F | Rockefeller Capital Management L.P. | 55,216 | 33.48 | 4,724 | 45.37 | ||||
| 2026-02-17 | 13F | Brevan Howard Capital Management LP | 0 | -100.00 | 0 | |||||
| 2026-02-17 | 13F | Brevan Howard Capital Management LP | Call | 0 | -100.00 | 0 | ||||
| 2026-01-28 | 13F | Turtle Creek Wealth Advisors, LLC | 2,914 | -5.85 | 249 | 2.47 | ||||
| 2026-01-30 | 13F | Mitsubishi UFJ Trust & Banking Corp | 360,754 | -38.19 | 30,867 | -32.67 | ||||
| 2026-02-17 | 13F | Banco Bilbao Vizcaya Argentaria, S.a. | 0 | -100.00 | 0 | |||||
| 2026-02-09 | 13F | Choate Investment Advisors | 3,629 | -38.26 | 310 | -32.75 | ||||
| 2026-02-11 | 13F | Brandes Investment Partners, Lp | 4,552 | -99.70 | 389 | -99.67 | ||||
| 2026-02-11 | 13F | Livforsakringsbolaget Skandia, Omsesidigt | 4,407 | 0.00 | 377 | 8.96 | ||||
| 2026-02-11 | 13F | Parallel Advisors, LLC | 4,493 | -16.69 | 384 | -9.22 | ||||
| 2026-02-12 | 13F | Federated Hermes, Inc. | 92,470 | -4.64 | 7,911 | 3.86 | ||||
| 2026-04-14 | 13F | Murphy Pohlad Asset Management LLC | 52,732 | 1.11 | 3,968 | -11.05 | ||||
| 2026-02-03 | 13F | We Are One Seven, LLC | 11,610 | 3.81 | 993 | 13.10 | ||||
| 2026-02-10 | 13F | Gulf International Bank (UK) Ltd | 31,018 | 0.00 | 3 | 0.00 | ||||
| 2026-02-11 | 13F | Janney Montgomery Scott LLC | 66,003 | 1.78 | 6 | 0.00 | ||||
| 2026-02-13 | 13F | Commerce Bank | 16,933 | -1.54 | 1,449 | 7.26 | ||||
| 2026-02-09 | 13F | HBK Sorce Advisory LLC | 3,150 | -1.78 | 242 | -7.31 | ||||
| 2026-02-10 | 13F | Forsta Ap-fonden | 112,900 | -5.44 | 9,659 | 3.00 | ||||
| 2026-01-28 | 13F | Klp Kapitalforvaltning As | 280,785 | 17.44 | 24,021 | 27.93 | ||||
| 2026-02-17 | 13F | Redwood Park Advisors LLC | 8 | 0.00 | 1 | |||||
| 2026-02-17 | 13F | Bridgeway Capital Management Inc | 0 | -100.00 | 0 | -100.00 | ||||
| 2026-01-16 | 13F | Longboard Asset Management, LP | 0 | -100.00 | 0 | |||||
| 2026-02-05 | 13F | DnB Asset Management AS | 227,725 | 108.96 | 19,482 | 127.61 | ||||
| 2026-01-29 | 13F | DecisionPoint Financial, LLC | 107 | 0.00 | 9 | 12.50 | ||||
| 2026-02-12 | 13F | DRW Securities, LLC | 9,842 | -76.61 | 842 | -74.58 | ||||
| 2026-02-17 | 13F | Bank Of America Corp /de/ | 5,967,006 | 0.23 | 510,477 | 9.18 | ||||
| 2026-02-11 | 13F | IMA Wealth, Inc. | 20 | 2 | ||||||
| 2026-02-17 | 13F | First Manhattan Co | 0 | -100.00 | 0 | |||||
| 2026-01-26 | 13F | SeaBridge Investment Advisors LLC | 17,372 | -0.16 | 1,486 | 8.78 | ||||
| 2026-02-09 | 13F | Employees Retirement System of Texas | 52,305 | -54.79 | 4 | -55.56 | ||||
| 2026-02-17 | 13F | ATLas Financial Planning LLC | 6,155 | 527 | ||||||
| 2026-02-17 | 13F | Edmond De Rothschild Holding S.a. | 232,345 | -1.62 | 19,877 | 7.17 | ||||
| 2026-04-15 | 13F | Monument Capital Management | 2,860 | -4.70 | 215 | -16.02 | ||||
| 2026-02-04 | 13F | Rock Point Advisors, LLC | 104,680 | 2.52 | 8,955 | 11.67 | ||||
| 2026-01-23 | 13F | Diversify Advisory Services, LLC | 3,883 | 6.91 | 283 | -1.05 | ||||
| 2026-01-20 | 13F | Cromwell Holdings LLC | 2,180 | 0.00 | 186 | 8.77 | ||||
| 2026-02-10 | 13F | United Super Pty Ltd in its capacity as Trustee for the Construction & Building Unions Superannuation Fund | 250,143 | 21,400 |